
如何方便地在matplotlib和cartopy中添加位置和大小合适的sub_axes?
如何方便地在matplotlib和cartopy中添加位置和大小合适的sub_axes?
提问于 2017-08-06 00:35:11
我想在第一轴的右上角加一个第二轴。在谷歌搜索之后,我找到了两种方法来做这样的事情:fig.add_axes()和mpl_toolkits.axes_grid.inset_locator.inset_axes。但fig.add_axes()不接受transform arg。因此,下面的代码引发一个错误。所以位置不能在父轴坐标下,而在图形坐标下。
import matplotlib.pyplot as plt
import cartopy.crs as ccrs
fig, ax = plt.subplots(1, 1, subplot_kw={'projection': ccrs.PlateCarree()})
ax2 = fig.add_axes([0.8, 0, 0.2, 0.2], transform=ax.transAxes, projection=ccrs.PlateCarree()) inset_axes()不接受projection arg,所以我不能把ax2作为一个卡通的地理轴。
from mpl_toolkits.axes_grid.inset_locator import inset_axes
import matplotlib.pyplot as plt
import cartopy.crs as ccrs
fig, ax = plt.subplots(1, 1, subplot_kw={'projection': ccrs.PlateCarree()})

# The following line doesn't work
ax2 = inset_axes(ax, width='20%', height='20%', axes_kwargs={'projection': ccrs.PlateCarree()})
# Doesn't work neither:
ax2 = inset_axes(ax, width='20%', height='20%', projection=ccrs.PlateCarree())我在matplotlib问题问过这个问题。似乎下面的代码工作良好,只要它不是一个卡通轴。
import matplotlib as mpl
fig, ax = plt.subplots(1, 1)
box = mpl.transforms.Bbox.from_bounds(0.8, 0.8, 0.2, 0.2)
ax2 = fig.add_axes(fig.transFigure.inverted().transform_bbox(ax.transAxes.transform_bbox(box)))
问题:
如何方便地在matplotlib和cartopy中添加位置和大小合适的sub_axes?
据我所知,在ax.set_extend()之后,轴的大小将发生变化。那么,是否有一种方法可以将sub_axes的某个点(例如:ax2的右上角)锚定在parent_axes的一个固定位置(例如:ax1的右上角)?
Stack Overflow用户
回答已采纳
发布于 2018-12-10 19:05:23
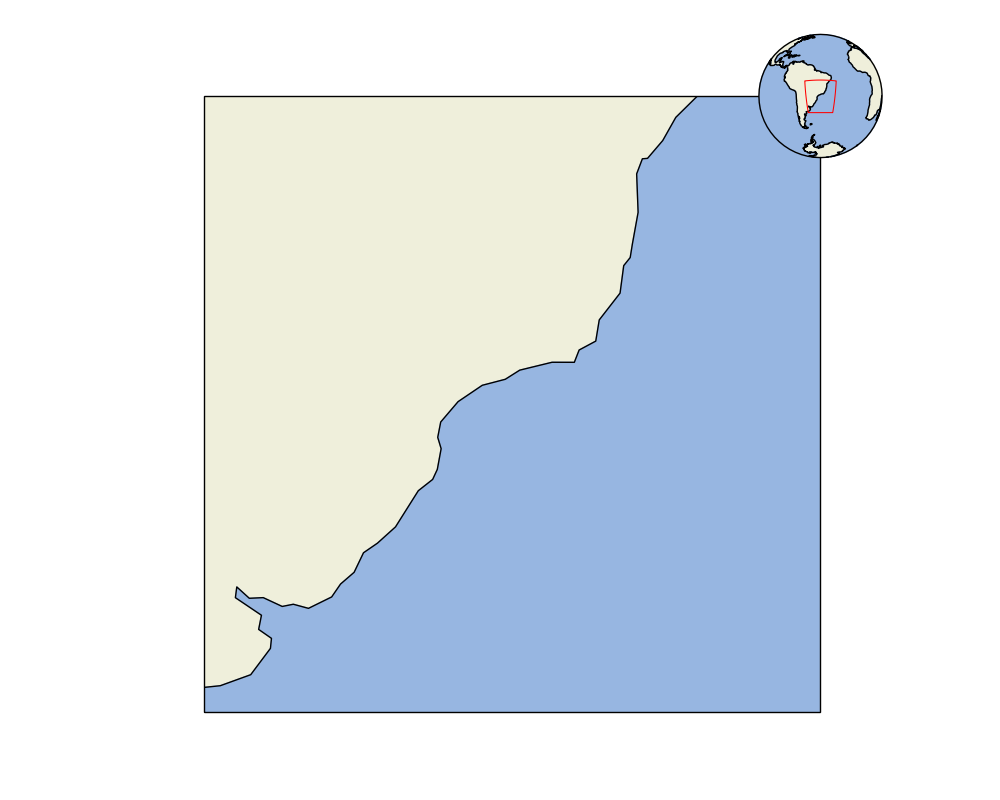
由于inset_axes()不接受projection arg,因此迂回的方式是使用InsetPosition()。通过这种方式,您可以按照通常的方式(使用projection)创建一个轴,然后使用InsetPosition()“链接”两个轴。与使用子图或类似的方法相比,主要的优点是嵌入位置是固定的,您可以调整图形大小或更改主绘图区域,并且嵌入将始终相对于主轴位于相同的位置。这是基于这样的答案:嵌入轴的特定位置,只是添加了肉搏式的做事方式。
import numpy as np
import matplotlib.pyplot as plt
import cartopy.crs as ccrs
import cartopy.feature as cfeature
from mpl_toolkits.axes_grid1.inset_locator import InsetPosition
from shapely.geometry.polygon import LinearRing

extent = [-60, -30, -40, -10]
lonmin, lonmax, latmin, latmax = extent

fig = plt.figure(figsize=(10, 8))
ax = fig.add_subplot(1, 1, 1, projection=ccrs.PlateCarree())
ax.set_extent(extent, crs=ccrs.PlateCarree())
ax.add_feature(cfeature.LAND)
ax.add_feature(cfeature.OCEAN)
ax.add_feature(cfeature.COASTLINE)

# inset location relative to main plot (ax) in normalized units
inset_x = 1
inset_y = 1
inset_size = 0.2

ax2 = plt.axes([0, 0, 1, 1], projection=ccrs.Orthographic(
    central_latitude=(latmin + latmax) / 2,
    central_longitude=(lonmin + lonmax) / 2))
ax2.set_global()
ax2.add_feature(cfeature.LAND)
ax2.add_feature(cfeature.OCEAN)
ax2.add_feature(cfeature.COASTLINE)

ip = InsetPosition(ax, [inset_x - inset_size / 2,
                        inset_y - inset_size / 2,
                        inset_size,
                        inset_size])
ax2.set_axes_locator(ip)

nvert = 100
lons = np.r_[np.linspace(lonmin, lonmin, nvert),
             np.linspace(lonmin, lonmax, nvert),
             np.linspace(lonmax, lonmax, nvert)].tolist()
lats = np.r_[np.linspace(latmin, latmax, nvert),
             np.linspace(latmax, latmax, nvert),
             np.linspace(latmax, latmin, nvert)].tolist()

ring = LinearRing(list(zip(lons, lats)))
ax2.add_geometries([ring], ccrs.PlateCarree(),
                   facecolor='none', edgecolor='red', linewidth=0.75)
页面原文内容由Stack Overflow提供。腾讯云小微IT领域专用引擎提供翻译支持
原文链接:
https://stackoverflow.com/questions/45527584
复制相关文章
相似问题
腾讯云开发者
