
如何使用Chart.js消除不必要的重叠网格线?
如何使用Chart.js消除不必要的重叠网格线?
提问于 2017-08-09 12:53:43
我用Chartjs画了一张图表。我可以解释我想要删除的像素,但我认为图像使它更加清晰:
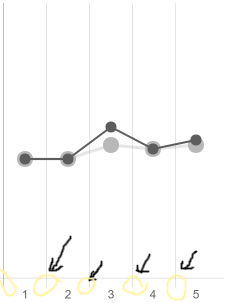
下面是生成此图的代码:
var options = {
    type: 'bar',
    data: {
        labels: ["1", "2", "3", "4", "5"],
        datasets: [
            {
                borderWidth: 2,
                borderColor: "#5d5d5d",
                pointBorderColor: "#5d5d5d",
                pointBackgroundColor: "#5d5d5d",
                pointBorderWidth: 5,
                type: 'line',
                data: [26, 26, 33, 28, 30],
                fill: false,
                lineTension: 0
            },
            {
                borderWidth: 3,
                pointBorderColor: "#b8b8b8",
                pointBackgroundColor: "#b8b8b8",
                pointBorderWidth: 10,
                type: 'line',
                data: [26, 26, 29, 28, 29],
                fill: false,
                lineTension: 0
            },
            {
                data: [0, 0, 0, 0, 0],
                fill: false,
                lineTension: 0
            }
        ]
    },
    options: {
        hover: {mode: null},
        legend: {
            display: false
        },
        tooltips: {enabled: false},
        hover: {mode: null},
        scales: {
            xAxes: [{
                gridLines: {
                    // drawBorder: false,
                },
            }],
            yAxes: [{
                display: false,
                ticks: {
                    suggestedMin: 0,
                    max: 60,
                    beginAtZero: true
                }
            }]
        }
    }
}

var ctx = document.getElementById(elementID).getContext('2d');
new Chart(ctx, options);
有人知道我如何使用Chart.js删除那些不必要的覆盖线吗?
回答 1
Stack Overflow用户
回答已采纳
发布于 2017-08-09 13:57:28
您可以使用以下图表插件来删除那些不必要的覆盖线:
Chart.plugins.register({
   beforeDraw: function(chart) {
      var ctx = chart.chart.ctx,
         x_axis = chart.scales['x-axis-0'],
         topY = chart.scales['y-axis-0'].top,
         bottomY = chart.scales['y-axis-0'].bottom;
      x_axis.options.gridLines.display = false;
      x_axis.ticks.forEach(function(label, index) {
         var x = x_axis.getPixelForValue(label);
         ctx.save();
         ctx.beginPath();
         ctx.moveTo(x, topY);
         ctx.lineTo(x, bottomY);
         ctx.lineWidth = 1;
         ctx.strokeStyle = x_axis.options.gridLines.color;
         ctx.stroke();
         ctx.restore();
      });
   }
});
ᴡᴏʀᴋɪɴɢᴅᴇᴍᴏ⧩
Chart.plugins.register({
   beforeDraw: function(chart) {
      var ctx = chart.chart.ctx,
         x_axis = chart.scales['x-axis-0'],
         topY = chart.scales['y-axis-0'].top,
         bottomY = chart.scales['y-axis-0'].bottom;
      x_axis.options.gridLines.display = false;
      x_axis.ticks.forEach(function(label, index) {
         var x = x_axis.getPixelForValue(label);
         ctx.save();
         ctx.beginPath();
         ctx.moveTo(x, topY);
         ctx.lineTo(x, bottomY);
         ctx.lineWidth = 1;
         ctx.strokeStyle = x_axis.options.gridLines.color;
         ctx.stroke();
         ctx.restore();
      });
   }
});

var options = {
   type: 'bar',
   data: {
      labels: ["1", "2", "3", "4", "5"],
      datasets: [{
         borderWidth: 2,
         borderColor: "#5d5d5d",
         pointBorderColor: "#5d5d5d",
         pointBackgroundColor: "#5d5d5d",
         pointBorderWidth: 5,
         type: 'line',
         data: [26, 26, 33, 28, 30],
         fill: false,
         lineTension: 0
      }, {
         borderWidth: 3,
         pointBorderColor: "#b8b8b8",
         pointBackgroundColor: "#b8b8b8",
         pointBorderWidth: 10,
         type: 'line',
         data: [26, 26, 29, 28, 29],
         fill: false,
         lineTension: 0
      }, {
         data: [0, 0, 0, 0, 0],
         fill: false,
         lineTension: 0
      }]
   },
   options: {
      hover: {
         mode: null
      },
      legend: {
         display: false
      },
      tooltips: {
         enabled: false
      },
      hover: {
         mode: null
      },
      scales: {
         xAxes: [{
            gridLines: {
               // drawBorder: false,
            },
         }],
         yAxes: [{
            display: false,
            ticks: {
               suggestedMin: 0,
               max: 60,
               beginAtZero: true
            }
         }]
      }
   }
}

var ctx = document.getElementById('canvas').getContext('2d');
new Chart(ctx, options);<script src="https://cdnjs.cloudflare.com/ajax/libs/Chart.js/2.6.0/Chart.min.js"></script>
<canvas id="canvas"></canvas>
页面原文内容由Stack Overflow提供。腾讯云小微IT领域专用引擎提供翻译支持
原文链接:
https://stackoverflow.com/questions/45591269
复制相关文章
相似问题
腾讯云开发者
