
TikZ:绘制缺少值的数据文件
TikZ:绘制缺少值的数据文件
提问于 2017-08-21 18:27:52
我有这样的数据:
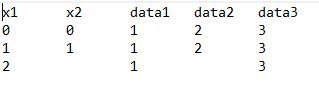
data2漏掉了第三点。因此,我想,我应该定义两个不同的x列,并将data2分配给x2。
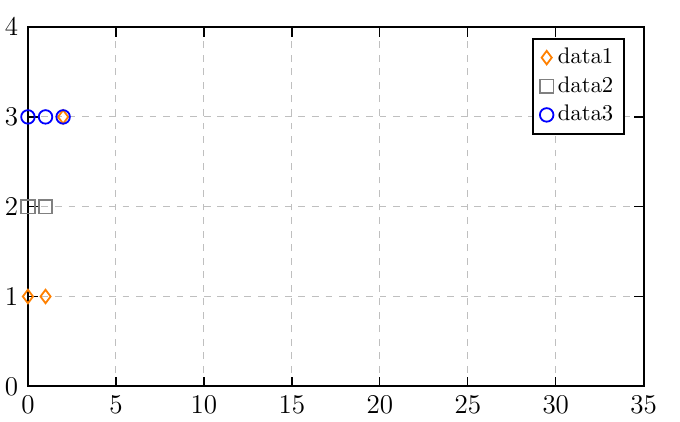
问题:在编译的图形中,data1的第三个点上升到3。如果我有不同的,更多的价值观,点数开始去任何地方,但不属于他们的地方。
这就是我使用的代码:
\addplot[only marks, mark = diamond, color = orange, mark size = 3pt]
 table[x=x1, y=data1]{example.dat};
\addlegendentry{data1};

\addplot[only marks, mark = square, color = gray, mark size = 3pt]
 table[x=x2, y=data2]{example.dat};
\addlegendentry{data2};

\addplot[only marks, mark = o, color = blue, mark size = 3pt]
 table[x=x1, y=data3]{example.dat};
\addlegendentry{data3};
这是我得到的图表:
非常感谢!
顺便说一句。在实际数据中,一个数据集在数据中间缺少一个x/y值。我希望与我的榜样相比,这不重要。
回答 1
Stack Overflow用户
回答已采纳
发布于 2017-08-22 08:55:23
pgfplots将两个制表符解释为一个分隔符。因此,它将数据文件视为:
x1  x2  data1   data2   data3
0   0   1   2   3
1   1   1   2   3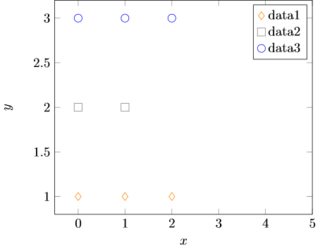
2 1 3解决方案1.您可以用NaN替换空单元格。pgfplots将正确地解释这一点:
x1  x2  data1   data2   data3
0   0   1   2   3
1   1   1   2   3
2 nan 1 nan 3解决方案2.使用另一种类型的分隔符(例如,分号或逗号):
\begin{filecontents*}{example.csv}
x1;x2;data1;data2;data3
0;0;1;2;3
1;1;1;2;3
2;;1;;3
\end{filecontents*}
\pgfplotstableread[col sep = semicolon]{example.csv}\mydata

\begin{document}
...
在这里,我已经在TeX文件中包含了数据文件,但是它也应该与一个单独的数据文件一起工作。
页面原文内容由Stack Overflow提供。腾讯云小微IT领域专用引擎提供翻译支持
原文链接:
https://stackoverflow.com/questions/45803521
复制相关文章
相似问题
腾讯云开发者
