
如何在GNUplot中绘制3列?
如何在GNUplot中绘制3列?
提问于 2017-09-25 12:58:55
我有这样的文件:
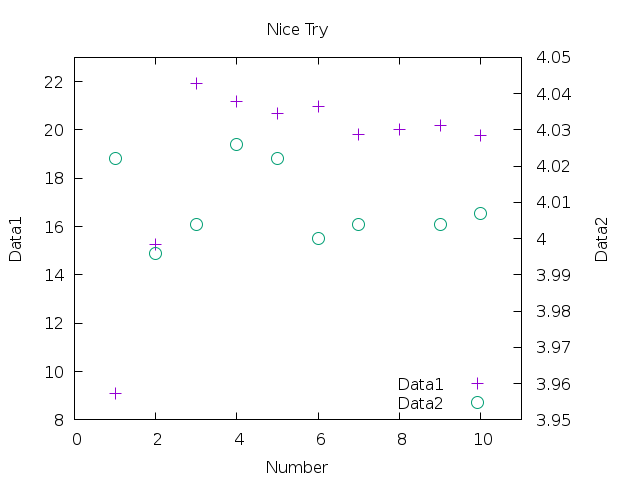
Number Data1 Data2
 1  9.10 4.022
 2  15.27 3.996
 3  21.92 4.004
 4  21.19 4.026
 5  20.67 4.022
 6  20.99 4.000
 7  19.80 4.004
 8  20.01 3.931
 9  20.18 4.004
10  19.78 4.007
我想用X轴画数字,在Data1中画leftY,用rightY画Data2,但是我想不出怎么做。
谢谢
回答 1
Stack Overflow用户
回答已采纳
发布于 2017-09-25 15:25:00
只是一个简短的带注释的示例,使用保存在文件so.dat中的数据
# Set ticks for 2nd y axis
set y2tics
# We don't want to see the left ticks on the right axis
set ytics nomirror

# Set ranges so that the data points are not on the axis
set xrange [0:11]
set yrange [8:23]
set y2range[3.95:4.05]

# use first line of the file for labels
set key autotitle columnhead
# display key in least busy area
set key bottom right

# Title and axis labels
set title "Nice Try"
set xlabel "Number"
set ylabel "Data1"
set y2label "Data2"

plot "so.dat" using 1:2 axes x1y1 with points pointsize 2,\
     "" u 1:3 axes x1y2 w p ps 2 pointtype 6
一个人可以做更多的装饰等等,但我认为这是你想要的本质。所产生的图表:
页面原文内容由Stack Overflow提供。腾讯云小微IT领域专用引擎提供翻译支持
原文链接:
https://stackoverflow.com/questions/46405875
复制相关文章
相似问题
腾讯云开发者
