
基于循环百分比MATLAB的两种不同时间点正弦波的插值
基于循环百分比MATLAB的两种不同时间点正弦波的插值
提问于 2017-10-25 13:43:28
我有两个正弦波,不同的时间点如下:
t1=1:10;
y1=sin(t1);
per1=100./t1;

t2=1:12;
y2=sin(2*t2);
per2=100./t2;正如你所看到的,一个y变量有12个时间点,另一个只有10个时间点。如果我们把每个周期看作一个周期,用百分比表示,我想把10和12个时间点的正弦波放在一个0-100%的标度上,然后把它们和起来。
使用这种技术,我将添加两个正弦波,不是基于时间,而是基于周期的百分比。
回答 1
Stack Overflow用户
回答已采纳
发布于 2017-10-25 16:45:03
您应该创建一些公共轴,并使用插值(例如interp1)来逼近所有这些点的值。然后你可以把它们加进去。
% Your data, but with smaller intervals so it doesn't look like junk!
t1 = 1:0.01:10; y1 = sin(t1);
t2 = 1:0.02:12; y2 = sin(2*t2);
% Interpolation to the highest number of points
N = max(numel(t1), numel(t2));
y1interp = interp1(t1, y1, linspace(min(t1), max(t1), N), 'linear');
y2interp = interp1(t2, y2, linspace(min(t2), max(t2), N), 'linear');
% Put on a common percentage axes with N points
pct = linspace(0, 1, N);
% Plot (or do whatever else!)
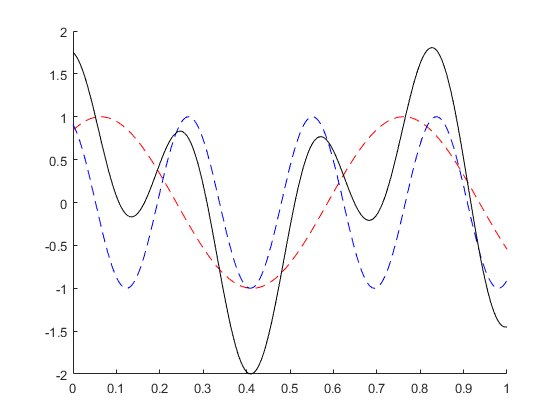
figure; hold on;
plot(pct, y1interp, '--r');
plot(pct, y2interp, '--b');
plot(pct, y1interp + y2interp, '-k');
hold off;输出
注意:您可能想阅读奈奎斯特定理 --通过它,您应该考虑将用于插值的普通样本数N增加到我使用的两倍。
页面原文内容由Stack Overflow提供。腾讯云小微IT领域专用引擎提供翻译支持
原文链接:
https://stackoverflow.com/questions/46934084
复制相关文章
相似问题
腾讯云开发者
