
如何用SciPy对非均匀信号进行均匀重采样?
如何用SciPy对非均匀信号进行均匀重采样?
提问于 2017-11-04 18:17:00
我有一个不均匀采样率的(x, y)信号在x中.(抽样率大致与1/x成正比)。我试图使用scipy.signal的resample函数统一地重新采样它。根据我从文档中了解到的情况,我可以传递以下参数:
scipy.resample(array_of_y_values, number_of_sample_points, array_of_x_values)
,它将返回
[[resampled_y_values],[new_sample_points]]
我希望它返回一个均匀采样数据,其形式与原始数据大致相同,具有相同的最小和最大x值。但事实并非如此:
# nu_data = [[x1, x2, ..., xn], [y1, y2, ..., yn]]
# with x values in ascending order

length = len(nu_data[0])
resampled = sg.resample(nu_data[1], length, nu_data[0])

uniform_data = np.array([resampled[1], resampled[0]])

plt.plot(nu_data[0], nu_data[1], uniform_data[0], uniform_data[1])
plt.show()
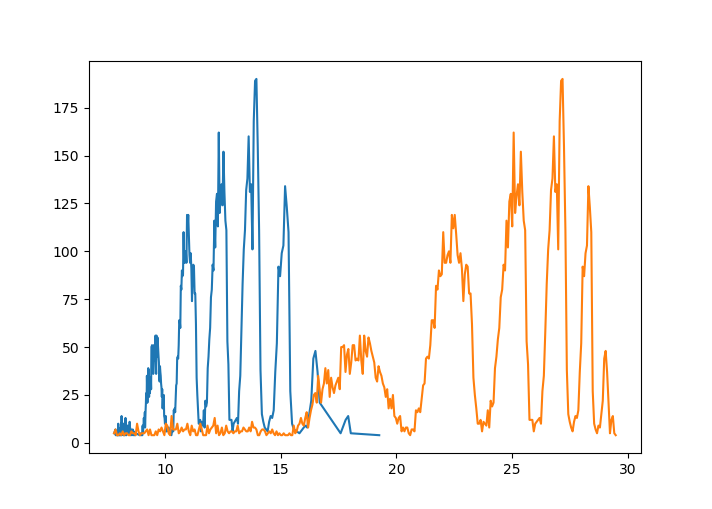
蓝色:nu_data__,橙色:uniform_data
它看上去并不是不变的,而且x尺度也被调整了。如果我试图修正范围:自己构造所需的统一x值并使用它们,失真仍然存在:
length = len(nu_data[0])
resampled = sg.resample(nu_data[1], length, nu_data[0])
delta = (nu_data[0,-1] - nu_data[0,0]) / length
new_samplepoints = np.arange(nu_data[0,0], nu_data[0,-1], delta)
uniform_data = np.array([new_samplepoints, resampled[0]])

plt.plot(nu_data[0], nu_data[1], uniform_data[0], uniform_data[1])
plt.show()
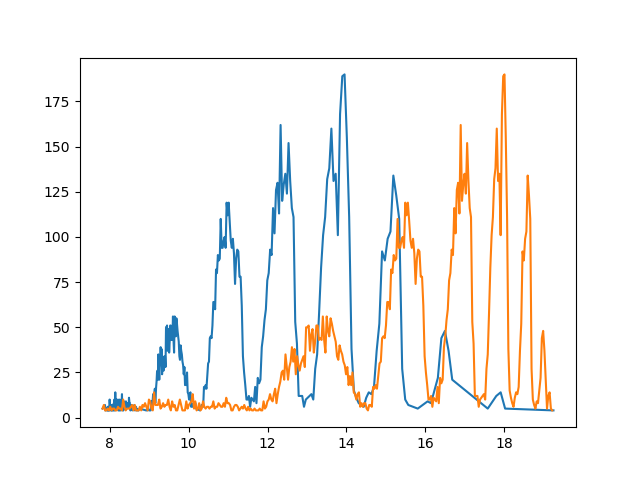
,如果不是这样的话,用什么方法来统一地重新采样我的数据呢?
回答 1
Stack Overflow用户
回答已采纳
发布于 2017-11-05 12:12:26
请看这个粗略的解决方案:
import matplotlib.pyplot as plt
from scipy import interpolate
import numpy as np

x = np.array([0.001, 0.002, 0.005, 0.01, 0.02, 0.05, 0.1, 0.2, 0.5, 1, 2, 5, 10, 20])
y = np.exp(-x/3.0)
flinear = interpolate.interp1d(x, y)
fcubic = interpolate.interp1d(x, y, kind='cubic')

xnew = np.arange(0.001, 20, 1)
ylinear = flinear(xnew)
ycubic = fcubic(xnew)
plt.plot(x, y, 'X', xnew, ylinear, 'x', xnew, ycubic, 'o')
plt.show()
这是一个从枕页中更新的示例。如果你执行它,你应该会看到这样的东西:
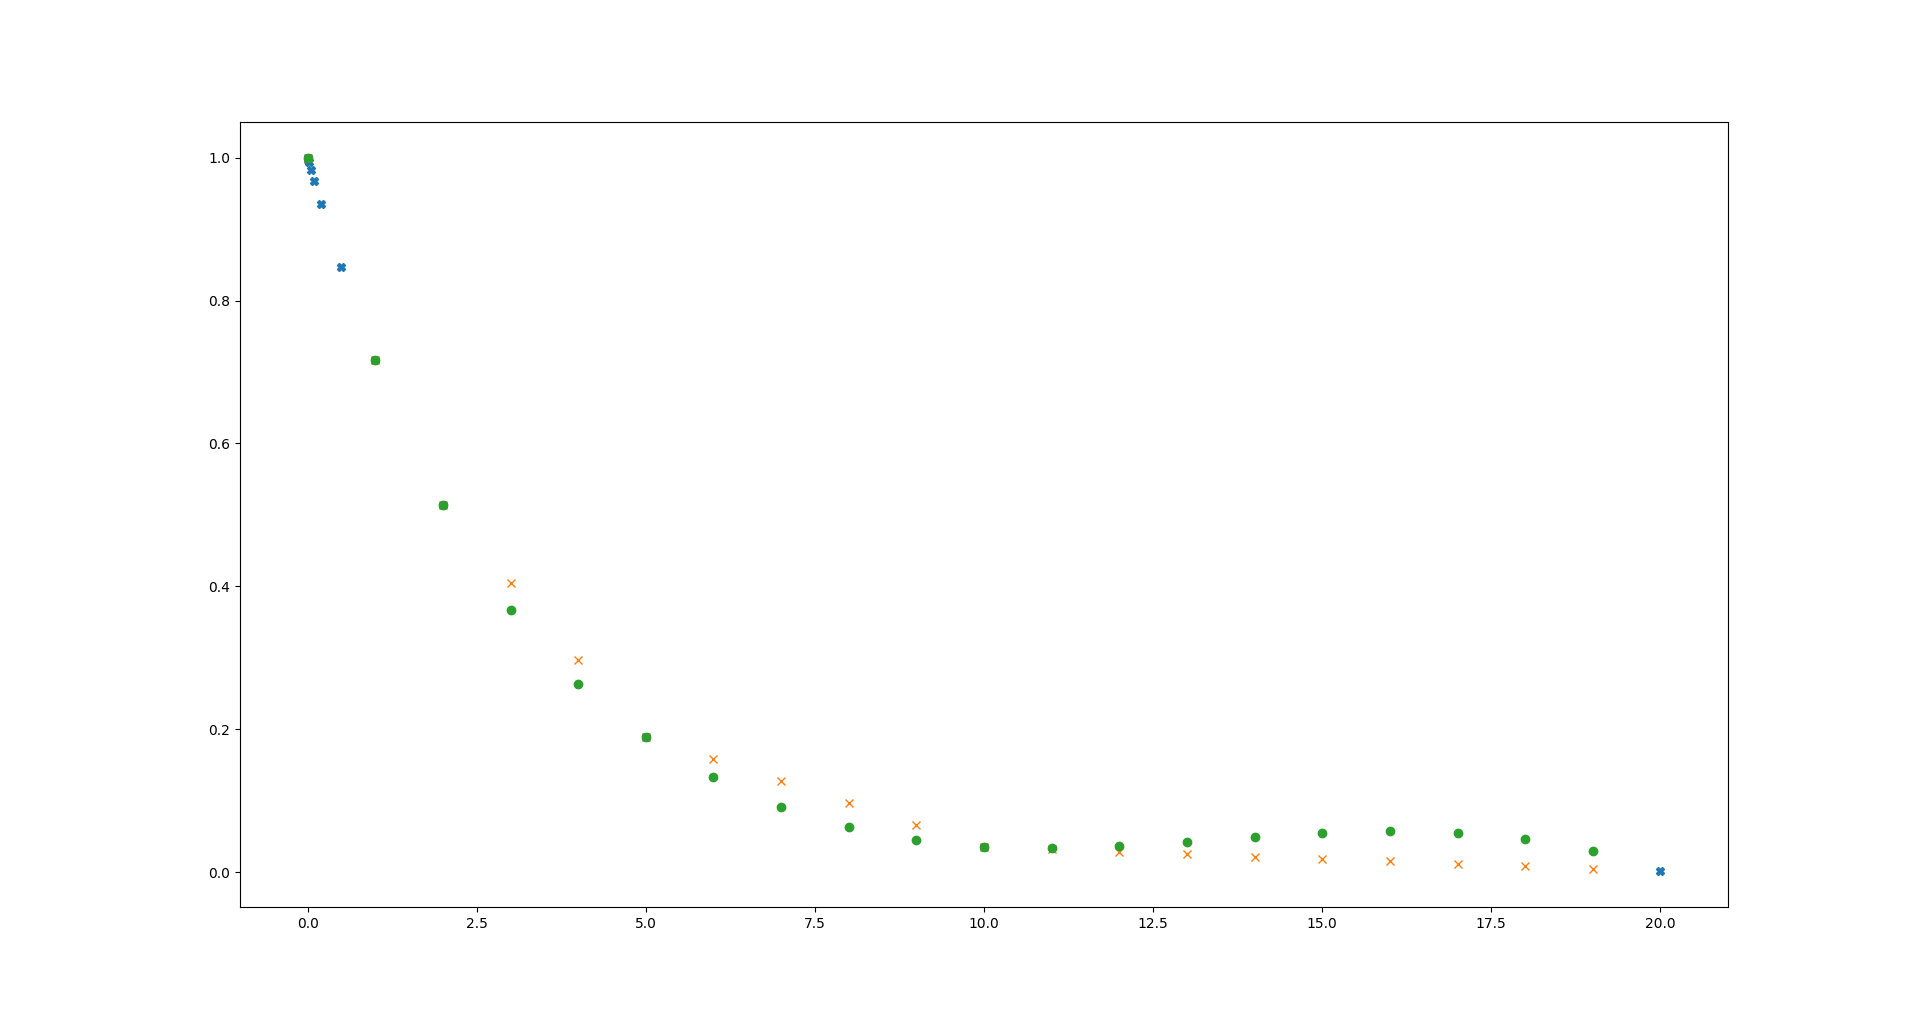
蓝色十字是初始函数,你的信号具有不均匀的采样分布。有两个结果-橙色x-表示线性插值和绿色点-三次插值。问题是你更喜欢哪种选择?就我个人而言,我不喜欢他们两人,这就是为什么我通常取4点在他们之间插入,然后另一点.在没有奇怪的情况下有三次插值。这是更多的工作,而且我看不出用枕木做它,所以它将是缓慢的。这就是我问数据大小的原因。
页面原文内容由Stack Overflow提供。腾讯云小微IT领域专用引擎提供翻译支持
原文链接:
https://stackoverflow.com/questions/47113979
复制相关文章
相似问题
腾讯云开发者
