
用ggplot2绘制R中高斯混合图
用ggplot2绘制R中高斯混合图
提问于 2017-11-12 12:13:05
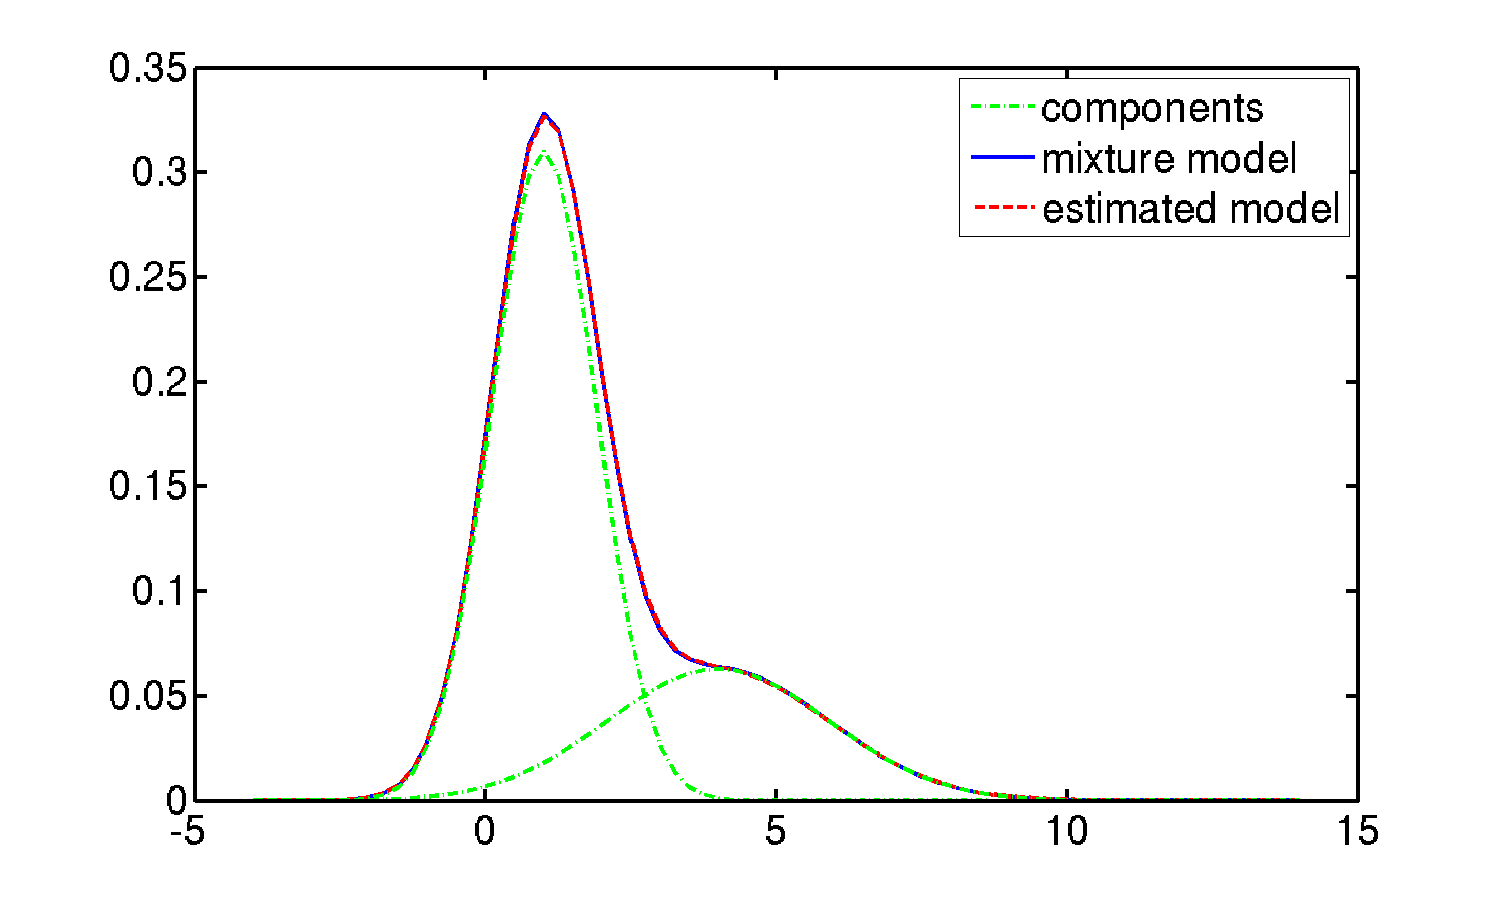
我正在用高斯混合近似一个分布,并想知道是否有一种简单的方法可以自动地用ggplot2将整个(单维)数据集的估计内核密度绘制成组件密度之和,就像这样:
考虑到下面的示例数据,我在ggplot2中的方法是手动将子集密度绘制成缩放的总体密度,如下所示:
#example data
a<-rnorm(1000,0,1) #component 1
b<-rnorm(1000,5,2) #component 2
d<-c(a,b) #overall data
df<-data.frame(d,id=rep(c(1,2),each=1000)) #add group id

##ggplot2
require(ggplot2)

ggplot(df) +
  geom_density(aes(x=d,y=..scaled..)) +
  geom_density(data=subset(df,id==1), aes(x=d), lty=2) +
  geom_density(data=subset(df,id==2), aes(x=d), lty=4)
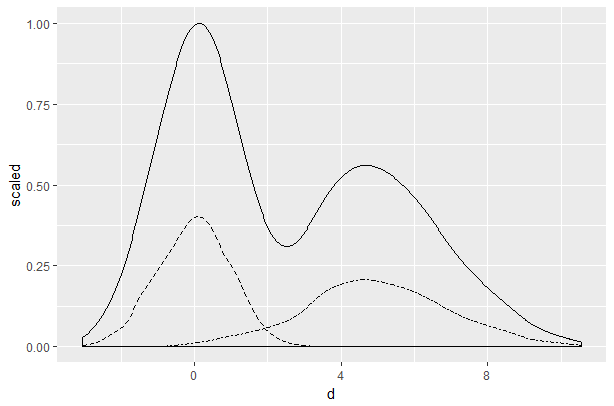
请注意,这并不适用于天平。它也不工作,当你缩放所有3个密度或根本没有密度。所以我无法复制上面的情节。
此外,不需要手动子集,我就无法自动生成此图。我尝试在geom_density中使用position =“堆栈”作为参数。
我通常每个数据集有5-6个组件,所以手动设置是可能的。然而,我想要有不同的颜色或线类型的每个组件密度显示在图形的图例,所以做所有的子集手动将增加工作量相当多。
有什么想法吗?谢谢!
回答 1
Stack Overflow用户
回答已采纳
发布于 2017-11-12 12:45:22
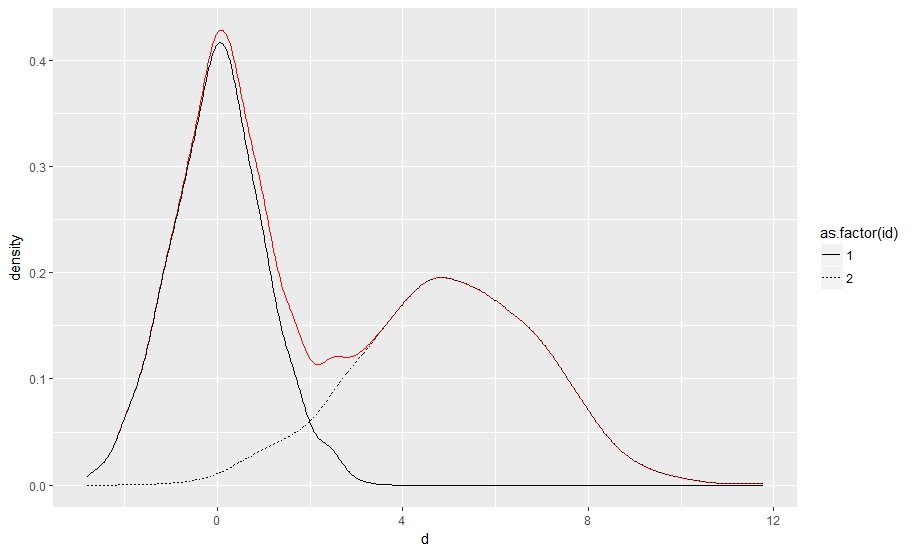
下面是一个可能的解决方案,方法是在aes调用中指定每个密度,在一个层中使用position = "identity",在第二个层中使用堆栈密度,而不使用图例。
ggplot(df) +
  stat_density(aes(x = d,  linetype = as.factor(id)), position = "stack", geom = "line", show.legend = F, color = "red") +
  stat_density(aes(x = d,  linetype = as.factor(id)), position = "identity", geom = "line")
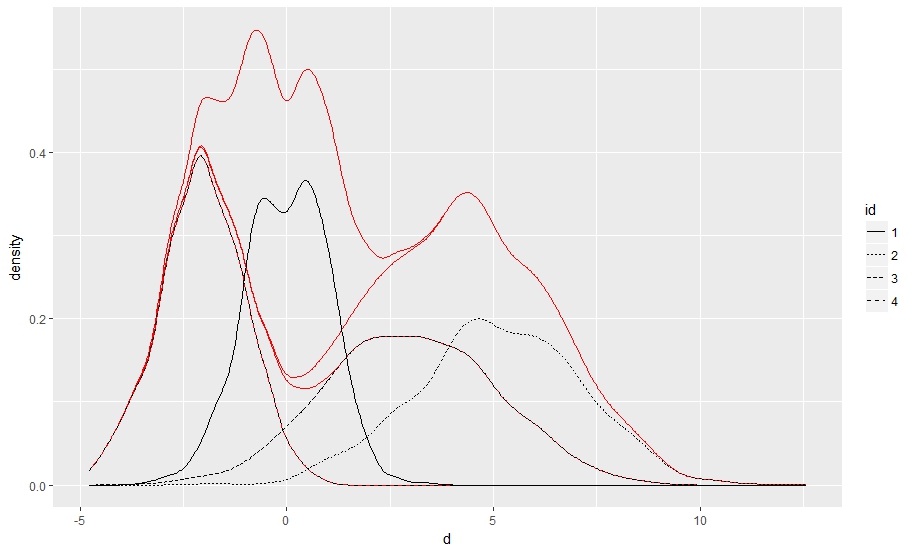
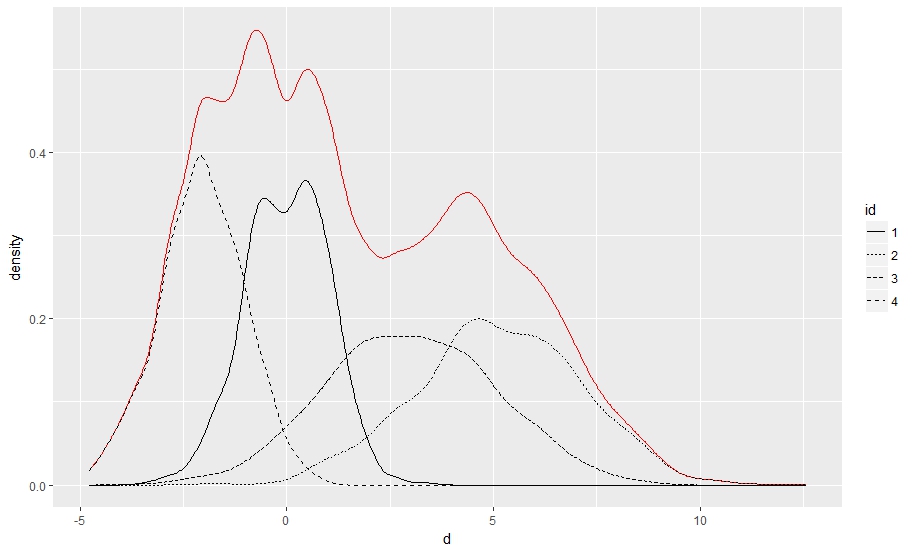
请注意,当使用两个以上的组时:
  a <- rnorm(1000, 0, 1)
  b <- rnorm(1000, 5, 2)
  c <- rnorm(1000, 3, 2)
  d <- rnorm(1000, -2, 1)
  d <- c(a, b, c, d)
df <- data.frame(d, id = as.factor(rep(c(1, 2, 3, 4), each = 1000))) 每个堆栈的曲线都会出现(这是两个组示例的问题,但是第一层的linetype伪装了它--使用group代替检查):
 gplot(df) +
    stat_density(aes(x = d, group = id), position = "stack", geom = "line", show.legend = F, color = "red") +
    stat_density(aes(x = d, linetype = id), position = "identity", geom = "line")
解决这一问题的一个相对容易的方法是添加alpha映射,并对不需要的曲线手动将其设置为0:
  ggplot(df) +
    stat_density(aes(x=d, alpha = id), position = "stack", geom = "line", show.legend = F, color = "red") +
    stat_density(aes(x=d,  linetype = id), position = "identity", geom = "line")+
    scale_alpha_manual(values = c(1,0,0,0))
页面原文内容由Stack Overflow提供。腾讯云小微IT领域专用引擎提供翻译支持
原文链接:
https://stackoverflow.com/questions/47248636
复制相关文章
相似问题
腾讯云开发者
