
用标记对簇进行着色
我想知道,如何根据它中的图标对集群进行着色。
我的数据:
remorque       time.stamp      lat      long geolocalisation maintenance temperature appairage
1        21/11/2017 10:36 48.86272 2.2875920          OnMouv        noir
2        21/11/2017 10:36 43.60776 1.4421606       StartMouv                   rouge
3        21/11/2017 10:36 46.58619 0.3388710          OnMouv                   rouge
4        21/11/2017 10:36 45.76695 3.0556216            Life                  orange
5        21/11/2017 10:36 45.14555 1.4751652         EndMouv                             rouge
6        21/11/2017 10:36 46.81157 1.6936336            Life                  orange
7        21/11/2017 10:36 47.36223 0.6751146          alerte                             rouge
8        21/11/2017 10:36 47.36032 1.7441244       StartMouv
9        21/11/2017 10:36 48.85333 1.8215332       StartMouv
10       21/11/2017 10:36 48.84429 1.7913208          alerte
11       21/11/2017 10:36 48.81356 1.6759643         EndMouv
示例:
如果在我的集群中有一个图标,带有appairage = rouge,那么集群的颜色应该是红色。
如果没有红色图标,如果我的集群中有一个图标,温度=橙色,那么集群的颜色应该是橙色。
..。对于每个变量(温度、温度、维护)。如果文化中的所有图标都有它们的变量,那么集群应该是绿色的。
我的地图看起来像:
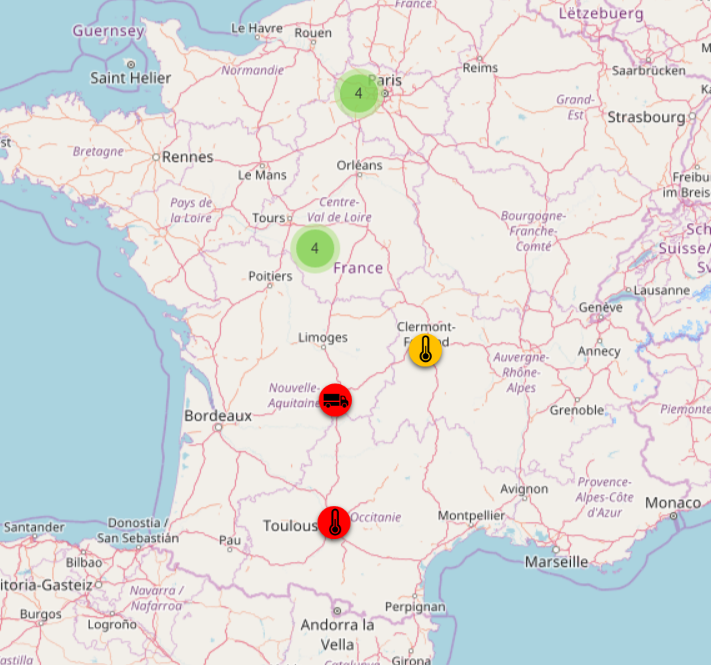
我找到了一种方法来改变在互联网上对集群着色的范围。但我不想对集群中的每一个标记进行着色。
回答 2
Stack Overflow用户
发布于 2017-11-30 21:26:40
可以根据聚集在一起的图标的属性对聚集的图标进行着色。最简单的方法可能是使用htmlwidget并在地图呈现中调用javascript函数。
但是,在进入htmlwidget之前,需要为群集层设置一个clusterId:
addAwesomeMarkers(clusterId = "cluster" ...
现在我们可以在htmlwidget中找到这个层:
function(el, x) {
  map = this;  // the map object
var cluster = map.layerManager.getLayer('cluster','cluster'); // the cluster layer在集群层中,我们希望为图标属性iconCreateFunction创建一个函数。
cluster.options.iconCreateFunction = function(d) {
    // generate icon
}
这一职能应:
- 遍历由聚集标记所代表的所有子标记,
- 确定这些儿童标记的最高等级。
- 返回适当的图标
1.遍历子标记
对于第一个,并在上面的基础上,我们可以迭代每一个子标记使用:
cluster.options.iconCreateFunction = function(c) {
    var markers = c.getAllChildMarkers();
    markers.forEach(function(m) {
       // do something for each marker
    })
}我使用c表示集群,使用m表示每个子标记
2.获得排名最高的商标
列表中的主要挑战是确定子图标的最高级别--因为数据没有绑定到图标,我们在选项中受到限制。假设图标的颜色与dataframe中项的颜色代码相对应,我将使用图标的颜色来确定其优先级/级别。在确定了最高级别的子级之后,我将根据该子类的级别对集群进行着色。
我将把集群的颜色涂成如下(因为我相信这是您的预期结果):
- 红色如果任何子图标是红色的,
- 橙色如果没有红色,但有一些橙色的孩子,和
- 绿色,如果没有橙色或红色的孩子。
要得到颜色,我需要访问适当的属性。标记的颜色(填充)位于:
marker.options.icon.options.markerColor为了比较颜色,我将使用一个对象来表示每种颜色的级别,这将允许对颜色进行简单的比较:
var priority = {
  'green':0,
  'orange':1,
  'red':2
}
这样可以:
cluster.options.iconCreateFunction = function(c) {
  var markers = c.getAllChildMarkers();
  var priority = {
    'green': 0,
    'orange': 1,
    'red': 2
  };
  var highestRank = 0; // defaults to the lowest level to start

  markers.forEach(function(m) {
    var color = m.options.icon.options.markerColor;

    // check each marker to see if it is the highest value
    if(priority[color] > highestRank) {
      highestRank = priority[color];
    }
  })
}
3.返回图标
既然我们有了一个表示颜色的值,我们就可以返回一个图标。传单聚集图标有有限的样式选择。他们使用L.divIcon(),这在一定程度上限制了选项。当与用于集群标签的css样式相结合时,它们创建了熟悉的绿色、黄色和橙色的圆圈。
这些默认样式具有以下css类:
.marker-cluster-small // green
.marker-cluster-medium  // yellow
.marker-cluster-large // orange
如果我们对仅仅使用这些类感到满意,那么我们可以用最小的努力来设计聚类多边形的样式:
var styles = [
    'marker-cluster-small', // green
    'marker-cluster-medium',  // yellow
    'marker-cluster-large' // orange
]

var style = styles[highestRank];
var count = markers.length;

return L.divIcon({ html: '<div><span>'+count+'</span></div>', className: 'marker-cluster ' + style, iconSize: new L.Point(40, 40) });
因此,整个小部件如下所示:
function(el,x) {
  map = this;
  var cluster = map.layerManager.getLayer('cluster','cluster');
  cluster.options.iconCreateFunction = function(c) {
    var markers = c.getAllChildMarkers();
    var priority = {
      'green': 0,
      'orange': 1,
      'red': 2
    };
    var highestRank = 0; // defaults to the lowest level to start

    markers.forEach(function(m) {
      var color = m.options.icon.options.markerColor;

      // check each marker to see if it is the highest value
      if(priority[color] > highestRank) {
        highestRank = priority[color];
      }
    })

    var styles = [
      'marker-cluster-small', // green
      'marker-cluster-medium',  // yellow
      'marker-cluster-large' // orange
    ]

    var style = styles[highestRank];
    var count = markers.length;

    return L.divIcon({ html: '<div><span>'+count+'</span></div>', className: 'marker-cluster ' + style, iconSize: new L.Point(40, 40) });
  }
}
精炼图标
变换颜色
您可能想让高优先级的图标显示为红色。这是可以做到的,但您需要添加css样式到您的地图。
在更改上面的图标函数的同时,这样做的一种方法是在小部件中添加一个带有javascript的样式到页面中。您需要制作两种样式,一种用于持有图标的div,另一种用于图标,您可以同时完成这两种操作:
var style = document.createElement('style');
  style.type = 'text/css';
  style.innerHTML = '.red, .red div { background-color: rgba(255,0,0,0.6); }'; // set both at the same time
document.getElementsByTagName('head')[0].appendChild(style);(来自https://stackoverflow.com/a/1720483/7106086)
不要忘记更新在样式数组中使用的类:
    var styles = [
      'marker-cluster-small', // green
      'marker-cluster-medium',  // yellow
      'red' // red
]在图标中显示更多信息
您不局限于图标中的数字,您可以显示1-3-5,表示一个高优先级,三个介质等等。您只需要跟踪每个优先级的子图标在每个集群中有多少个:
var children = [0,0,0];
markers.forEach(function(m) {
  var color = m.options.icon.options.markerColor;
  children[priority[color]]++; // increment the appropriate value in the children array.
  ...
然后用以下方式显示出来:
return L.divIcon({ html: '<div><span>'+children.reverse()+'</span>...给予类似于:
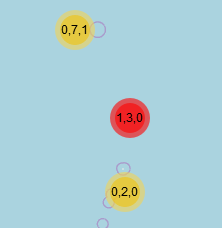
测试示例
除了图标中的附加文本(使用这些文档示例中的代码作为基础)之外,它应该是可复制和可传递的,以显示所有内容:
library(leaflet)

# first 20 quakes
df.20 <- quakes[1:50,]

getColor <- function(quakes) {
  sapply(quakes$mag, function(mag) {
    if(mag <= 4) {
      "green"
    } else if(mag <= 5) {
      "orange"
    } else {
      "red"
    } })
}

icons <- awesomeIcons(
  icon = 'ios-close',
  iconColor = 'black',
  library = 'ion',
  markerColor = getColor(df.20)
)

leaflet(df.20) %>% addTiles() %>%
  addAwesomeMarkers(~long, ~lat, icon=icons, label=~as.character(mag), clusterOptions = markerClusterOptions(), group = "clustered", clusterId = "cluster") %>%
  htmlwidgets::onRender("function(el,x) {
  map = this;

  var style = document.createElement('style');
  style.type = 'text/css';
  style.innerHTML = '.red, .red div { background-color: rgba(255,0,0,0.6); }'; // set both at the same time
  document.getElementsByTagName('head')[0].appendChild(style);


  var cluster = map.layerManager.getLayer('cluster','cluster');
  cluster.options.iconCreateFunction = function(c) {
    var markers = c.getAllChildMarkers();
    var priority = {
     'green': 0,
     'orange': 1,
     'red': 2
    };
    var highestRank = 0; // defaults to the lowest level to start

    markers.forEach(function(m) {
    var color = m.options.icon.options.markerColor;

    // check each marker to see if it is the highest value
    if(priority[color] > highestRank) {
       highestRank = priority[color];
     }
  })

  var styles = [
    'marker-cluster-small', // green
    'marker-cluster-large',  // orange
    'red' // red
  ]

  var style = styles[highestRank];
  var count = markers.length;

   return L.divIcon({ html: '<div><span>'+count+'</span></div>', className: 'marker-cluster ' + style, iconSize: new L.Point(40, 40) });
 }
}")Stack Overflow用户
发布于 2019-10-07 07:18:43
现在还可以在iconCreateFunction中使用markerClusterOptions。确保传递要在markerOptions中用于着色的变量。
一个例子是:
legend_pal <- hcl.colors(10, palette='Spectral', rev = T)

leaflet(quakes) %>% addTiles() %>% addMarkers(
  options = markerOptions(mag = ~mag),
  clusterOptions = markerClusterOptions(
    iconCreateFunction=~JS(paste0("function (cluster) {
                          var markers = cluster.getAllChildMarkers();
                          var sum = 0;
                          for (i = 0; i < markers.length; i++) {
                            sum += Number(markers[i].options.mag);
                          }
                          var palette = ['", paste0(legend_pal, collapse="','"),"'];
                          var domain = [", paste0(sort(unique(na.omit(mag))), collapse=','),"];

                          var count = markers.length;
                          var avg = sum/count;
                          c = palette[Math.round(palette.length*(avg-Math.min(...domain))/(Math.max(...domain) - Math.min(...domain)))];


                          return L.divIcon({
                            html: '<div style=\"background-color:'+c+'\"><span>'+avg+'</span></div>',
                            className: 'marker-cluster',
                            iconSize: new L.Point(40, 40) });
                          }")))) %>%
  addLegend(pal=colorNumeric(
    palette = legend_pal,
    domain = quakes$mag,
na.color = 'transparent'), values = ~mag)https://stackoverflow.com/questions/47507854
复制相似问题
腾讯云开发者
