
如何在TradingView松脚本中绘制垂直线?
如何在TradingView松脚本中绘制垂直线?
提问于 2017-12-02 17:38:32
我试图使用基于网络的TradingView平台来制作我自己的自定义脚本,以显示各种金融市场属性。通过它的松树脚本引擎/解释器,这是可能的。
目前,我正试图简单地在主图表或指示图上显示一条垂直线。但是,他们的脚本引擎似乎并不支持垂直行,除非使用了绘图的histogram或column类型。无论如何,我都无法得到任何令人满意的台词。
一些测试
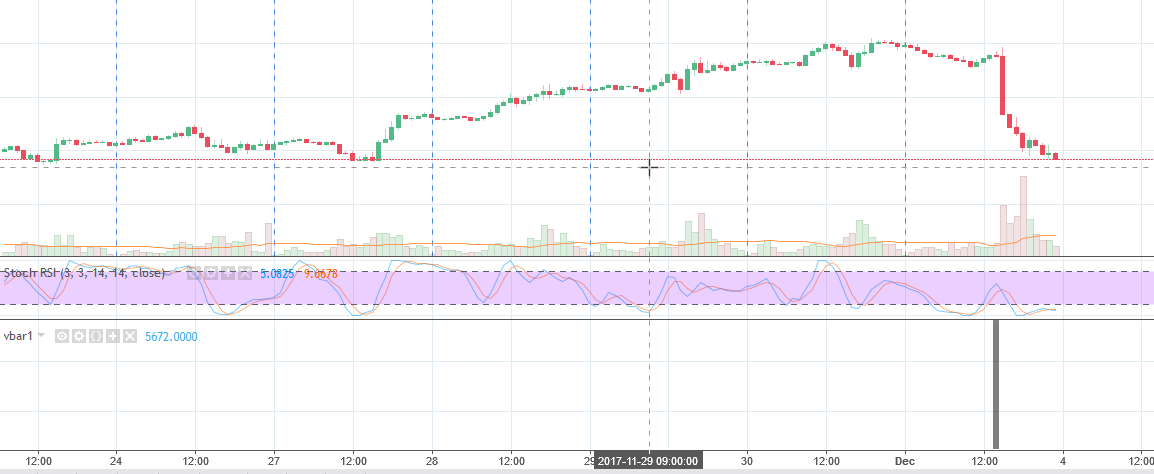
(1) --我在使用bgcolor()方面取得了一些小小的成功:
//@version=3
study(title="vbar1", overlay = false)
trange(res, sess) => not na(time(res, sess))
vlinecol = #000000 // black
plot(n, color = na) // check last value from plot but don't display
vline =  (n < 5710) ? na : trange("1", "0700-0701") ? vlinecol : na
bgcolor(vline, transp=0)
这导致:
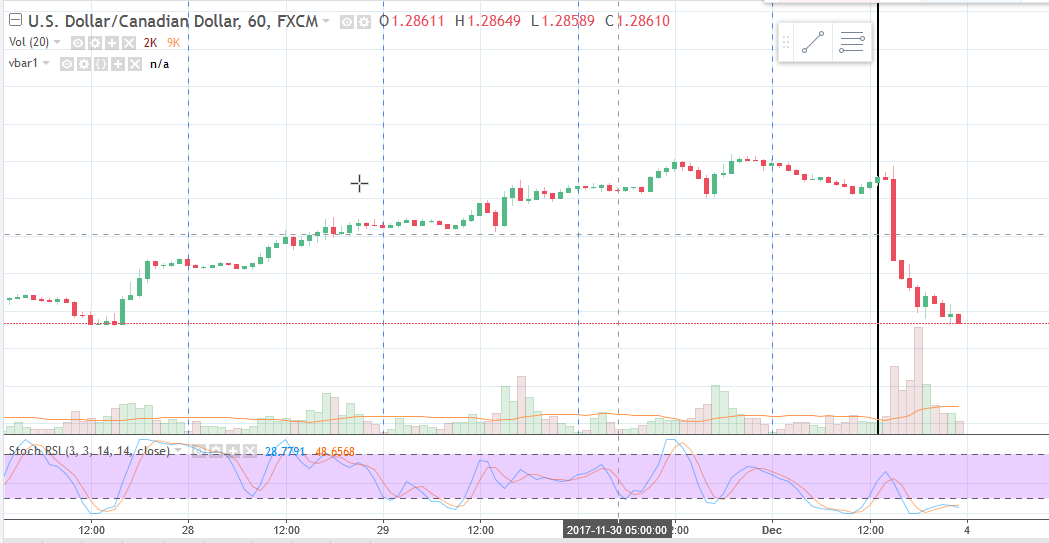
(2) --当将plot()与style=histogram参数一起使用时,效果要好得多:
//@version=3
study(title="vbar2", overlay = true) // scale=scale.none only for overlay=true
vlinecol = #000000 // black
cond = barstate.islast
bh = 10*high   // Use 10 x the window max price height for top of vbar (or use 1e20)
bo = -10       // Set offset from last bar
plot(cond ? bh : na, color=vlinecol, linewidth=2, offset=bo, style = histogram, transp=0)
其结果如下:
Stack Overflow用户
发布于 2022-10-23 16:22:54
如果它对某人有帮助:使用André的答案,静态调用drawVerticalLine函数多次使用时间戳。
(您可以在GMT / UTC /“America/New York”中使用时间戳(查看每个时区实现的文档))
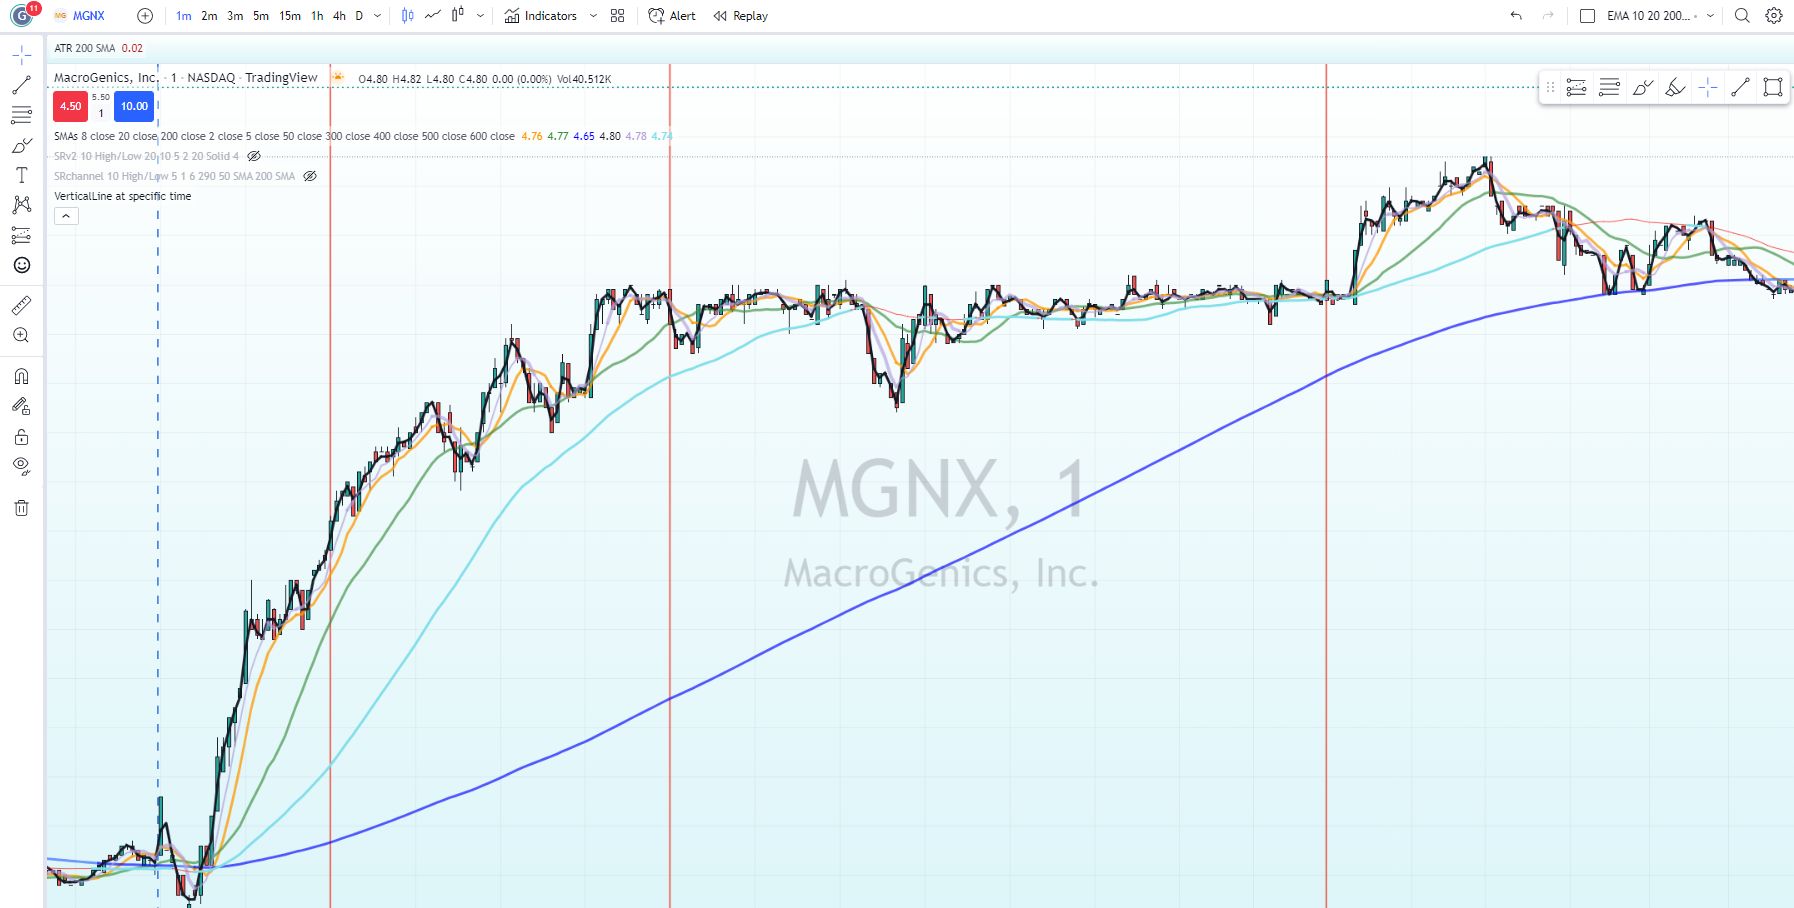
//@version=4
study("VerticalLine at specific time", overlay=true)

    // Function drawVerticalLine
drawVerticalLine(targetTime) =>
    line.new(x1=targetTime, y1=low, x2=targetTime, y2=high, xloc=xloc.bar_time, extend=extend.both, color=color.new(#ea5e50, 10), style=line.style_solid, width=2)

    // Call Function drawVerticalLine and passing TargetTime
targetTime = timestamp("GMT+3", year, month, dayofmonth, 17, 00, 00)
drawVerticalLine(targetTime)

targetTime1 = timestamp("GMT+3", year, month, dayofmonth, 18, 00, 00)
drawVerticalLine(targetTime1)

targetTime2 = timestamp("GMT+3", year, month, dayofmonth, 20, 00, 00)
drawVerticalLine(targetTime2)页面原文内容由Stack Overflow提供。腾讯云小微IT领域专用引擎提供翻译支持
原文链接:
https://stackoverflow.com/questions/47610638
复制相关文章
相似问题
腾讯云开发者

Copyright © 2013 - 2026 Tencent Cloud. All Rights Reserved. 腾讯云 版权所有
深圳市腾讯计算机系统有限公司 ICP备案/许可证号:粤B2-20090059 ![]() 粤公网安备44030502008569号
粤公网安备44030502008569号
腾讯云计算(北京)有限责任公司 京ICP证150476号 | 京ICP备11018762号