用雷达/极坐标图描述单个数据点
下面是我的上一篇文章:How to measure the area of a polygon in ggplot2?
我现在想要做的是把得到的雷达图表作为一个完全独立的散射点中的数据点,或者保存这个物体,然后用它在图表上描述实际数据的形状。
我有很多文件,它们通常都是这样的。它们的数量从1到许多,分数总是以降序的形式出现。ie #1总是在任何给定的文件中贡献最大。
myfile
01 0.31707317
02 0.12195122
03 0.09756098
04 0.07317073
05 0.07317073
06 0.07317073
07 0.07317073
08 0.07317073
09 0.04878049
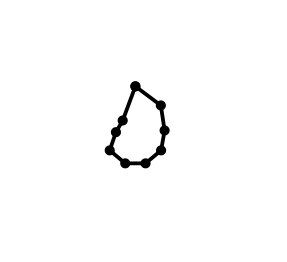
10 0.04878049在这里,我想为每个这些文件绘制一个雷达图表,并得到形状与周围没有网格。ggradar是我发现的最接近也是最美好的。
ggradar(as.matrix(t(radar)), group.point.size = 2, grid.line.width = 0, grid.max = 1.0, grid.mid = 0,
    grid.min = 0, axis.line.colour = "white", axis.label.size = 0, grid.label.size = 0,
    centre.y = 0, background.circle.colour = "white", group.colours = "black", group.line.width = 1)
当我想使用这些形状作为数据点时,问题就开始了。
@brian善意地评论并暗示了如何处理这个问题。
points: how to swap points with pie charts?
Small ggplot2 plots placed on coordinates on a ggmap
受这些注释的启发,我现在可以将绘图单元与文件名一起保存为一列,并使用相同的管道继续添加新文件。
  for (file in file_list){
#eliminate the empty files (they contain only the header)
if (file.size(file) > 420){
  # if the merged dataset does exist, append to it
  if (exists("dfradar")){
    radarfile <-read.table(file, header=TRUE, sep="\t")
    radarfile1 <- as.data.frame(as.numeric(radarfile[,3]))
    rownames(radarfile1) <- c(1:nrow(radarfile))
    dfradar1 <- ggradar(t(radarfile1), group.point.size = 1, grid.line.width = 0, grid.max = 1, grid.mid = 0,
                        grid.min = 0, axis.line.colour = "white", axis.label.size = 0, grid.label.size = 0,
                        centre.y = 0, background.circle.colour = "white", group.colours = "black", group.line.width = 0.5) +
                    theme(legend.position = "none")
    dfradar1 <- cbind(substring(file,11), dfradar1)
    dfradar <- rbind(dfradar, dfradar1)
  }
  # if the merged dataset doesn't exist, create it
  if (!exists("dfradar")){
    radarfile <- read.table(file, header=TRUE, sep="\t")
    radarfile1 <- as.data.frame(as.numeric(radarfile[,3]))
    rownames(radarfile1) <- c(1:nrow(radarfile))
    dfradar <- ggradar(t(radarfile1), group.point.size = 1, grid.line.width = 0, grid.max = 1, grid.mid = 0,
                        grid.min = 0, axis.line.colour = "white", axis.label.size = 0, grid.label.size = 0,
                        centre.y = 0, background.circle.colour = "white", group.colours = "black", group.line.width = 0.5) +
                theme(legend.position = "none")
    dfradar <- cbind(substring(file,11), dfradar)
    rm(radarfile)
    rm(radarfile1)
  }
} }
现在,当我想拯救格罗布一家时,我做不到;我得到了:
Mutate_impl中的错误(.data,dots):评估错误:尝试应用非函数.
或者:
“plot_clone中的错误(图):尝试应用非函数”
# merge the df with another df containing all other
# variables that I wanna use in my scatterplot
dfradar_merge <- merge(dfradar, Cases, all=FALSE)
dfradar_merge <-  dfradar_merge %>% mutate(radargrobs = list(annotation_custom(ggplotGrob(radarplots)),
xmin = as.numeric(Gender), xmax = as.numeric(Gender)*1.2,
ymin = as.numeric(Age) , ymax = as.numeric(Age)*1.2)))
我想如果我能把这个部分弄清楚,把变量作为xmin和ymin传递给我,我应该能够做我需要做的事情。
任何想法都是非常感谢的。我一直很头疼。
回答 1
Stack Overflow用户
发布于 2017-12-09 03:32:22
我想出了以下的想法。我用ggradar软件包创建了一个图形。然后,我研究了保存在ggplot_build()图形后面的数据帧。在图表后面似乎有13张列表。我需要调查哪一个列表是正确的一个包含多边形数据。我发现第六份清单是你想要提取并保存下来以备将来使用的一份。让我给你看看我做了什么。
library(dplyr)
library(ggradar)
library(scales)

# I modified the code from https://github.com/ricardo-bion/ggradar to get a graphic.

mtcars %>%
mutate_all(rescale) %>%
mutate(group = rownames(mtcars)) %>%
slice(5:9) %>%
select(1:4) -> mtcars_radar

g <- ggradar(mtcars_radar)
上面的代码生成以下图形。我的电脑或其他东西出了问题,我没有看到完整的图形。但这不是这个问题的问题。
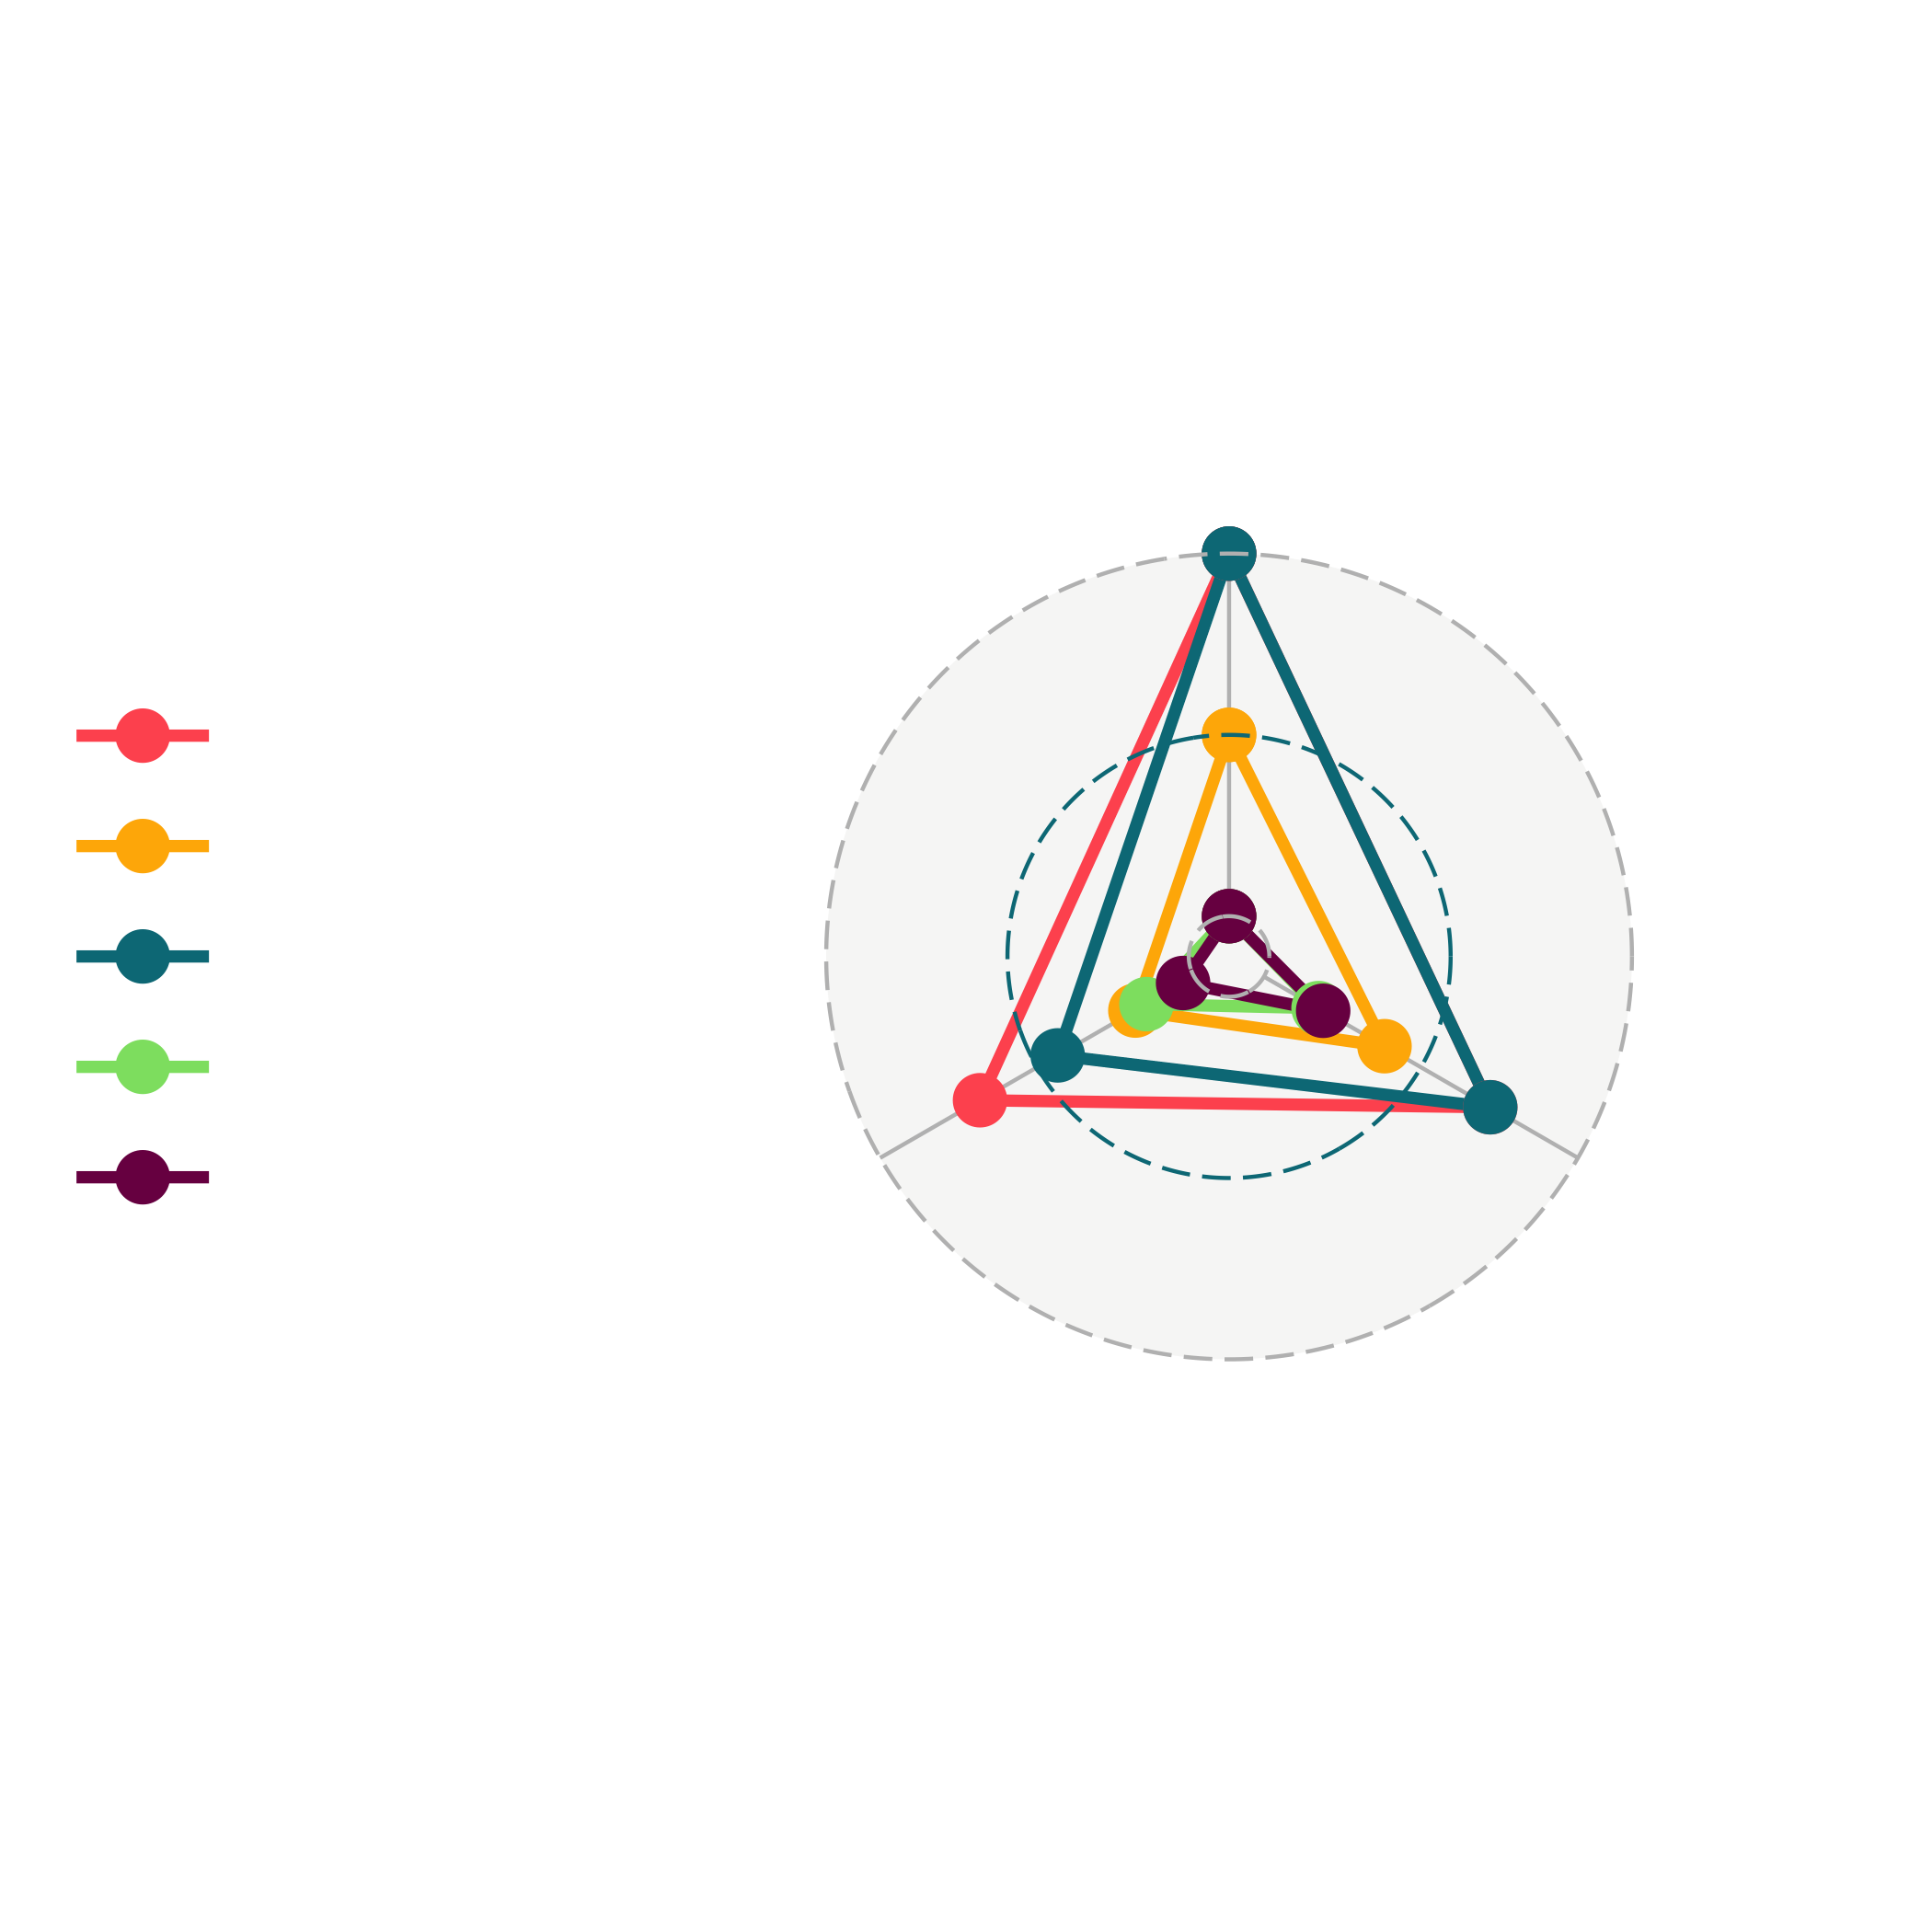
现在,我们希望将数据保存在图形后面,并寻找正确的数据。
foo <- ggplot_build(g)$data

# This is the 6th list in foo.

 $ :'data.frame':   20 obs. of  8 variables:
  ..$ colour  : chr [1:20] "#FF5A5F" "#FF5A5F" "#FF5A5F" "#FF5A5F" ...
  ..$ x       : num [1:20] 0 0.72 -0.687 0 0 ...
  ..$ y       : num [1:20] 1.111 -0.416 -0.397 1.111 0.611 ...
  ..$ group   : atomic [1:20] 1 1 1 1 2 2 2 2 3 3 ...
  .. ..- attr(*, "n")= int 5
  ..$ PANEL   : Factor w/ 1 level "1": 1 1 1 1 1 1 1 1 1 1 ...
  ..$ size    : num [1:20] 1.5 1.5 1.5 1.5 1.5 1.5 1.5 1.5 1.5 1.5 ...
  ..$ linetype: num [1:20] 1 1 1 1 1 1 1 1 1 1 ...
..$ alpha : logi [1:20] NA NA NA NA NA NA ...您希望将此列表提取为数据框架。我之所以能发现这个列表,是因为我注意到了颜色信息(例如,FF5A5F)。
mydf <- foo[[6]]

    colour          x          y group PANEL size linetype alpha
1  #FF5A5F  0.0000000  1.1111111     1     1  1.5        1    NA
2  #FF5A5F  0.7203077 -0.4158698     1     1  1.5        1    NA
3  #FF5A5F -0.6868360 -0.3965450     1     1  1.5        1    NA
4  #FF5A5F  0.0000000  1.1111111     1     1  1.5        1    NA
5  #FFB400  0.0000000  0.6111111     2     1  1.5        1    NA
6  #FFB400  0.4286803 -0.2474987     2     1  1.5        1    NA
7  #FFB400 -0.2584135 -0.1491951     2     1  1.5        1    NA
8  #FFB400  0.0000000  0.6111111     2     1  1.5        1    NA
9  #007A87  0.0000000  1.1111111     3     1  1.5        1    NA
10 #007A87  0.7203077 -0.4158698     3     1  1.5        1    NA
11 #007A87 -0.4726248 -0.2728700     3     1  1.5        1    NA
12 #007A87  0.0000000  1.1111111     3     1  1.5        1    NA
13 #8CE071  0.0000000  0.1111111     4     1  1.5        1    NA
14 #8CE071  0.2467912 -0.1424850     4     1  1.5        1    NA
15 #8CE071 -0.2278119 -0.1315273     4     1  1.5        1    NA
16 #8CE071  0.0000000  0.1111111     4     1  1.5        1    NA
17 #7B0051  0.0000000  0.1111111     5     1  1.5        1    NA
18 #7B0051  0.2595364 -0.1498434     5     1  1.5        1    NA
19 #7B0051 -0.1268266 -0.0732234     5     1  1.5        1    NA
20 #7B0051  0.0000000  0.1111111     5     1  1.5        1    NA
让我们确认一下,这些数据是否再现了ggradar图形中的五个三角形。
gg <- ggplot(data = mydf, aes(x = x, y = y, group = group, color = factor(group))) +
      geom_path(show.legend = FALSE) +
      theme_bw()
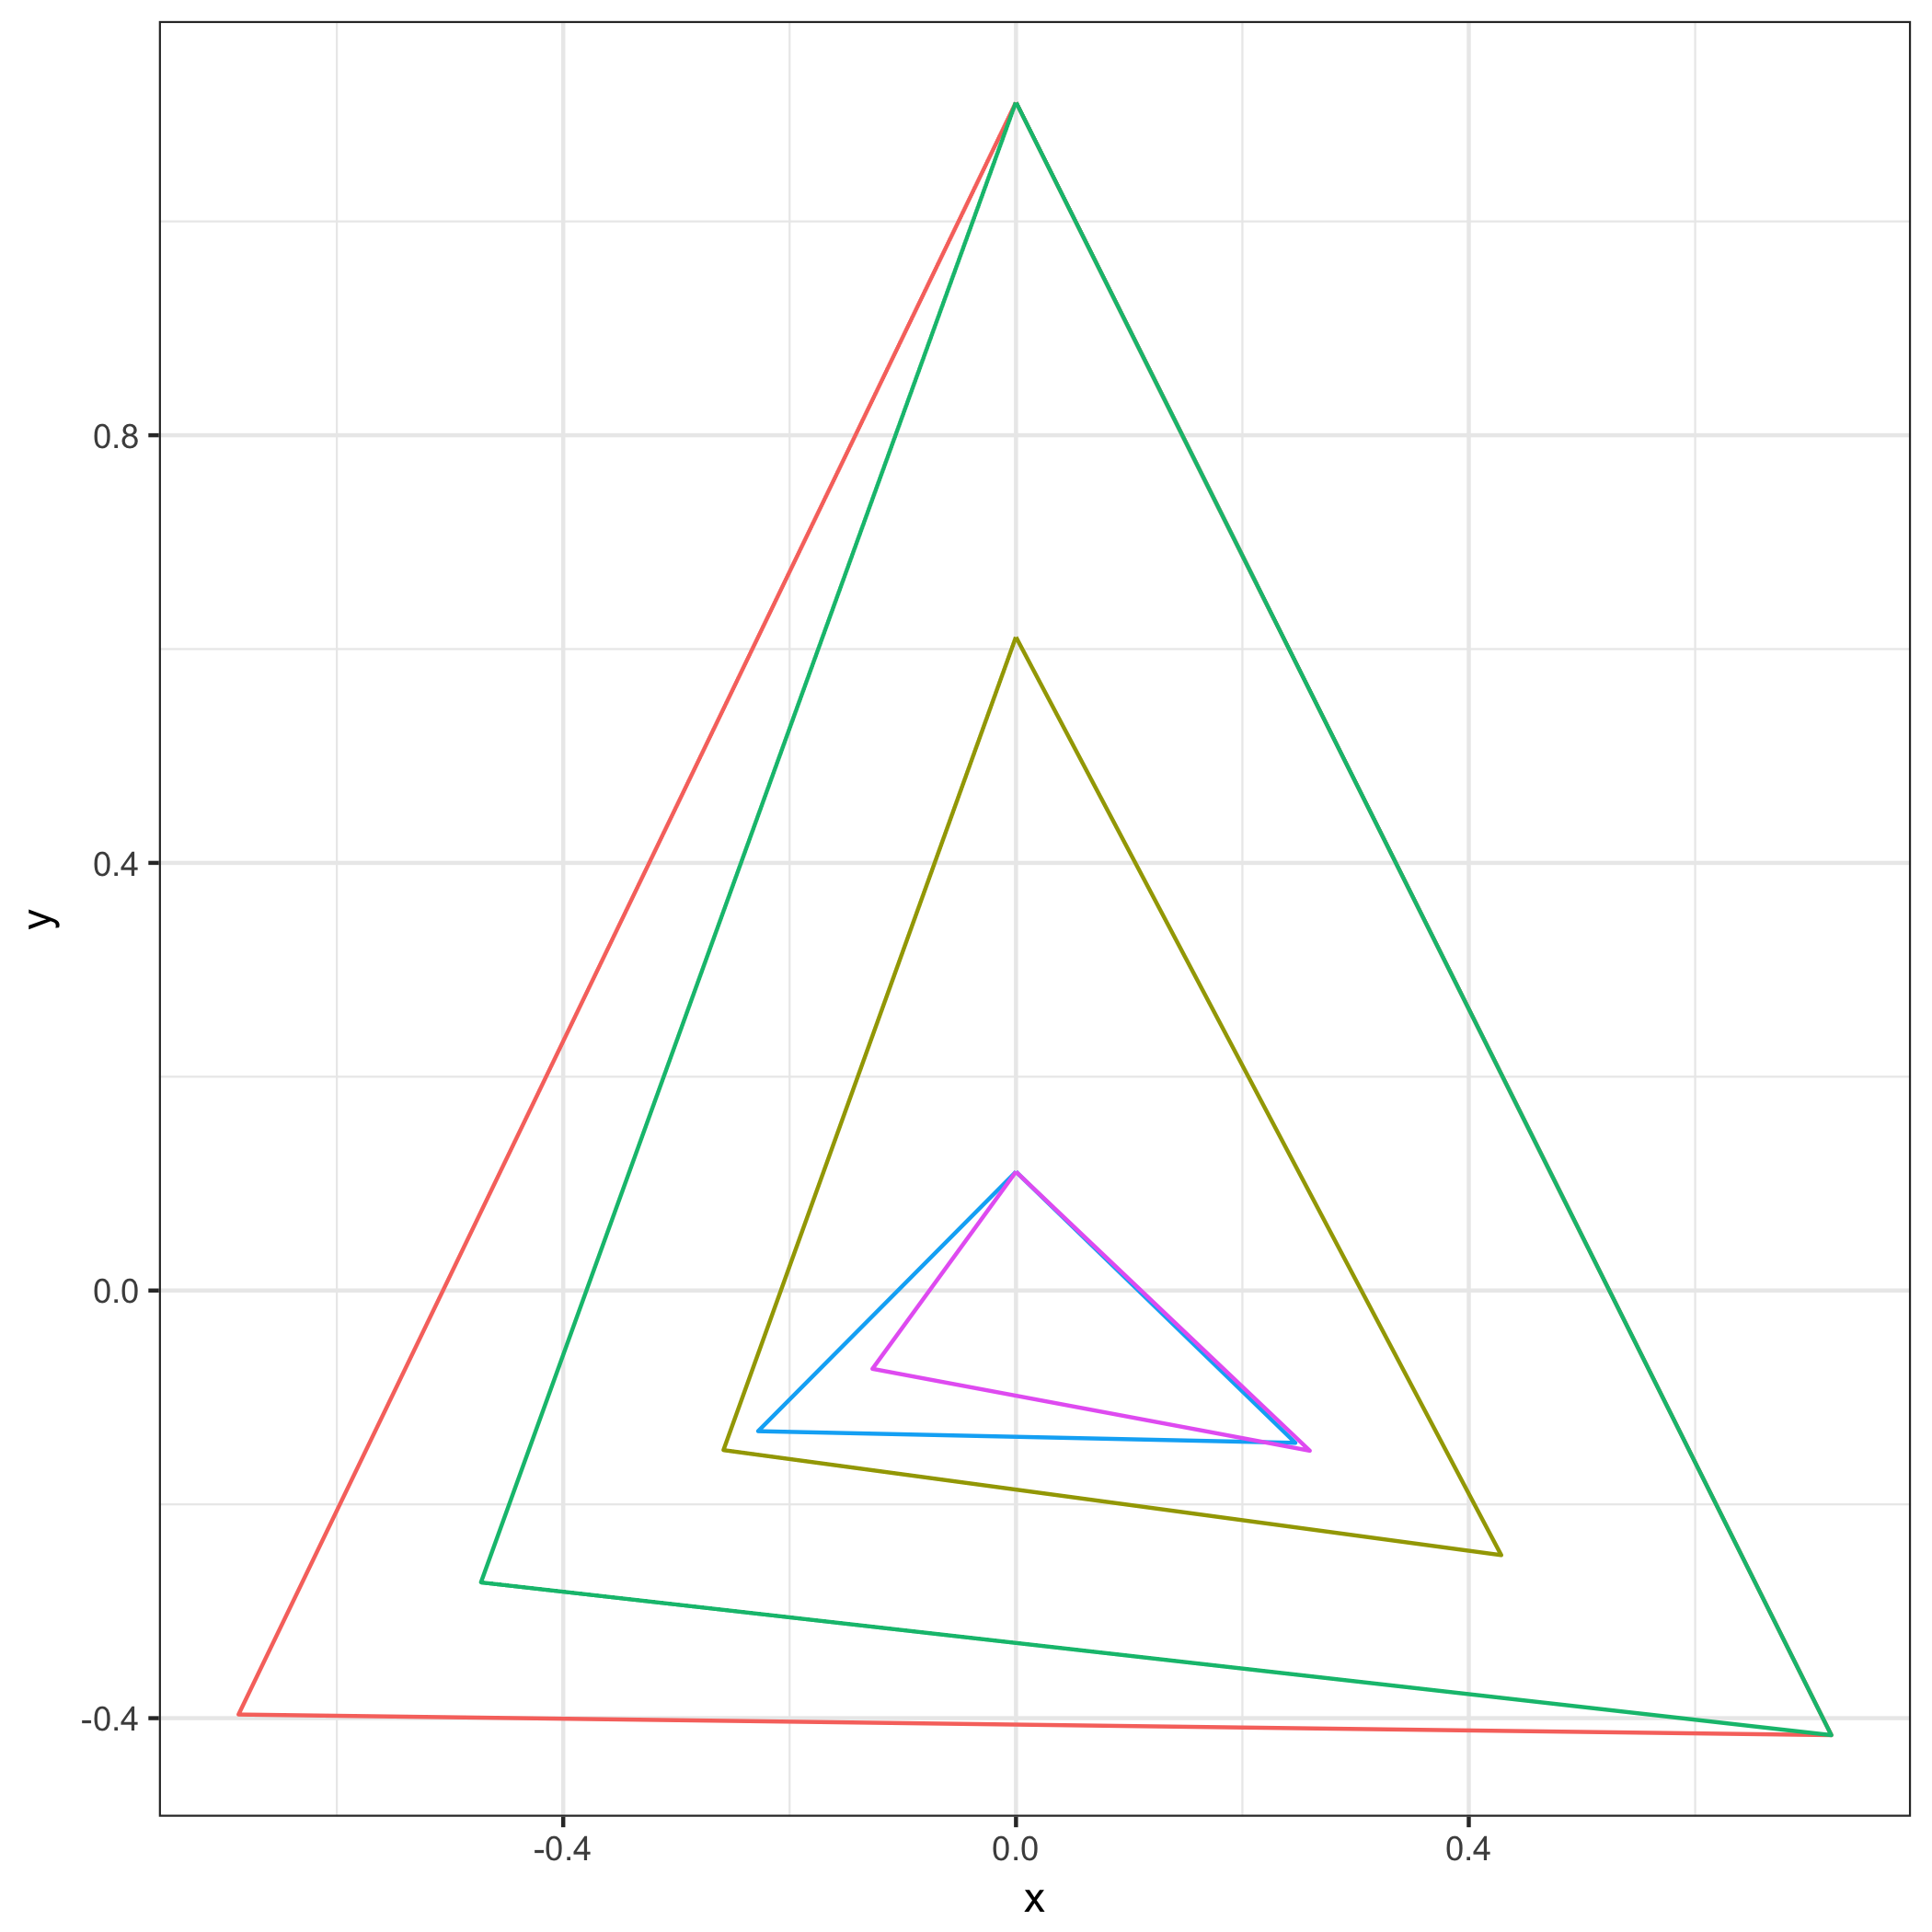
总之,您希望对ggplot进行黑客攻击,以提取所需的数据。此方法允许您为所需的“形状”保存数据。我希望这就是你想要的。
https://stackoverflow.com/questions/47704875
复制相似问题
腾讯云开发者
