
在图表上显示文本数据
在图表上显示文本数据
提问于 2018-01-30 09:39:18
我用图表画了一张图表。生成图表后,我将其保存为PNG图像。
以下是图表的外观:
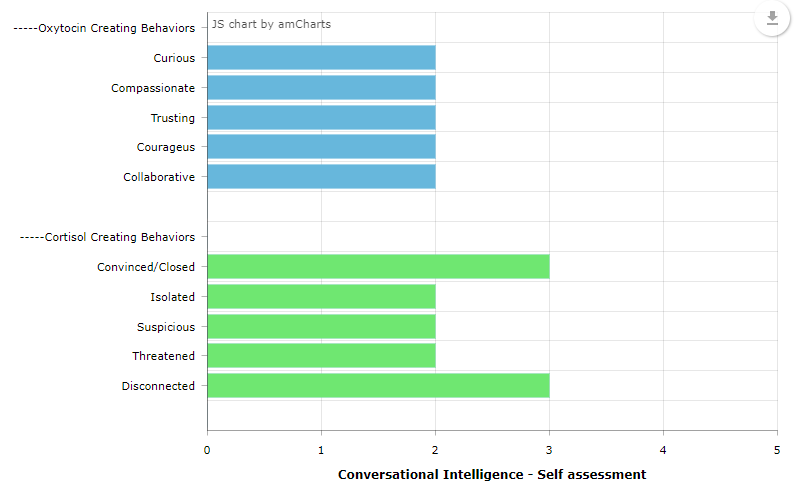
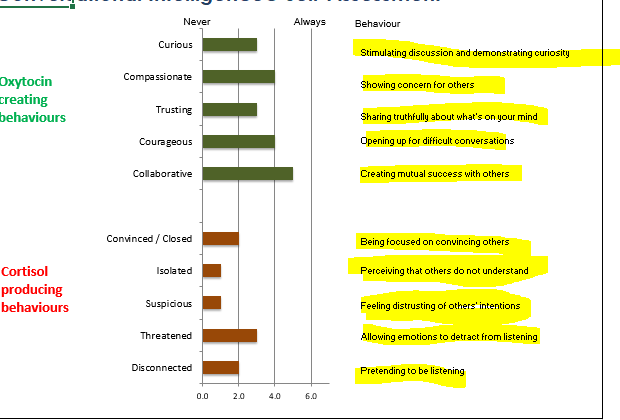
我想添加文本数据,我没有找到任何方法来添加像下面提到的生成图表这样的文本内容(在xls上手动):
这里是如何生成图表的:
var chart = AmCharts.makeChart("chartdiv", {
"theme": "light",
"type": "serial",
"dataProvider": [
{
    "year": "-----Oxytocin creating behaviours----------",
    "income":0
},
{
    "year": "Curious",
    "income": <?=$q1?>
}, {
    "year":  "Compassionate",
    "income": <?=$q2?>
}, {
    "year": "Trusting",
    "income": <?=$q3?>
}, {
    "year": "Courageus",
    "income": <?=$q4?>
},
{
    "year": "Collaborative",
    "income": <?=$q5?>
},
{
    "year": "",
    "income": 0
},
{
    "year": "-----Oxytocin creating behaviours--------",
    "income":0
},

        {
    "year": "Convinced/Closed",
    "income":<?=$q6?>,
   "color": "#6FE771"
},
 {
    "year": "Isolated",
    "income": <?=$q7?>,
 "color": "#6FE771"
},
 {
    "year": "Suspicious",
    "income":<?=$q8?>,
    "color": "#6FE771"
},
 {
    "year": "Threatened",
    "income": <?=$q9?>,
    "color": "#6FE771"
},
{
    "year": "Disconnected",
    "income": <?=$q10?>,
    "color": "#6FE771"
},
{
    "year": "",
    "income": 0
},

    ],

    "valueAxes": [{
    "title": "Conversational Intelligence - Self assessment",
                              "minimum": 0,
"maximum": 5

}],
"graphs": [{
    "balloonText": "Income in [[category]]:[[value]]",
    "fillAlphas": 1,
    "lineAlpha": 0.2,
    "title": "Income",
    "type": "column",
    "valueField": "income",
    "colorField": "color"
}],
"depth3D": 0,
"angle": 30,
"rotate": true,
"categoryField": "year",
"categoryAxis": {
    "gridPosition": "start",
    "fillAlpha": 0.05,
    "position": "left"
},
"export": {
    "enabled": true
 }
});回答 1
Stack Overflow用户
回答已采纳
发布于 2018-01-31 03:57:18
您可以在guides上使用categoryAxis添加在模拟图像中标记为黄色的文本。
确保还增加了marginRight,为这些文本标签留出空间。
var chart = AmCharts.makeChart("chartdiv", {
  "type": "serial",
  // ...
  "marginRight": 200,
  "categoryAxis": {
    // ...
    "guides": [{
      "category": "Curious",
      "label": "Stimulating discussion...",
      "position":"right"
    }, {
      "category": "Compassionate",
      "label": "Showing concern",
       "position":"right"
    }, {
      // etc...
    }]
  }
});下面是一个Codepen演示,可以看到它(部分地)在运行中:https://codepen.io/team/amcharts/pen/5668edd799ed57caa2227fe25efd893c?editors=1010
页面原文内容由Stack Overflow提供。腾讯云小微IT领域专用引擎提供翻译支持
原文链接:
https://stackoverflow.com/questions/48518205
复制相关文章
相似问题
腾讯云开发者
