
用matplotlib绘制两个y轴的线图?
用matplotlib绘制两个y轴的线图?
提问于 2018-02-27 02:43:36
我有(x,y)值的列表,如下所示。
K= (3,6),(4,7),(5,8),(6,9),(7,10),(7,2),(8,3),(9,4),(10,5),(11,6)
我想要创建一个绘图,在相反的轴线上画线,像下面这样,假设轴值在1-15范围内。
请在这里找到那个数字
。
我试着用孪生和孪生,但不完全确定如何实现这一点。我认为使用Microsoft可能更容易,但我的所有值都在python文件中。
回答 2
Stack Overflow用户
回答已采纳
发布于 2018-02-27 03:18:20
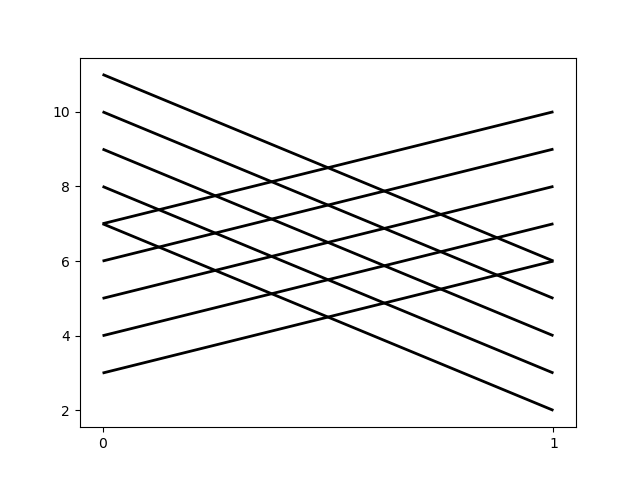
它可以很简单:
import matplotlib.pyplot as plt
[plt.plot(d) for d in k]
plt.ylabel('some numbers')
plt.show()
给我:

在标签上:
import matplotlib.pyplot as plt
[plt.plot(d) for d in k]
plt.ylabel('some numbers')
ax = plt.gca()
ax.xaxis.set_ticks([0,1])
ax.xaxis.set_ticklabels(["BaseLine", "FollowUp"])
plt.show()

Stack Overflow用户
发布于 2018-02-27 03:09:58
可以使用LineCollection绘制线段集合。使用plt.plot绘制每条线也是可能的,但是当有很多线段时,使用LineCollection更有效:
import matplotlib.pyplot as plt
import numpy as np
import matplotlib.collections as mcoll

k = np.array([(3, 6), (4, 7), (5, 8), (6, 9), (7, 10),
              (7, 2), (8, 3), (9, 4), (10, 5), (11, 6)])
x = np.array([0,1])

fig, ax = plt.subplots()
points = np.stack([np.tile(x, (len(k),1)), k], axis=2)
line_segments = mcoll.LineCollection(points, linestyles='solid', colors='black',
                                     linewidth=2)
ax.add_collection(line_segments)
ax.set_xticks([0, 1])
# Manually adding artists doesn't rescale the plot, so we need to autoscale (https://stackoverflow.com/q/19877666/190597)
ax.autoscale()
plt.show()
页面原文内容由Stack Overflow提供。腾讯云小微IT领域专用引擎提供翻译支持
原文链接:
https://stackoverflow.com/questions/49000293
复制相关文章
相似问题
腾讯云开发者
