
卡尔曼滤波(pykalman):obs_covariance和模型的值
我正在查看pykalman的KalmanFilter,如例所示:
示例1
示例2
我想知道
observation_covariance=100,

vs

observation_covariance=1,
文件说明
observation_covariance R: e(t)^2 ~ Gaussian (0, R)如何正确地设置这里的值?
另外,在上面的模块中,不需要拦截就可以应用卡尔曼滤波了吗?
回答 1
Stack Overflow用户
发布于 2018-04-01 14:00:52
观察协方差显示了在输入数据中假设存在多少误差。卡尔曼滤波能很好地处理正态分布的数据。在这个假设下,您可以使用3-Sigma规则根据观测中的最大误差计算观测的协方差(在本例中是方差)。
您问题中的值可以解释如下:
示例1
observation_covariance = 100
sigma = sqrt(observation_covariance) = 10
max_error = 3*sigma = 30
示例2
observation_covariance = 1
sigma = sqrt(observation_covariance) = 1
max_error = 3*sigma = 3所以你需要根据你的观测数据来选择这个值。观测精度越高,观测协方差越小。
另一点:您可以通过操作协方差来调优筛选器,但我认为这不是一个好主意。观测协方差值越高,新观测值对滤波状态的影响越小。
对不起,我不明白你问题的第二部分(关于没有拦截的卡尔曼滤波器)。你能解释一下你的意思吗?您正在尝试使用一个回归模型,并且截距和斜率都属于它。
---------------------------
更新
我准备了一些代码和情节来详细回答你的问题。我使用EWC和EWA历史数据来接近原始文章。
首先,这里是代码(与上面的示例完全相同,但有不同的表示法)。
from pykalman import KalmanFilter
import numpy as np
import matplotlib.pyplot as plt

# reading data (quick and dirty)
Datum=[]
EWA=[]
EWC=[]

for line in open('data/dataset.csv'):
    f1, f2, f3  = line.split(';')
    Datum.append(f1)
    EWA.append(float(f2))
    EWC.append(float(f3))

n = len(Datum)

# Filter Configuration

# both slope and intercept have to be estimated

# transition_matrix
F = np.eye(2) # identity matrix because x_(k+1) = x_(k) + noise

# observation_matrix
# H_k = [EWA_k   1]
H = np.vstack([np.matrix(EWA), np.ones((1, n))]).T[:, np.newaxis]

# transition_covariance
Q = [[1e-4,     0],
     [   0,  1e-4]]

# observation_covariance
R = 1 # max error = 3

# initial_state_mean
X0 = [0,
      0]

# initial_state_covariance
P0 = [[  1,    0],
      [  0,    1]]

# Kalman-Filter initialization
kf = KalmanFilter(n_dim_obs=1, n_dim_state=2,
                  transition_matrices = F,
                  observation_matrices = H,
                  transition_covariance = Q,
                  observation_covariance = R,
                  initial_state_mean = X0,
                  initial_state_covariance = P0)

# Filtering
state_means, state_covs = kf.filter(EWC)

# Restore EWC based on EWA and estimated parameters
EWC_restored = np.multiply(EWA, state_means[:, 0]) + state_means[:, 1]

# Plots
plt.figure(1)
ax1 = plt.subplot(211)
plt.plot(state_means[:, 0], label="Slope")
plt.grid()
plt.legend(loc="upper left")

ax2 = plt.subplot(212)
plt.plot(state_means[:, 1], label="Intercept")
plt.grid()
plt.legend(loc="upper left")

# check the result
plt.figure(2)
plt.plot(EWC, label="EWC original")
plt.plot(EWC_restored, label="EWC restored")
plt.grid()
plt.legend(loc="upper left")

plt.show()我无法使用熊猫检索数据,所以我下载了它们,并从文件上读取数据。
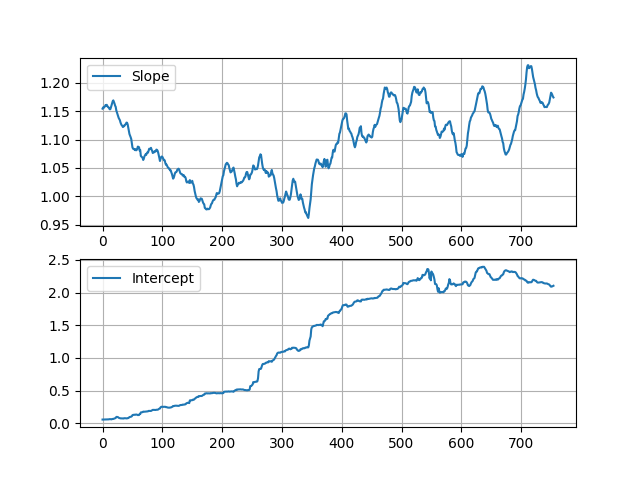
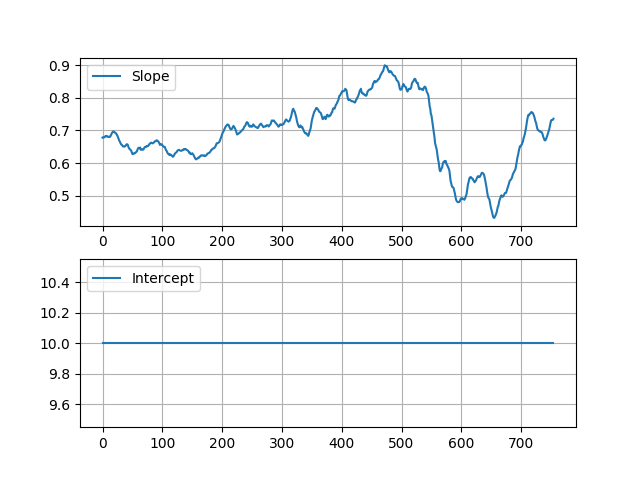
在这里,您可以看到估计的斜率和截距:
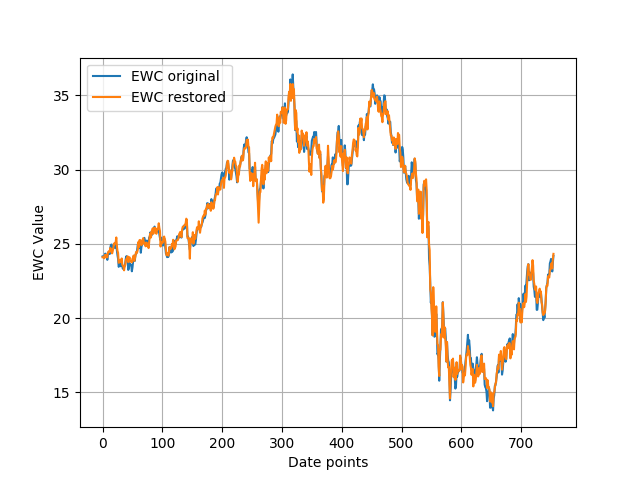
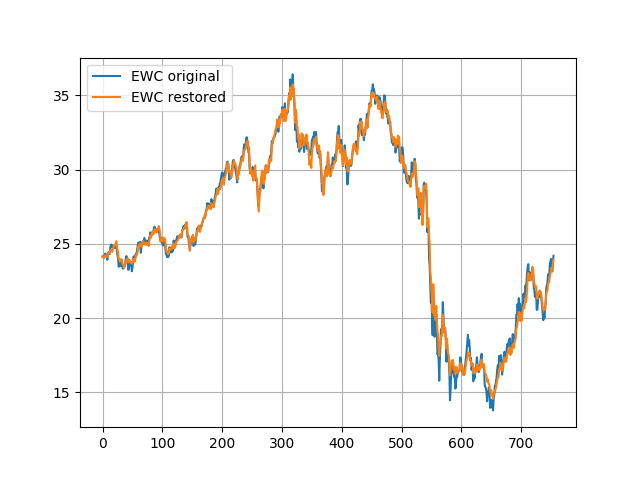
为了测试估计的数据,我使用估计参数从EWA恢复了EWC值:
关于观测协方差值的
通过改变观测协方差值,您可以告诉过滤器输入数据的准确性(通常您只是使用一些数据表或您对系统的知识来描述您对观测的信心)。
以下是使用不同观测协方差值估计的参数和恢复的EWC值:
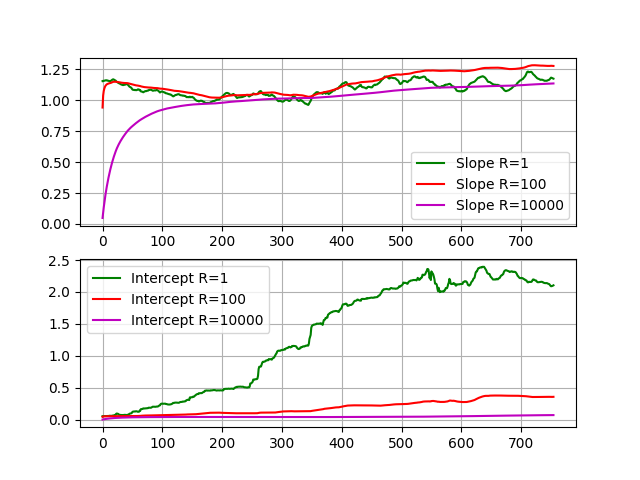
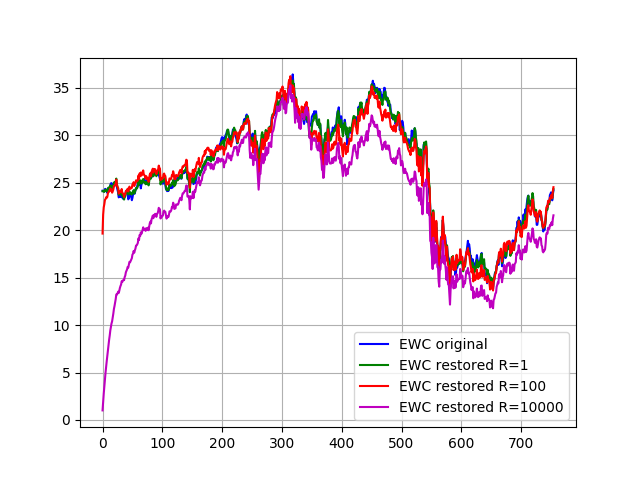
你可以看到滤波器更好地遵循原始函数,对观察有更大的信心(R越小)。当置信度较低(R较大)时,滤波器留下的初始估计值(斜率= 0,截距= 0)很慢,恢复的函数离原函数很远。
关于冻结拦截
如果出于某种原因要冻结拦截,则需要更改整个模型和所有筛选器参数。
在正常情况下我们有:
x = [slope; intercept]    #estimation state
H = [EWA    1]            #observation matrix
z = [EWC]                 #observation
现在我们有:
x = [slope]               #estimation state
H = [EWA]                 #observation matrix
z = [EWC-const_intercept] #observation
结果:
以下是代码:
from pykalman import KalmanFilter
import numpy as np
import matplotlib.pyplot as plt

# only slope has to be estimated (it will be manipulated by the constant intercept) - mathematically incorrect!
const_intercept = 10

# reading data (quick and dirty)
Datum=[]
EWA=[]
EWC=[]

for line in open('data/dataset.csv'):
    f1, f2, f3  = line.split(';')
    Datum.append(f1)
    EWA.append(float(f2))
    EWC.append(float(f3))

n = len(Datum)

# Filter Configuration

# transition_matrix
F = 1 # identity matrix because x_(k+1) = x_(k) + noise

# observation_matrix
# H_k = [EWA_k]
H = np.matrix(EWA).T[:, np.newaxis]

# transition_covariance
Q = 1e-4

# observation_covariance
R = 1 # max error = 3

# initial_state_mean
X0 = 0

# initial_state_covariance
P0 = 1

# Kalman-Filter initialization
kf = KalmanFilter(n_dim_obs=1, n_dim_state=1,
                  transition_matrices = F,
                  observation_matrices = H,
                  transition_covariance = Q,
                  observation_covariance = R,
                  initial_state_mean = X0,
                  initial_state_covariance = P0)

# Creating the observation based on EWC and the constant intercept
z = EWC[:] # copy the list (not just assign the reference!)
z[:] = [x - const_intercept for x in z]

# Filtering
state_means, state_covs = kf.filter(z) # the estimation for the EWC data minus constant intercept

# Restore EWC based on EWA and estimated parameters
EWC_restored = np.multiply(EWA, state_means[:, 0]) + const_intercept

# Plots
plt.figure(1)
ax1 = plt.subplot(211)
plt.plot(state_means[:, 0], label="Slope")
plt.grid()
plt.legend(loc="upper left")

ax2 = plt.subplot(212)
plt.plot(const_intercept*np.ones((n, 1)), label="Intercept")
plt.grid()
plt.legend(loc="upper left")

# check the result
plt.figure(2)
plt.plot(EWC, label="EWC original")
plt.plot(EWC_restored, label="EWC restored")
plt.grid()
plt.legend(loc="upper left")

plt.show()https://stackoverflow.com/questions/49595347
复制相似问题
腾讯云开发者
