
使用PHP进行ajax调用后执行chartjs
使用PHP进行ajax调用后执行chartjs
提问于 2018-04-10 12:22:31
我想在ajax调用之后加载ChartJs图表。但不幸的是,它显示了所有ChartJS php变量的未定义变量错误。
目标:
根据下拉列表中的用户选择更改图表,每个选择选项基本上都是一个JSON链接,从那里获取用chartjs显示的数据。
到目前为止我所做的:
- 为每个用户设置一个AJAX调用,对每个用户都可以选择页面加载上的“默认”和“在更改”选项。
- 在成功的ajax请求部分之后添加了Chartjs代码。
- 测试了所有的JSON代码和php数据,它都正常工作。
- chartjs php变量的所有ajax返回数据都是正常的。
问题:
- 所有图表PHP变量的未定义变量错误(名称、cot_labels、cot_values、cot_values2、cot_values3、cot_values4、cot_values5)
- 图表上没有显示数据。
- 当用户选择另一个选项时,图表也不会刷新新的数据。
以下是Javascript部分:
 $(document).ready(function(){
                  $.ajax({
          url: "./url.php",
          type: "POST",
          data: {
            cur: $("#cur").val()
          },
           success: function(data) {
                    alert(data);
                        new Chart(document.getElementById("line-chart"), {
  type: 'line',
  data: {
    labels: [<?php echo '"'.$cot_labels.'"'; ?>],
    datasets: [{
        data: [<?php echo $cot_values; ?>],
        label: "A",
        borderColor: "#3e95cd",
        fill: false
      }, {
        data: [<?php echo $cot_values2; ?>],
        label: "B",
        borderColor: "#8e5ea2",
        fill: false
      } ,
      {
        data: [<?php echo $cot_values3; ?>],
        label: "C",
        borderColor: "#085b83",
        fill: false
      }  ,
      {
        data: [<?php echo $cot_values4; ?>],
        label: "D",
        borderColor: "#1c2925",
        fill: false
      } ,
        {
        data: [<?php echo $cot_values5; ?>],
        label: "E",
        borderColor: "#b9801d",
        fill: false
      }
    ]
  },
  options: {
    title: {
      display: true,
      text: '<?php echo $name; ?>'
    },
     animation: {
            duration: 0, // general animation time
        },
         hover: {
            animationDuration: 0, // duration of animations when hovering an item
        },
        responsiveAnimationDuration: 0, // animation duration after a resize
  }
});
                }
             });
    $('#cur').on('change', function() {
          $.ajax({
          url: "./url.php",
          type: "POST",
          data: {
            cur: $("#cur").val()
          },
           success: function(data) {
                    alert(data);
                        new Chart(document.getElementById("line-chart"), {
  type: 'line',
  data: {
    labels: [<?php echo '"'.$cot_labels.'"'; ?>],
    datasets: [{
        data: [<?php echo $cot_values; ?>],
        label: "A",
        borderColor: "#3e95cd",
        fill: false
      }, {
        data: [<?php echo $cot_values2; ?>],
        label: "B",
        borderColor: "#8e5ea2",
        fill: false
      } ,
      {
        data: [<?php echo $cot_values3; ?>],
        label: "C",
        borderColor: "#085b83",
        fill: false
      }  ,
      {
        data: [<?php echo $cot_values4; ?>],
        label: "D",
        borderColor: "#1c2925",
        fill: false
      } ,
        {
        data: [<?php echo $cot_values5; ?>],
        label: "E",
        borderColor: "#b9801d",
        fill: false
      }
    ]
  },
  options: {
    title: {
      display: true,
      text: '<?php echo $name; ?>'
    },
     animation: {
            duration: 0, // general animation time
        },
         hover: {
            animationDuration: 0, // duration of animations when hovering an item
        },
        responsiveAnimationDuration: 0, // animation duration after a resize
  }
});
                }

             });
       });
}); <select id="cur" name="cur">
<option value="<?php echo $euro;?>">EURO</option>
<option value="<?php echo $pound;?>">UK</option>
</select>
<canvas id="line-chart" width="800" height="450"></canvas>
以下是PHP部分:
 $euro = "URL";
    $pound = "URL";

//AJAX CALL
 if (isset($_POST['cur'])) {
   $cur = filter_input(INPUT_POST, 'cur', FILTER_SANITIZE_STRING);
          //Build arrays
 $cot_label_arr = array();
 $cot_value_arr = array();
 $cot_value_arr2 = array();
 $cot_value_arr3 = array();
 $cot_value_arr4 = array();
 $cot_value_arr5 = array();
   $json=file_get_contents($cur);
 $data =  json_decode($json);
  foreach ($data as $item  ) {
  $name = $item->name;
 // echo $item->newest_available_date;
  foreach($item as $value => $value_1){
    if (is_array($value_1) || is_object($value_1))
   {
    foreach($value_1  as $value_2 ){
         if (is_array($value_2) || is_object($value_2))
    {
             $cot_label_arr[] = date('M j Y',strtotime($value_2[0])); //pull dates
             $cot_value_arr[] = $value_2[1];
             $cot_value_arr2[] = $value_2[2];
             $cot_value_arr3[] = $value_2[3];
             $cot_value_arr4[] = $value_2[4];
             $cot_value_arr5[] = $value_2[5];

        }
       }

     }
   }
  }
$cot_labels = array_reverse($cot_label_arr); //reverse the data for ASC
$cot_values = array_reverse($cot_value_arr); //reverse the data for ASC
$cot_values2 = array_reverse($cot_value_arr2); //reverse the data for ASC
$cot_values3 = array_reverse($cot_value_arr3); //reverse the data for ASC
$cot_values4 = array_reverse($cot_value_arr4); //reverse the data for ASC
$cot_values5 = array_reverse($cot_value_arr5); //reverse the data for ASC
//----
$cot_labels = implode('","', $cot_labels); //comma sep
$cot_values = implode(", ", $cot_values); //comma sep
$cot_values2 = implode(", ", $cot_values2); //comma sep
$cot_values3 = implode(", ", $cot_values3); //comma sep
$cot_values4 = implode(", ", $cot_values4); //comma sep
$cot_values5 = implode(", ", $cot_values5); //comma sep
 exit;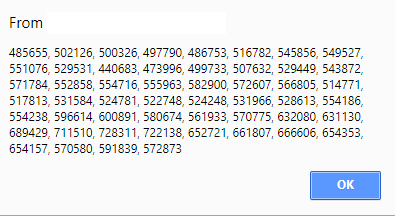
} // End of ajax call如果我在ajax调用中使用echo $cot_values;,那么我就可以看到正确的数据。但是chartjs并没有装载它。这是我为$cot_values返回的内容的截图。
不确定为什么chartjs php变量会出现未定义的数据错误,而在成功的ajax调用之后调用chartjs javascript。另外,为什么正确的数据没有加载到图表上。
更新:使用MLStud编码
现在,当我们使用java数据时,不再有未定义的php chartjs变量错误。但是图表没有加载,取而代之的是一个空白显示的图表。我已经测试了所有数据的任何错误的格式,但它是好的。
以下是更新的编码部分:
PHP:
if (isset($_POST['cur'])) {
........
$cot_labels = implode(", ", $cot_labels); //edited as it was showing date with extra ""
$cot_values = implode(", ", $cot_values); //comma sep
$cot_values2 = implode(", ", $cot_values2); //comma sep
$cot_values3 = implode(", ", $cot_values3); //comma sep
$cot_values4 = implode(", ", $cot_values4); //comma sep
$cot_values5 = implode(", ", $cot_values5); //comma sep

 // New added
 $result = array(
'cot_labels'=>$cot_labels,
'cot_values'=>$cot_values,
'cot_values2'=>$cot_values2,
'cot_values3'=>$cot_values3,
'cot_values4'=>$cot_values4,
'cot_values5'=>$cot_values5,
'name'=>$name

   );
  print_r(json_encode($result));
   exit;
   } // End of ajax call
Javascript +
   $(document).ready(function(){
        var ctx = document.getElementById("myChart").getContext('2d');
                  $.ajax({
          url: "./url.php",
          type: "POST",
          data: {
            cur: $("#cur").val()
          },
           success: function(data) {
             alert(data);
             var datos = JSON.parse(data);
                 var myChart = new Chart(ctx, {
                    type: 'line',
                    data: {
                        labels: datos.cot_labels, ///in this way you access the data of the returned json
                        datasets: [{
                            data: datos.cot_values,///in this way you access the data of the returned json
                            label: "A",
                            borderColor: "#3e95cd",
                            fill: false
                        }, {
                            data: datos.cot_values2,
                            label: "B",
                            borderColor: "#8e5ea2",
                            fill: false
                        }]
                    },
                    options: {
                        title: {
                            display: true,
                            text: data.name
                        },
                        animation: {
                            duration: 0, // general animation time
                        },
                        hover: {
                            animationDuration: 0, // duration of animations when hovering an item
                        },
                        responsiveAnimationDuration: 0, // animation duration after a resize
                    }
                });
                }
             });
    $('#cur').on('change', function() {
          $.ajax({
          url: "./url.php",
          type: "POST",
          data: {
            cur: $("#cur").val()
          },
           success: function(data) {
               var datos = JSON.parse(data);
                var myChart = new Chart(ctx, {
                    type: 'line',
                    data: {
                        labels: datos.cot_labels, ///in this way you access the data of the returned json
                        datasets: [{
                            data: datos.cot_values,///in this way you access the data of the returned json
                            label: "A",
                            borderColor: "#3e95cd",
                            fill: false
                        }, {
                            data: datos.cot_values2,
                            label: "B",
                            borderColor: "#8e5ea2",
                            fill: false
                        }]
                    },
                    options: {
                        title: {
                            display: true,
                            text: data.name
                        },
                        animation: {
                            duration: 0, // general animation time
                        },
                        hover: {
                            animationDuration: 0, // duration of animations when hovering an item
                        },
                        responsiveAnimationDuration: 0, // animation duration after a resize
                    }
                });
                }

             });
       });
}); <select id="cur" name="cur">
<option value="<?php echo $euro;?>">EURO</option>
<option value="<?php echo $pound;?>">UK</option>
</select>
<canvas id="myChart" width="800" height="450"></canvas>
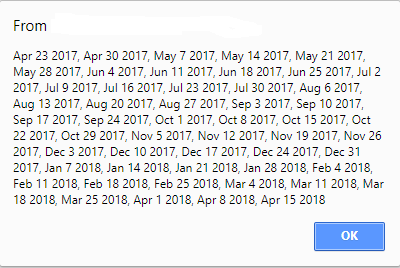
为了进一步验证,这里的日期格式是它的样子:(当我们在ajax调用成功后调用它时)
alert(datos.cot_labels);
回答 1
Stack Overflow用户
回答已采纳
发布于 2018-04-10 13:00:59
要获得变量的值,必须访问作为答案(数据)获得的json,并且必须转换"val1,val2,.“在向量val1,val2,.用拆分
var ctx = document.getElementById("myChart").getContext('2d');
$.ajax({
url: "server.php",
type: "POST",
data: {
...
},
success: function(data) {
var datos = JSON.parse(data);
var myChart = new Chart(ctx, {
type: 'line',
data: {
labels: datos.cot_labels.split(','), ///in this way you access the data of the returned json
datasets: [{
data: datos.cot_values.split(','),///in this way you access the data of the returned json
label: "A",
borderColor: "#3e95cd",
fill: false
}, {
data: datos.cot_values2.split(','),
label: "B",
borderColor: "#8e5ea2",
fill: false
}]
},
options: {
title: {
display: true,
text: datos.name
},
animation: {
duration: 0, // general animation time
},
hover: {
animationDuration: 0, // duration of animations when hovering an item
},
responsiveAnimationDuration: 0, // animation duration after a resize
}
});
}
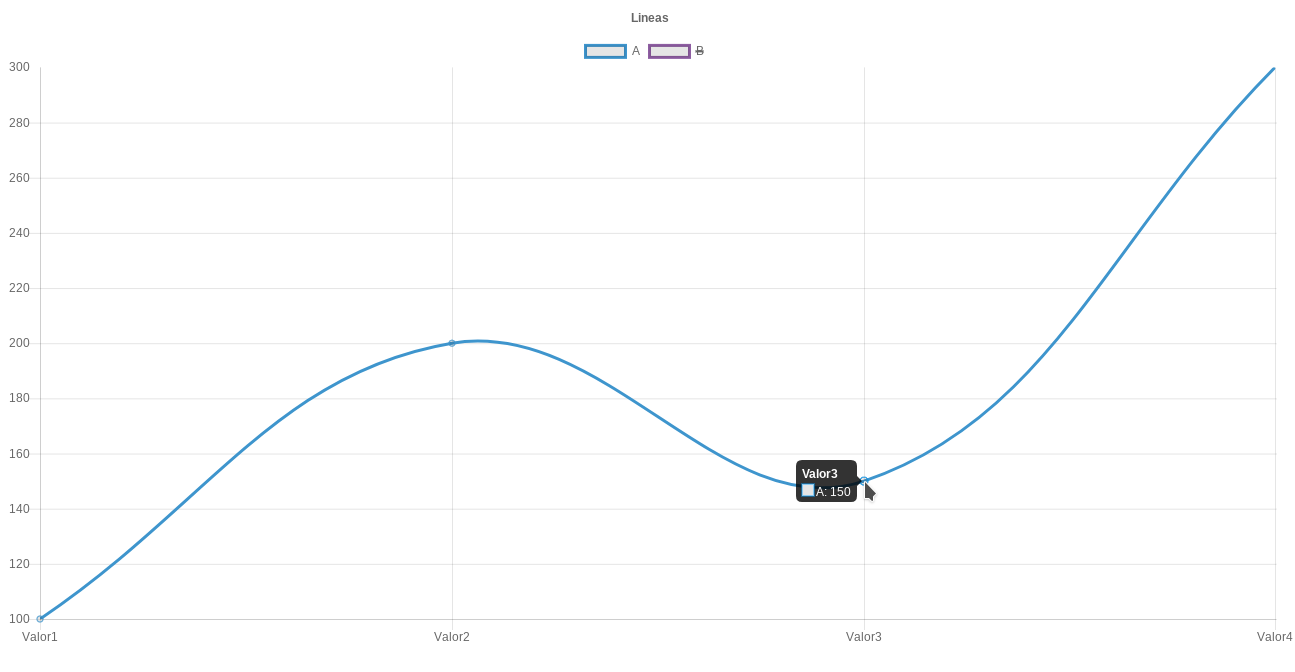
});结果:
页面原文内容由Stack Overflow提供。腾讯云小微IT领域专用引擎提供翻译支持
原文链接:
https://stackoverflow.com/questions/49753553
复制相关文章
相似问题
腾讯云开发者
