
如何在图像中找到类似表格的结构
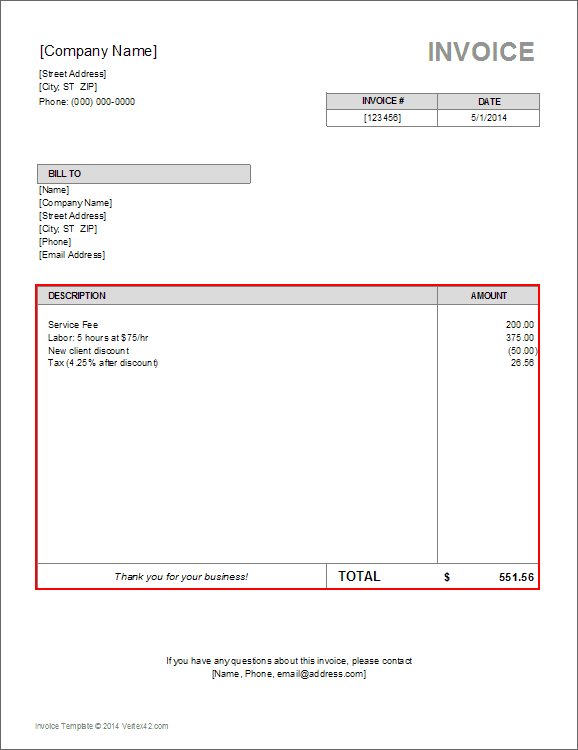
我有不同类型的发票文件,我想在每个发票文件中找到表格。在这个表中的位置不是固定的。所以我去做图像处理。首先我试图把我的发票转换成图像,然后我找到了基于表格边框的轮廓,最后我可以捕捉到表格的位置。用于下面代码中使用的任务。
with Image(page) as page_image:
    page_image.alpha_channel = False #eliminates transperancy
    img_buffer=np.asarray(bytearray(page_image.make_blob()), dtype=np.uint8)
    img = cv2.imdecode(img_buffer, cv2.IMREAD_UNCHANGED)

    ret, thresh = cv2.threshold(img, 127, 255, 0)
    im2, contours, hierarchy = cv2.findContours(thresh, cv2.RETR_TREE, cv2.CHAIN_APPROX_SIMPLE)
    margin=[]
    for contour in contours:
        # get rectangle bounding contour
        [x, y, w, h] = cv2.boundingRect(contour)
        # Don't plot small false positives that aren't text
        if (w >thresh1 and h> thresh2):
                margin.append([x, y, x + w, y + h])
#data cleanup on margin to extract required position values.在此代码thresh1中,thresh2将根据该文件进行更新。
因此,使用这段代码,我可以成功地读取图像中表格的位置,使用这个位置,我将处理我的invoice文件。例如
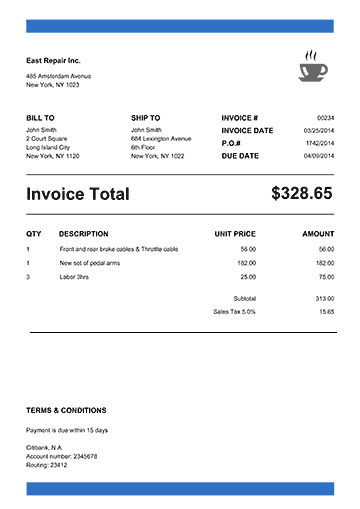
样本1:
样本2:
样本3:

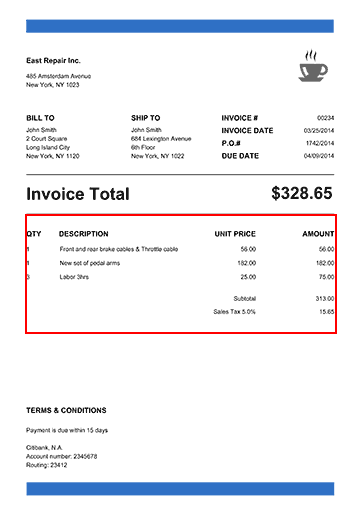
输出:
样本1:
样本2:
样本3:
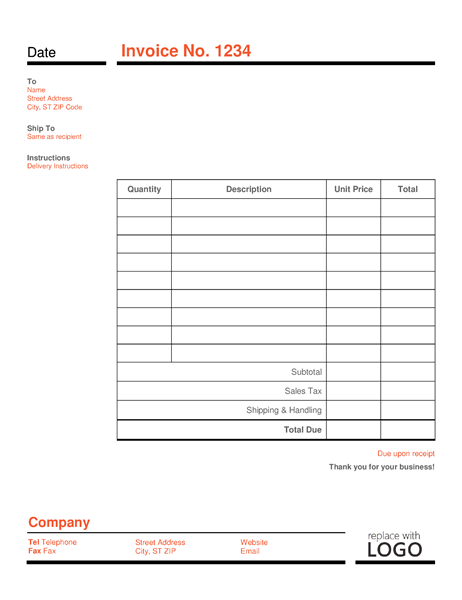
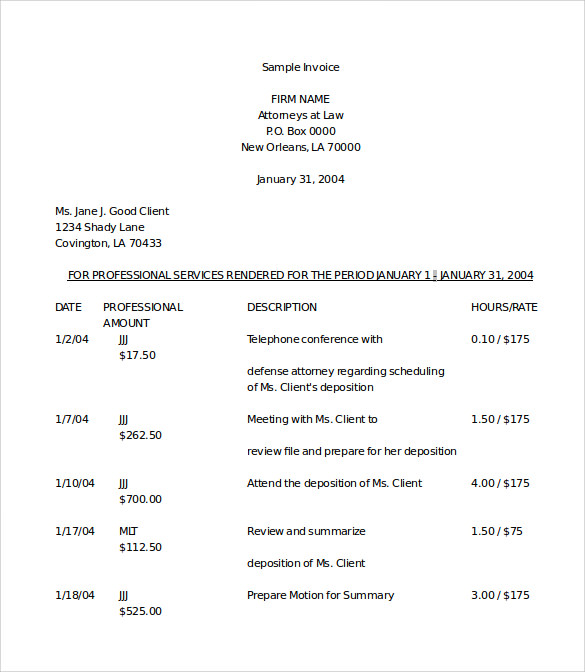
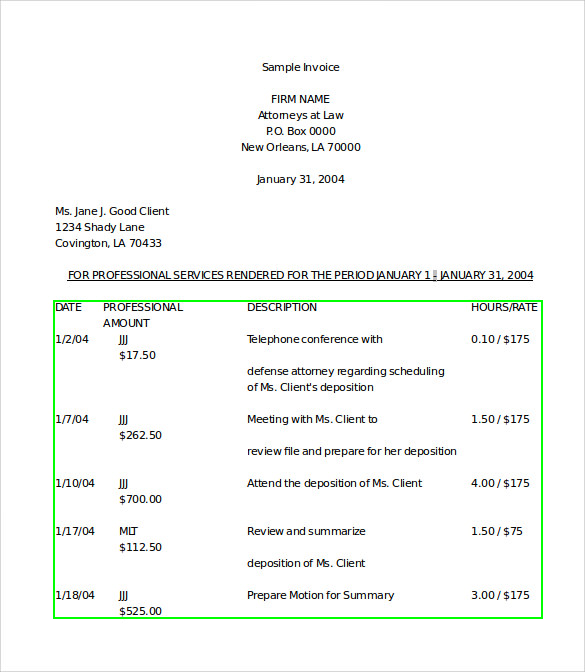
但是,现在我有了一种新的格式,它没有任何边框,但它是一个表。如何解决这个问题?因为我的整个操作只依赖于表的边框。但现在我没有桌子边框了。我怎样才能做到这一点?我不知道如何摆脱这个问题。我的问题是,有没有办法根据表格的结构找到职位?
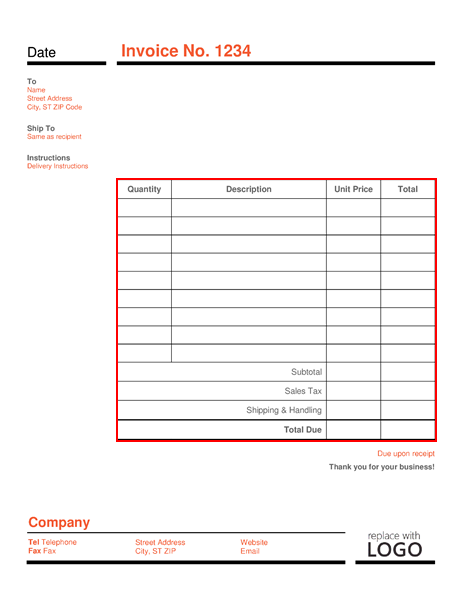
例如,我的问题输入如下所示:
我想找出它的立场如下:
我怎么才能解决这个问题?给我一个解决这个问题的主意真是太好了。
提前谢谢。
回答 4
Stack Overflow用户
发布于 2018-08-08 22:21:27
瓦伊巴夫是对的。您可以尝试使用不同的形态转换将像素提取或分组成不同的形状、线条等。例如,方法可以如下:
- 从扩展开始,将文本转换为实点。
- 然后应用findContours函数作为下一步,查找文本边框。
- 在有文本包围框之后,可以应用一些启发式算法将文本框按其坐标聚类成组。通过这种方式,您可以找到一组文本区域,它们对齐成行和列。
- 然后,您可以将x和y坐标排序和/或对组进行某些分析,以确定分组文本框是否可以形成表。
我写了一个小样本来说明这个想法。我希望代码是不言自明的。我也在那里发表了一些评论。
import os
import cv2
import imutils

# This only works if there's only one table on a page
# Important parameters:
#  - morph_size
#  - min_text_height_limit
#  - max_text_height_limit
#  - cell_threshold
#  - min_columns


def pre_process_image(img, save_in_file, morph_size=(8, 8)):

    # get rid of the color
    pre = cv2.cvtColor(img, cv2.COLOR_BGR2GRAY)
    # Otsu threshold
    pre = cv2.threshold(pre, 250, 255, cv2.THRESH_BINARY | cv2.THRESH_OTSU)[1]
    # dilate the text to make it solid spot
    cpy = pre.copy()
    struct = cv2.getStructuringElement(cv2.MORPH_RECT, morph_size)
    cpy = cv2.dilate(~cpy, struct, anchor=(-1, -1), iterations=1)
    pre = ~cpy

    if save_in_file is not None:
        cv2.imwrite(save_in_file, pre)
    return pre


def find_text_boxes(pre, min_text_height_limit=6, max_text_height_limit=40):
    # Looking for the text spots contours
    # OpenCV 3
    # img, contours, hierarchy = cv2.findContours(pre, cv2.RETR_LIST, cv2.CHAIN_APPROX_SIMPLE)
    # OpenCV 4
    contours, hierarchy = cv2.findContours(pre, cv2.RETR_LIST, cv2.CHAIN_APPROX_SIMPLE)

    # Getting the texts bounding boxes based on the text size assumptions
    boxes = []
    for contour in contours:
        box = cv2.boundingRect(contour)
        h = box[3]

        if min_text_height_limit < h < max_text_height_limit:
            boxes.append(box)

    return boxes


def find_table_in_boxes(boxes, cell_threshold=10, min_columns=2):
    rows = {}
    cols = {}

    # Clustering the bounding boxes by their positions
    for box in boxes:
        (x, y, w, h) = box
        col_key = x // cell_threshold
        row_key = y // cell_threshold
        cols[row_key] = [box] if col_key not in cols else cols[col_key] + [box]
        rows[row_key] = [box] if row_key not in rows else rows[row_key] + [box]

    # Filtering out the clusters having less than 2 cols
    table_cells = list(filter(lambda r: len(r) >= min_columns, rows.values()))
    # Sorting the row cells by x coord
    table_cells = [list(sorted(tb)) for tb in table_cells]
    # Sorting rows by the y coord
    table_cells = list(sorted(table_cells, key=lambda r: r[0][1]))

    return table_cells


def build_lines(table_cells):
    if table_cells is None or len(table_cells) <= 0:
        return [], []

    max_last_col_width_row = max(table_cells, key=lambda b: b[-1][2])
    max_x = max_last_col_width_row[-1][0] + max_last_col_width_row[-1][2]

    max_last_row_height_box = max(table_cells[-1], key=lambda b: b[3])
    max_y = max_last_row_height_box[1] + max_last_row_height_box[3]

    hor_lines = []
    ver_lines = []

    for box in table_cells:
        x = box[0][0]
        y = box[0][1]
        hor_lines.append((x, y, max_x, y))

    for box in table_cells[0]:
        x = box[0]
        y = box[1]
        ver_lines.append((x, y, x, max_y))

    (x, y, w, h) = table_cells[0][-1]
    ver_lines.append((max_x, y, max_x, max_y))
    (x, y, w, h) = table_cells[0][0]
    hor_lines.append((x, max_y, max_x, max_y))

    return hor_lines, ver_lines


if __name__ == "__main__":
    in_file = os.path.join("data", "page.jpg")
    pre_file = os.path.join("data", "pre.png")
    out_file = os.path.join("data", "out.png")

    img = cv2.imread(os.path.join(in_file))

    pre_processed = pre_process_image(img, pre_file)
    text_boxes = find_text_boxes(pre_processed)
    cells = find_table_in_boxes(text_boxes)
    hor_lines, ver_lines = build_lines(cells)

    # Visualize the result
    vis = img.copy()

    # for box in text_boxes:
    #     (x, y, w, h) = box
    #     cv2.rectangle(vis, (x, y), (x + w - 2, y + h - 2), (0, 255, 0), 1)

    for line in hor_lines:
        [x1, y1, x2, y2] = line
        cv2.line(vis, (x1, y1), (x2, y2), (0, 0, 255), 1)

    for line in ver_lines:
        [x1, y1, x2, y2] = line
        cv2.line(vis, (x1, y1), (x2, y2), (0, 0, 255), 1)

    cv2.imwrite(out_file, vis)
我得到了以下输出:

当然,为了使该算法更加健壮,并适用于各种不同的输入图像,必须对其进行相应的调整。
更新:更新了有关findContours的OpenCV API更改的代码。如果您安装了较早版本的OpenCV -使用相应的调用。Related post。
Stack Overflow用户
发布于 2018-06-13 06:23:05
您可以尝试应用一些形态转换(例如膨胀、侵蚀或高斯模糊)作为findContours函数之前的预处理步骤。
例如
blur = cv2.GaussianBlur(g, (3, 3), 0)
ret, thresh1 = cv2.threshold(blur, 150, 255, cv2.THRESH_BINARY)
bitwise = cv2.bitwise_not(thresh1)
erosion = cv2.erode(bitwise, np.ones((1, 1) ,np.uint8), iterations=5)
dilation = cv2.dilate(erosion, np.ones((3, 3) ,np.uint8), iterations=5)
最后一个参数,迭代显示将要发生的扩张/侵蚀的程度(在您的例子中,在文本上)。拥有一个小的值将导致小的独立轮廓,甚至在一个字母表内,而大的值将使许多附近的元素结合在一起。您需要找到理想的值,以便只有您的图像块得到。
请注意,我以150作为阈值参数,因为我一直在努力从不同背景的图像中提取文本,这样效果更好。您可以选择继续使用您所取的值,因为它是黑白图像。
Stack Overflow用户
发布于 2020-05-10 18:12:34
文档图像中有许多类型的表,有太多的变化和布局。无论您编写了多少条规则,都会出现一个规则将失败的表。这些类型的问题都是用基于ML(机器学习)的解决方案来解决的。您可以在github上找到许多预实现的代码,以解决使用ML或DL (深度学习)检测图像中的表的问题。
下面是我的代码以及深入学习模型,该模型可以检测各种类型的表以及表中的结构单元格:https://github.com/DevashishPrasad/CascadeTabNet
该方法目前(2020年5月10日)在各种公共数据集的准确性方面达到了最先进的水平。
https://stackoverflow.com/questions/50829874
复制相似问题
腾讯云开发者
