
增加线性回归图(ggplot2)的R平方?
增加线性回归图(ggplot2)的R平方?
提问于 2018-07-09 08:48:30
我一直在尝试不同的建议,比如ggmisc包,但是似乎没有什么对我有好处。
我使用的是iris数据,并试图绘制随机变量:
modellm <- lm(`Sepal.Length` ~ `Sepal.Width` + `Petal.Length` + `Petal.Width`, data = iris)

model <- coef(Modellm)["(Intercept)"] +
  coef(Modellm)["Sepal.Width"] * iris$`Sepal.Width` +
  coef(Modellm)["Petal.Length"] * iris$`Petal.Length` +
  coef(Modellm)["Petal.Width"] * iris$`Petal.Width` +
  residuals(Modellm)

library(ggplot2)
ggplot(iris, aes(`Sepal.Length`, model))+
  geom_point(size=2, alpha=0.2)+
  geom_smooth(method='lm')
我怎么可能在in图中得到R平方值呢?
回答 2
Stack Overflow用户
发布于 2018-07-09 08:56:41
如果要显示r平方值,只需将其添加到绘图的末尾:
+ annotate("text", x = 1, y = 1, label = paste0("R Squared = ", summary(modellm)$r.squared))用x和y坐标调整位置
Stack Overflow用户
发布于 2018-07-09 09:24:08
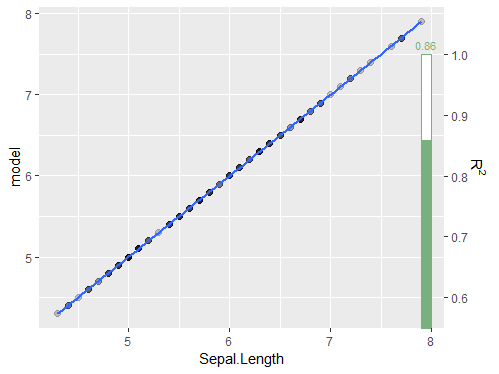
如果您真的想要 R^2,您可以这样做。
library(ggplot2)
p <- ggplot(iris, aes(`Sepal.Length`, model))+
  geom_point(size=2, alpha=0.2)+
  geom_smooth(method='lm')

r2 <- summary(Modellm)$r.squared

p + scale_y_continuous(
  sec.axis=sec_axis(~ . * 4 / 30 , name = expression(paste(R^{2})))) +
  geom_rect(xmin=7.9, xmax=8, ymin=0, ymax=1*30/4,
            fill="white", color="#78B17E") +
  geom_rect(xmin=7.9, xmax=8, ymin=0, ymax=r2*30/4, fill="#78B17E") +
  annotate("text", x = 7.95, y = 7.62, size=3, color="#78B17E",
           label = paste0(round(r2, 2)))
产生
页面原文内容由Stack Overflow提供。腾讯云小微IT领域专用引擎提供翻译支持
原文链接:
https://stackoverflow.com/questions/51241440
复制相关文章
相似问题
腾讯云开发者
