
设置Matplotlib直方图的高度
设置Matplotlib直方图的高度
提问于 2018-11-28 21:34:02
我对改变直方图中条形图的高度有问题。
我有以下直方图:
x = [1,2,
     11,12,
     21,22,
     31,32,33,34,35,
     41,42,43,44,45,46,47,48,
     51,52,53,54,55,56,57,58,59,
     61,62,63,64,65,66,
     71,72,73,74,75,67,
     81,82,83,
     91,92,
     101]
num_bins = [0,3,10,30,40,50,65,80,90,100]

n, x,_ = plt.hist(x, num_bins)
plt.show()
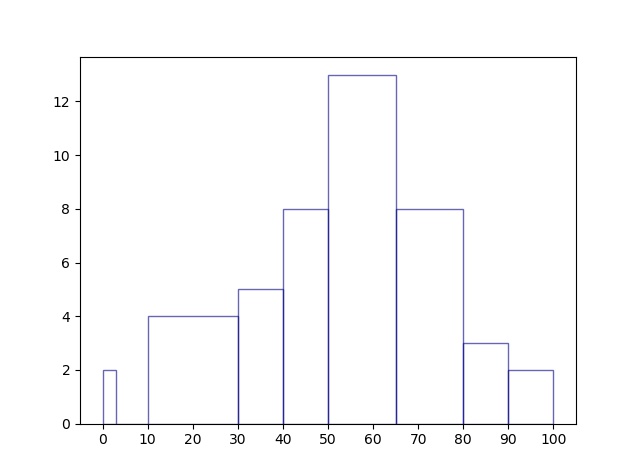
对于相同的数据,我想要创建一个具有相同的bin宽度的直方图,但是每个条的高度应该更改为该条的总高度除以其bin宽度。
例如,第一个栏的总高度是2,它的仓宽是3。因此,新的仓应该有高度2/3,宽度仍然是3,等等。
非常感谢!
回答 2
Stack Overflow用户
回答已采纳
发布于 2018-11-28 21:54:10
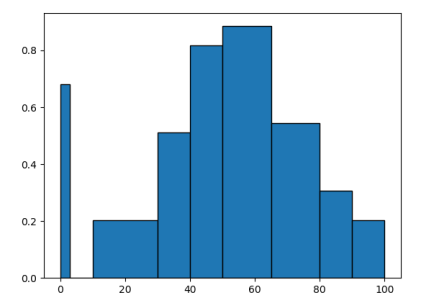
本质上你是在寻找一个标准化的直方图。这可以通过density参数来实现。然而,它将被规范化为1。相反,您正在寻找数据总数的规范化。因此,可以将归一化直方图乘以数组x的长度。
import numpy as np
import matplotlib.pyplot as plt
x = [1,2,
     11,12,
     21,22,
     31,32,33,34,35,
     41,42,43,44,45,46,47,48,
     51,52,53,54,55,56,57,58,59,
     61,62,63,64,65,66,
     71,72,73,74,75,67,
     81,82,83,
     91,92,
     101]
num_bins = [0,3,10,30,40,50,65,80,90,100]

n, bins  = np.histogram(x, num_bins, density=True)
plt.bar(bins[:-1], n*len(x), align="edge", width=np.diff(bins), ec="k")
plt.show()
Stack Overflow用户
发布于 2018-11-28 22:18:24
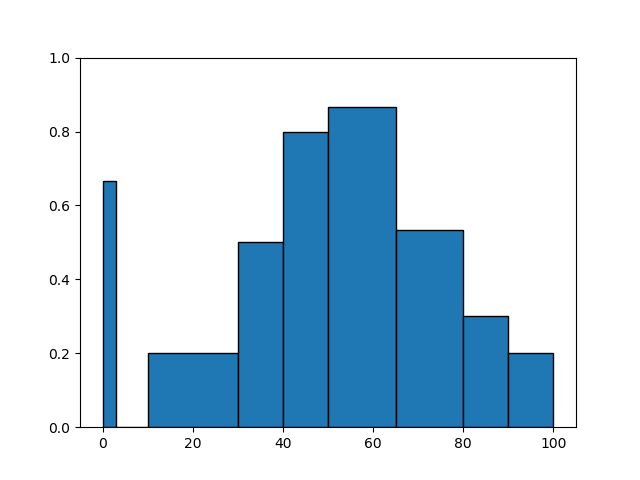
plt.hist返回一个矩形对象列表(使用变量_命名)。您可以修改这些对象的高度:
# Create your histogram:
n, bins, rects = plt.hist(x, num_bins, ec='k')

# iterate through rectangles, change the height of each
for r in rects:
    r.set_height(r.get_height()/r.get_width())

# set the y limit
plt.ylim(0,1)

plt.show()
页面原文内容由Stack Overflow提供。腾讯云小微IT领域专用引擎提供翻译支持
原文链接:
https://stackoverflow.com/questions/53528460
复制相关文章
相似问题
腾讯云开发者
