
“获取http://localhost:9443/metrics:拨号tcp 127.0.0.1:9443:连接:连接被拒绝”
我正在尝试配置Prometheus和Grafana,使用我的Hyperledger fabric v1.4网络来分析对等和链码合并。在遵循这个9443之后,我已经将对等容器的端口9443映射到了主机的端口文档。我还将对等方的provider条目更改为prometheus中的metrics部分中的metrics条目。我在docker-compose.yml中配置了prometheus和grafana,如下所示。
  prometheus:
    image: prom/prometheus:v2.6.1
    container_name: prometheus
    volumes:
    - ./prometheus/:/etc/prometheus/
    - prometheus_data:/prometheus
    command:
    - '--config.file=/etc/prometheus/prometheus.yml'
    - '--storage.tsdb.path=/prometheus'
    - '--web.console.libraries=/etc/prometheus/console_libraries'
    - '--web.console.templates=/etc/prometheus/consoles'
    - '--storage.tsdb.retention=200h'
    - '--web.enable-lifecycle'
    restart: unless-stopped
    ports:
    - 9090:9090
    networks:
    - basic
    labels:
    org.label-schema.group: "monitoring"

  grafana:
    image: grafana/grafana:5.4.3
    container_name: grafana
    volumes:
    - grafana_data:/var/lib/grafana
    - ./grafana/datasources:/etc/grafana/datasources
    - ./grafana/dashboards:/etc/grafana/dashboards
    - ./grafana/setup.sh:/setup.sh
    entrypoint: /setup.sh
    environment:
    - GF_SECURITY_ADMIN_USER={ADMIN_USER}
    - GF_SECURITY_ADMIN_PASSWORD={ADMIN_PASS}
    - GF_USERS_ALLOW_SIGN_UP=false
    restart: unless-stopped
    ports:
    - 3000:3000
    networks:
    - basic
    labels:
org.label-schema.group: "monitoring"当我在我的远程中心机器上curl 0.0.0.0:9443/metrics时,我得到了所有的度量列表。但是,当我使用上面的配置运行Prometheus时,它会抛出错误Get http://localhost:9443/metrics: dial tcp 127.0.0.1:9443: connect: connection refused。这就是我的prometheus.yml的样子。
global:
  scrape_interval:     15s
  evaluation_interval: 15s

scrape_configs:
  - job_name: 'prometheus'
    scrape_interval: 10s
    static_configs:
      - targets: ['localhost:9090']

  - job_name: 'peer_metrics'
    scrape_interval: 10s
    static_configs:
- targets: ['localhost:9443']甚至,当我在浏览器中进入端点http://localhost:9443/metrics时,我也会得到所有的指标。我在这里做错什么了。为什么Prometheus的度量标准被显示在它的接口上而不是peer的?
回答 6
Stack Overflow用户
发布于 2019-01-28 09:24:48
您的prometheus容器不在主机网络上运行。它运行在自己的桥上(由坞-组合创建的桥)。因此,对等端的scrape应该指向对等容器的IP。
建议的解决办法:
- 在同一网络中运行prometheus和grafana与fabric网络。在您的停靠-撰写普罗米修斯堆栈中,您可以这样引用它:
networks:
  default:
    external:
name: <your-hyperledger-network>(使用docker network ls查找网络名称)
然后,您可以在刮除配置中使用http://<peer_container_name>:9443。
Stack Overflow用户
发布于 2019-11-19 11:39:41
由于目标不在prometheus容器中运行,因此无法通过localhost访问它们。您需要通过主机私有IP访问它们,或者用docker.for.mac.localhost或host.docker.internal替换docker.for.mac.localhost或host.docker.internal。
Stack Overflow用户
发布于 2020-03-17 15:12:01
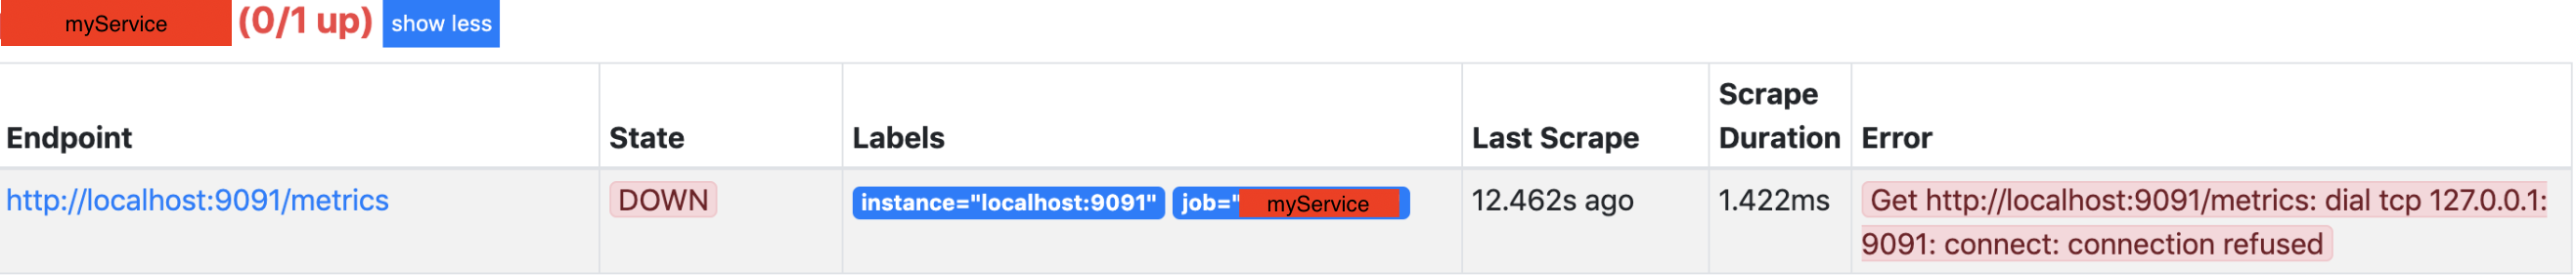
问题:在Prometheus上,您添加了一个用于抓取的服务,但是在http://localhost:9090/targets上,端点状态是Down,有一个错误:
获取http://localhost:9091/metrics:拨号tcp 127.0.0.1:9091:连接:连接被拒绝
解决方案:在prometheus.yml上,您需要验证
- 抓取指向正确端点的详细信息。
- yml压痕是正确的。
- 使用
curl -v http://<serviceip>:<port>/metrics应该提示终端中明文的度量标准。
备注:如果您指向另一个码头容器中的某个服务,您的本地主机可能不是表示为本地主机,而是表示为servicename (在docker ps中显示的服务名称)或docker.host.internal (运行码头容器的内部ip )。
对于本例,:,我将使用两个码头容器,prometheus和"myService“。
sudo docker ps

CONTAINER ID        IMAGE                     CREATED                        PORTS                    NAMES
abc123        prom/prometheus:latest        2 hours ago               0.0.0.0:9090->9090/tcp         prometheus
def456 myService/myService:latest 2 hours ago 0.0.0.0:9091->9091/tcp myService然后编辑文件prometheus.yml (并重新运行prometheus)
- job_name: myService
  scrape_interval: 15s
  scrape_timeout: 10s
  metrics_path: /metrics
  static_configs:
    - targets: // Presenting you 3 options
      - localhost:9091 // simple localhost
      - docker.host.internal:9091 // the localhost of agent that runs the docker container
- myService:9091 // docker container name (worked in my case)https://stackoverflow.com/questions/54397463
复制相似问题
腾讯云开发者
