
Matplotlib集x滴答标签不交换顺序。
Matplotlib集x滴答标签不交换顺序。
提问于 2019-02-08 13:04:22
我想要做一个线状图,其中本质上(狗,1),(猫,2),(鸟,3)等等都是用线绘制和连接的。另外,我希望能够确定X轴中标签的顺序。Matplotlib自动绘制命令“狗”、“猫”和“鸟”标签。尽管我尝试重新排列命令‘狗’,‘鸟’,‘长颈鹿’,‘猫’,图形没有改变(见图)。我该怎么做才能相应地排列图表呢?
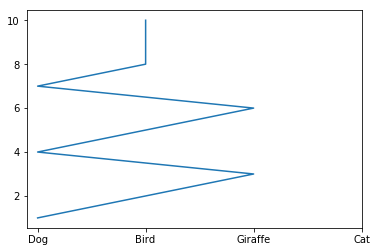
x = ['Dog','Cat','Bird','Dog','Cat','Bird','Dog','Cat','Cat','Cat']
y = [1,2,3,4,5,6,7,8,9,10]
x_ticks_labels = ['Dog','Bird','Giraffe','Cat']

fig, ax = plt.subplots(1,1)
ax.plot(x,y)

# Set number of ticks for x-axis
ax.set_xticks(range(len(x_ticks_labels)))
# Set ticks labels for x-axis
ax.set_xticklabels(x_ticks_labels)回答 1
Stack Overflow用户
回答已采纳
发布于 2019-02-08 13:50:27
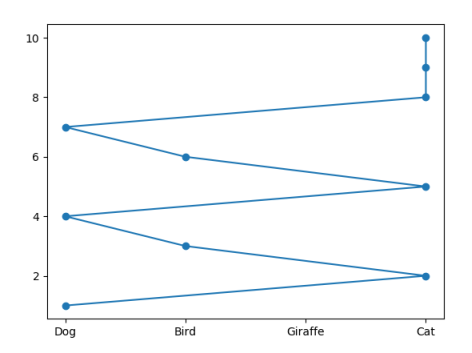
使用matplotlib的分类特性
您可以预先确定轴上类别的顺序,首先以正确的顺序绘制某些内容,然后再删除它。
import numpy as np
import matplotlib.pyplot as plt

x = ['Dog','Cat','Bird','Dog','Cat','Bird','Dog','Cat','Cat','Cat']
y = [1,2,3,4,5,6,7,8,9,10]
x_ticks_labels = ['Dog','Bird','Giraffe','Cat']

fig, ax = plt.subplots(1,1)

sentinel, = ax.plot(x_ticks_labels, np.linspace(min(y), max(y), len(x_ticks_labels)))
sentinel.remove()
ax.plot(x,y, color="C0", marker="o")

plt.show()
确定值的指标
另一种选择是确定来自x的值将在x_tick_labels中使用的索引。不幸的是,没有规范的方法可以做到这一点;在这里,我使用this answer使用np.where获取解决方案。然后,可以简单地根据这些索引绘制y值,并相应地设置滴答和滴答标签。
import numpy as np
import matplotlib.pyplot as plt

x = ['Dog','Cat','Bird','Dog','Cat','Bird','Dog','Cat','Cat','Cat']
y = [1,2,3,4,5,6,7,8,9,10]
x_ticks_labels = ['Dog','Bird','Giraffe','Cat']

xarr = np.array(x)
ind = np.where(xarr.reshape(xarr.size, 1) == np.array(x_ticks_labels))[1]

fig, ax = plt.subplots(1,1)

ax.plot(ind,y, color="C0", marker="o")
ax.set_xticks(range(len(x_ticks_labels)))
ax.set_xticklabels(x_ticks_labels)

plt.show()
结果在两种情况下
页面原文内容由Stack Overflow提供。腾讯云小微IT领域专用引擎提供翻译支持
原文链接:
https://stackoverflow.com/questions/54593061
复制相关文章
相似问题
腾讯云开发者
