
如何修复gnuplot中的xtics标签重叠
如何修复gnuplot中的xtics标签重叠
提问于 2019-04-17 03:52:03
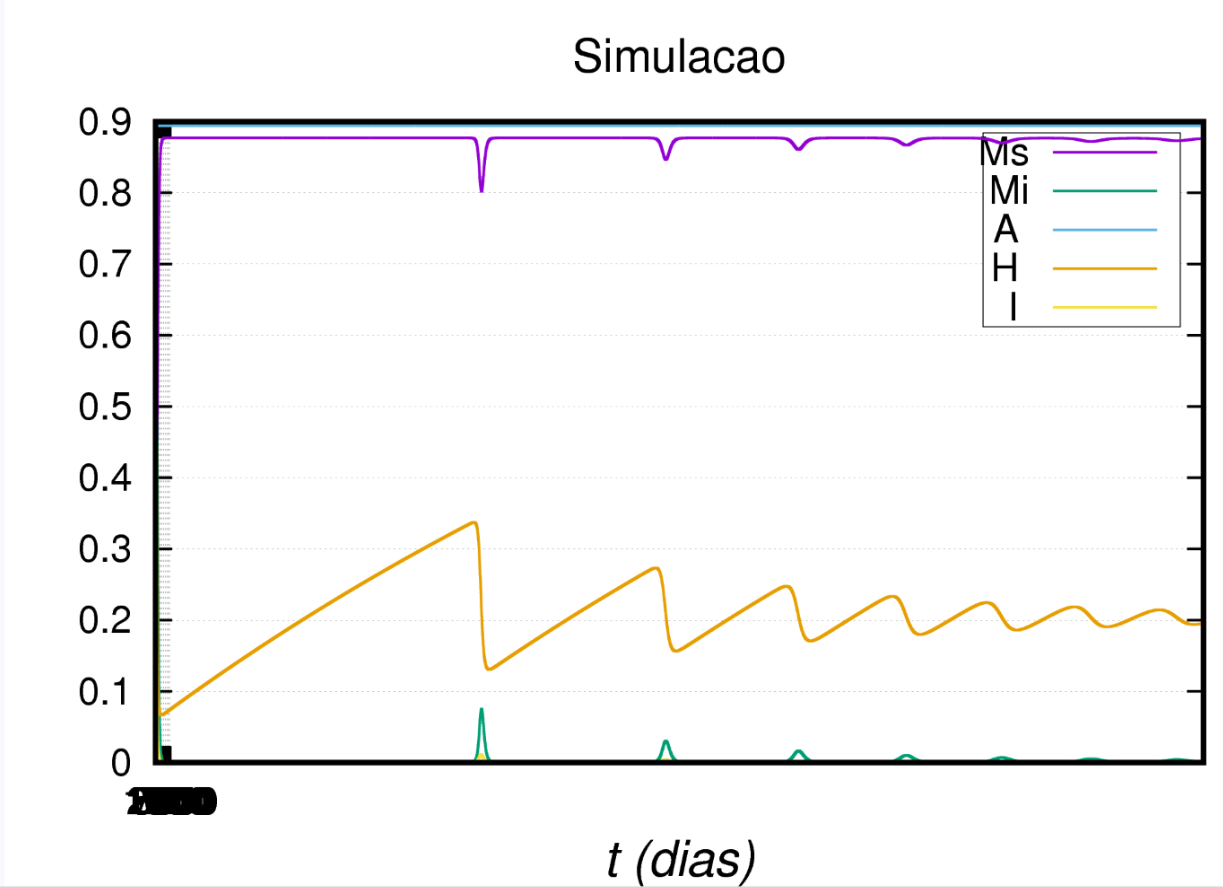
我用GNUPlot绘制五个实值函数的图。我认为这很容易解决,但我是一个初学者。我的x轴的标签有问题。所有的xtics数都是重叠的,我不知道为什么。我的.plt绘制了3个文件:一个.eps、一个pb .eps和一个.png。它接收一个.100文件,它是6列数字。第一列表示t的值,其他五列表示每个函数在各自t处的值。
我的.plt文件是:
reset
set terminal windows

set style line 1 lt 1 linewidth   3
set style line 2 lt 2 linewidth   3
set style line 3 lt 3 linewidth   3
set style line 4 lt 4 linewidth   3
set style line 5 lt 5 linewidth   3
set style line 6 lt 6 linewidth   3


set border linewidth 3

set xzeroaxis
set yzeroaxis

set xlabel '{/Helvetica-Oblique t (dias)}' enhanced font ',28'

set key center top
set key center right
set key top right
set key box

set tics scale 1.5

set grid ytics
set grid xtics

set xtics 0,250,3500

set ytics 0,0.1,1


set title 'Simulacao' font ',26'

set samples 100

plot "./fort.100"  using 1:2 with lines title 'Ms' linestyle 1, \
     "./fort.100"  using 1:3 with lines title 'Mi' linestyle 2, \
     "./fort.100"  using 1:4 with lines title 'A ' linestyle 3, \
     "./fort.100"  using 1:5 with lines title 'H ' linestyle 4, \
     "./fort.100"  using 1:6 with lines title 'I ' linestyle 5

pause -1

set terminal postscript eps enhanced
set termoption enhanced
set output "xsol-pb.eps"

replot

set terminal postscript eps enhanced color font ',22'
set termoption enhanced
set output "xsol.eps"

replot

set terminal png giant size 900,600 enhanced
set termoption enhanced
set output "xsol.png"

replot
链接到我的.eps图:
我怎样才能解决这个问题?
我也有一个问题的桌子,在右上角的形象。怎么解决这个问题?
Stack Overflow用户
发布于 2019-04-17 21:25:58
避免数据和密钥“碰撞”的两种可能性:
- 调整你的比例,使曲线低于键,在你的情况下,例如
set yrange[0:1.5] - 移动键的位置,例如
set key center right或set key at graph 0.8, graph 0.8。有关更多信息,请查看help key。
页面原文内容由Stack Overflow提供。腾讯云小微IT领域专用引擎提供翻译支持
原文链接:
https://stackoverflow.com/questions/55719610
复制相关文章
相似问题
腾讯云开发者
