
如何获得信号最大振幅的10%的(x,y)坐标?
如何获得信号最大振幅的10%的(x,y)坐标?
提问于 2019-05-25 11:58:41
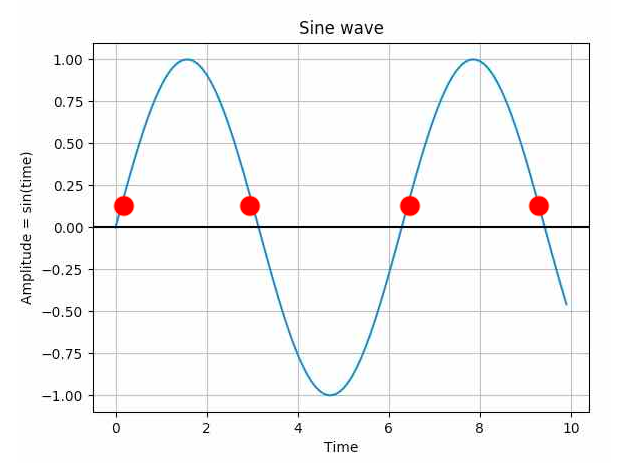
如何提取正弦波的(x,y)坐标,当正弦波最大振幅的10%时,如图(红点)所示?我的“x-值”是数组的时间和索引号。
我曾尝试过这样的方法,但效果不佳:
sinewave_max = sinewave[0:argmax(sinewave)]
for i,val in enumerate(sinewave_max):
                if i == int(0.1*(len(sinewave_max))):
                    y = sinewave_max[i]
x = index(y) (#Pseudo-Code line) 回答 2
Stack Overflow用户
回答已采纳
发布于 2019-05-25 12:26:48
这里有一种方法。其思想是有一个x点的密集网格,然后定义一个小的容差值。然后查找y-数组中的值,该值接近最大高度(=1) 在此公差中的0.1倍。
import numpy as np
import matplotlib.pyplot as plt

x = np.linspace(0, 10, 1000)
y = np.sin(x)

plt.plot(x, y)
plt.axhline(0, color='k')
tol = 1e-2
ind = np.argwhere(abs(y-0.1*max(y))<=tol)

plt.scatter(x[ind], y[ind], c='r', s=100, zorder=3)
plt.xlabel('Time')
plt.ylabel('Amplitude = sin(time)')
plt.title('Sine wave')
plt.grid()
plt.show()
Stack Overflow用户
发布于 2019-05-25 13:07:42
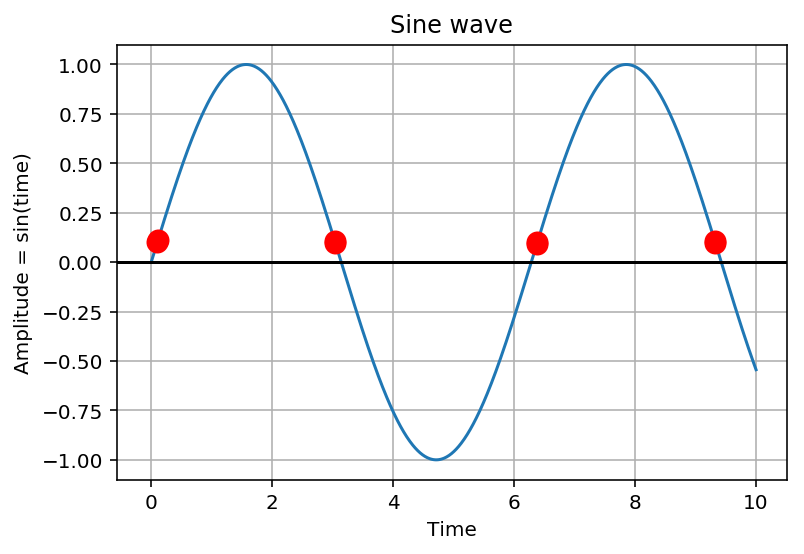
既然你给熊猫贴上标签,你就可以用熊猫的cumsum来做
x = np.linspace(0, 10, 1000)
y = np.sin(x)
thresh = max(y) * 0.10

s = pd.Series(y>thresh)

# idx contains the jump from y<=thresh to y>thresh
# except possibly the first position
idx = s.index[s.ne(s.shift())]

# check the first position
if y[0] < thresh: idx = idx[1:]

# plot:
plt.figure(figsize=(10,6))
plt.plot(x,y)
plt.scatter(x[idx],y[idx], c='r', s=100)
plt.grid(True)
情节:
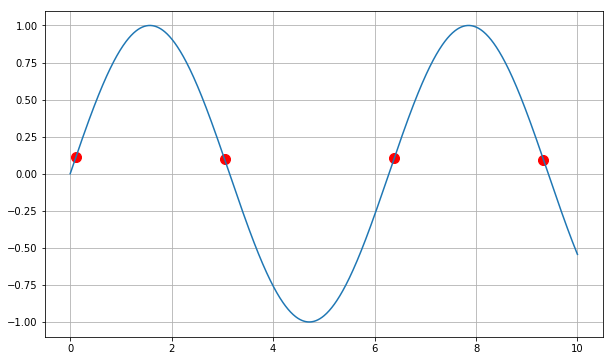
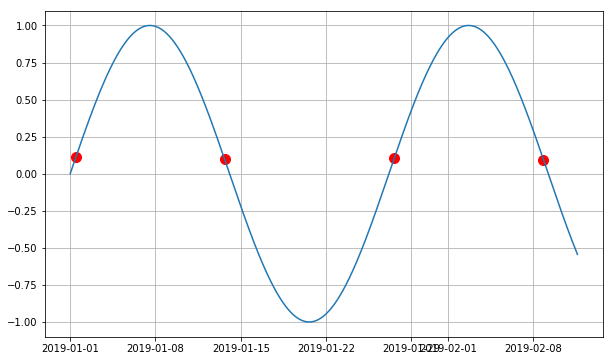
Note:如果正如您所说的,x系列是y的时间索引,那么上面的代码需要更改为:
s = pd.Series(y>thresh)

# idx contains the jump from y<=thresh to y>thresh
# except possibly the first position
idx = s.index[s.ne(s.shift())]

# check the first position
if y.iloc < thresh: idx = idx[1:]

plt.figure(figsize=(10,6))
plt.plot(x,y)

# we only need to plot y[idx] against idx now
plt.scatter(idx,y[idx], c='r', s=100)
plt.grid(True)
这意味着:
页面原文内容由Stack Overflow提供。腾讯云小微IT领域专用引擎提供翻译支持
原文链接:
https://stackoverflow.com/questions/56304639
复制相关文章
相似问题
腾讯云开发者
