
对mpl.figure.Figure的列表引用不显示情节
对mpl.figure.Figure的列表引用不显示情节
提问于 2019-07-30 14:02:33
我试图用一个对象来处理一个数字列表。不幸的是,从一张数字清单中画出图似乎有问题。
请注释掉下面示例中的行,您将看到绘图是如何中断的:
import matplotlib as mpl
from matplotlib.backends.backend_qt5agg import FigureCanvasQTAgg, FigureManagerQT
class Test:
def __init__(self):
self.figs = [mpl.figure.Figure(),mpl.figure.Figure()]
self.fig = mpl.figure.Figure()
ax = self.fig.subplots()
ax.plot([1,2],[3,4])
def show(self):
fig = self.fig # works
# fig = self.figs[0] # does not work
canvas = FigureCanvasQTAgg(fig)
figManager = FigureManagerQT(canvas, 0)
a=Test()
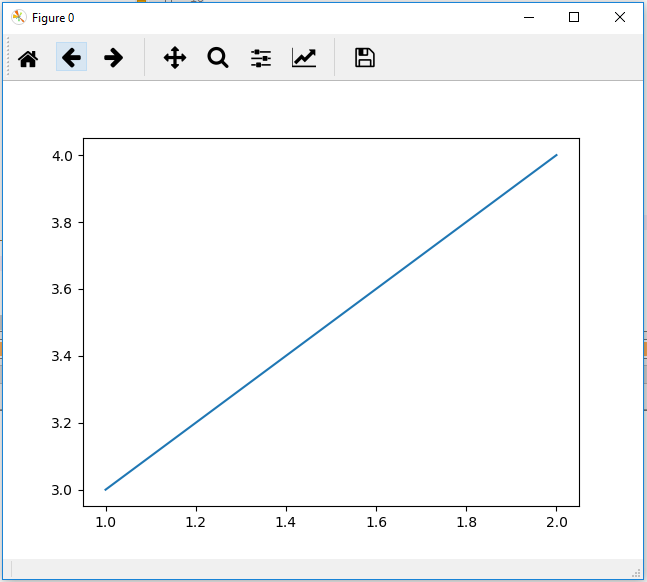
a.show()结果(这是我想要的):
结果行未注释:
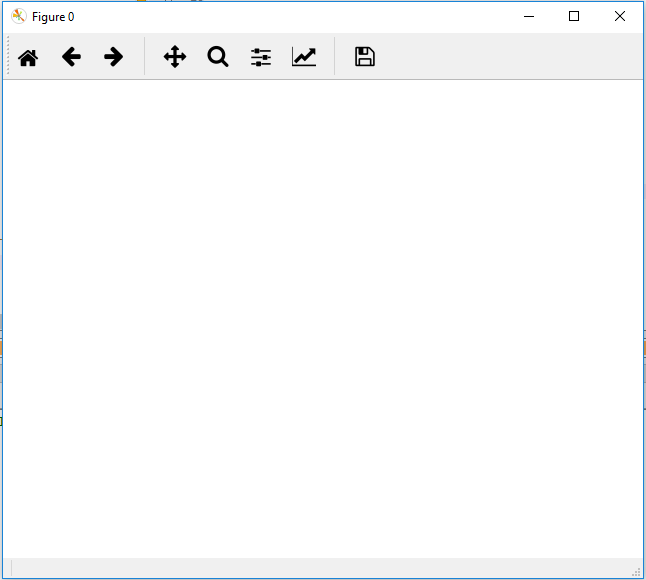
在其他一些测试中,我发现它可能与破坏对象有关。由于list是一个可变对象,这可能是连接。我还尝试了(失败的)几个变通方法来复制图形对象以进行绘图:我使用了类似于fig = myCopy(self.figs[0])和pickle-copy的东西。
你能给我解释一下正在发生的事情以及什么是解决办法吗?
回答 1
Stack Overflow用户
回答已采纳
发布于 2019-07-30 14:14:46
在__init__中,将轴赋予self.fig,并绘制此Axes对象:
class Test:
    def __init__(self):
        self.figs = [mpl.figure.Figure(),mpl.figure.Figure()]
        self.fig = mpl.figure.Figure()
        ax = self.fig.subplots()
ax.plot([1,2],[3,4])self.figs中的图形对象没有附加Axes对象,因此它们基本上是空的。因此,你看到的是一个空洞的数字:
def show(self):
    fig = self.figs[0] # This is a figure with no axes
    canvas = FigureCanvasQTAgg(fig)
figManager = FigureManagerQT(canvas, 0)逻辑的问题是,在__init__方法中绘制数据并不是真正有意义的。您的工作流程应该是:
- 初始化
- 图形选择
- 绘图
- 显示
我建议您添加两种方法,select_figure和plot,以提高图形管理器的总体可用性:
class Test:
    def __init__(self):
        self.fig = None
        self.figures = [mpl.figure.Figure(), mpl.figure.Figure()]

    def select_figure(self, index):
        self.fig = self.figures[index]

    def plot(self, x, y):
        ax = self.fig.subplots()
        ax.plot(x, y)

    def show(self):
        canvas = FigureCanvasQTAgg(self.fig)
        figManager = FigureManagerQT(canvas, 0)
然后,您可以实现我前面描述的工作流:
test = Test()

test.select_figure(0)
test.plot([1, 2], [3, 4])
test.show()

test.select_figure(1)
test.plot([3, 4], [5, 6])
test.show()页面原文内容由Stack Overflow提供。腾讯云小微IT领域专用引擎提供翻译支持
原文链接:
https://stackoverflow.com/questions/57273569
复制相关文章
相似问题
腾讯云开发者
