
将数字字符串形象化为矩阵热图
将数字字符串形象化为矩阵热图
提问于 2019-08-15 18:38:00
我试图可视化一个数字字符串的矩阵,作为一个热图,举这个例子,36个元素长度的“历史”数字字符串,假设我有6行(实际上我有500行)。我想要可视化一个矩阵的热图6x36“像素或细胞”。此外,在“生存”变量上按真假对它们进行排序或分割将是很好的。
    testdata=
       History                                Survive
    1  111111111111111211111111111111111111   FALSE
    2  111111111111111110000000000000000000   TRUE
    3  000111222111111111111111111111110000   FALSE
    4  111111111111111111111111100000000000   TRUE
    5  011231111111111111111111111111111111   FALSE
6 111111234111111111111111110000000000 TRUE回答 1
Stack Overflow用户
回答已采纳
发布于 2019-08-15 22:19:15
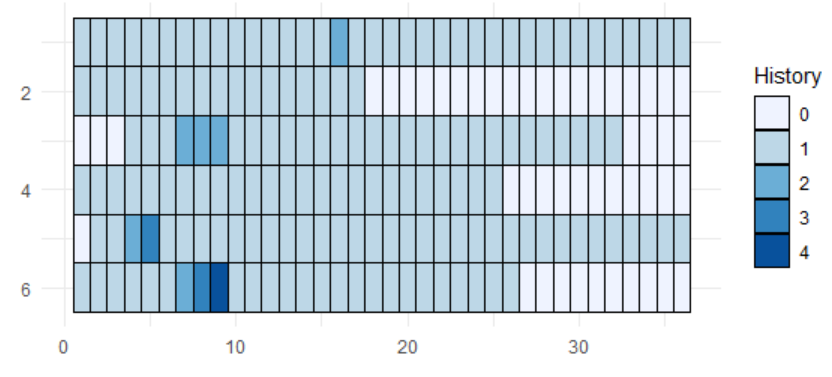
这里有一个想法。我们可以拆分Histroy列,然后创建rowid和ID列,将数据绘制为热图。
library(tidyverse)

testdata2 <- testdata %>% mutate(History = str_split(History, pattern = ""))

testdata3 <- testdata2%>%
  rowid_to_column() %>%
  unnest() %>%
  group_by(rowid) %>%
  mutate(ID =row_number())

p <- ggplot(testdata3, aes(x = ID, y = rowid, fill = History)) +
  geom_tile(color = "black") +
  scale_fill_brewer() +
  scale_y_reverse() +
  labs(x = "", y = "") +
  theme_minimal()

print(p)
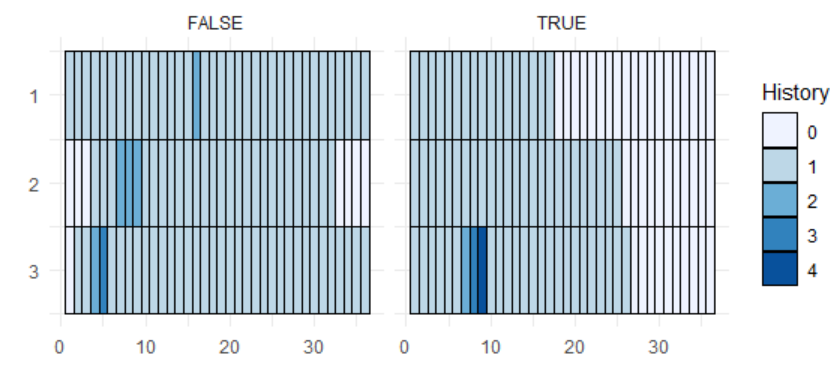
如果我们想通过TRUE和FALSE在Survival列中将数据绘制为面,则需要将rowid分别创建为TRUE和FALSE for Survival。
testdata4 <- testdata2%>%
  group_by(Survive) %>%
  mutate(rowid = row_number()) %>%
  unnest() %>%
  group_by(Survive, rowid) %>%
  mutate(ID = row_number())

p2 <- ggplot(testdata4, aes(x = ID, y = rowid, fill = History)) +
  geom_tile(color = "black") +
  scale_fill_brewer() +
  scale_y_reverse() +
  labs(x = "", y = "") +
  theme_minimal() +
  facet_grid(~ Survive)

print(p2)
数据
testdata <- read.table(text =
    "  History                                Survive
    1  111111111111111211111111111111111111   FALSE
    2  111111111111111110000000000000000000   TRUE
    3  000111222111111111111111111111110000   FALSE
    4  111111111111111111111111100000000000   TRUE
    5  011231111111111111111111111111111111   FALSE
    6  111111234111111111111111110000000000   TRUE",
    header = TRUE, stringsAsFactors = FALSE,
colClasses = c("numeric", "character", "logical")) 页面原文内容由Stack Overflow提供。腾讯云小微IT领域专用引擎提供翻译支持
原文链接:
https://stackoverflow.com/questions/57514536
复制相关文章
相似问题
腾讯云开发者
