
创建两种不同度量标准的100%堆叠条形图的问题
创建两种不同度量标准的100%堆叠条形图的问题
提问于 2019-09-06 10:16:29
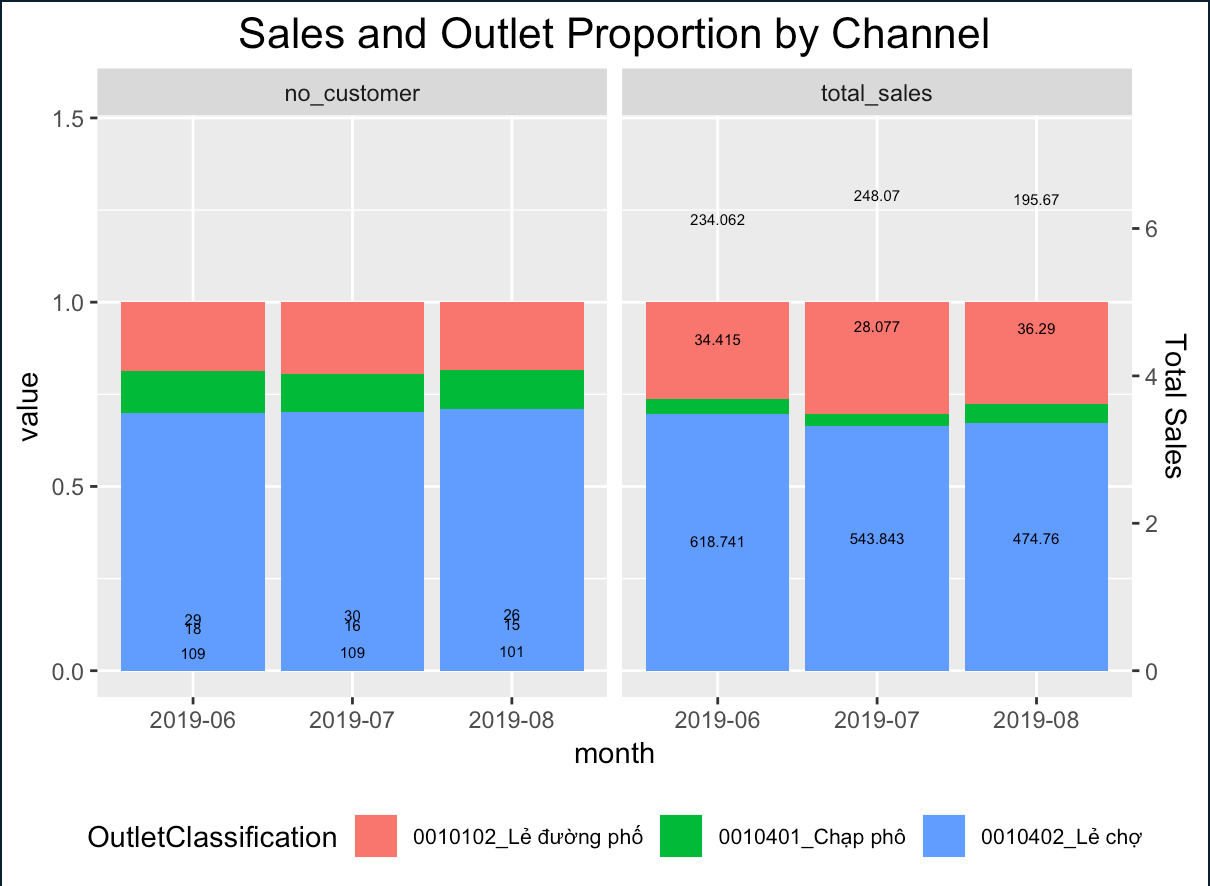
最近我在做一个项目的时候遇到了一个问题。简单地说,我需要绘制一个100%的堆叠条形图,用于2种不同的度量,即网点(客户)的数量和这些网点在3种分类中的销售情况。因此,我需要使用2y轴来分别说明这两个。但是,我想显示数据标签的绝对值,而不是相对百分比。由于这两个指标的值在不同的范围内,导致标签放置在一个错误的位置,这就说明了这一问题。
- 我使用facet_wrap将这两个指标分成两个方面进行说明。
- 通过使用position = "fill",我可以显示绝对值,而不是计算比率(介于0到1之间)。
- 使用position =position_stack( bar = 0.5)使我能够将数据标签对齐到条形图的中心。然而,它只对1项指标平稳地工作。
dt_4_slide1_long_test %>%
  ggplot(aes(x = month, y = value, fill = OutletClassification, label = value))+
  geom_bar(position = "fill",stat = "identity")+
  facet_wrap(~variable)+
  ggtitle("Sales and Outlet Proportion by Channel")+
  geom_text(aes(
              x = month,
              y = ave(value, month, FUN = function(x) (cumsum(x) - 0.5 * x) / sum(x)),
              label = value
            ),
            position = position_stack(vjust = 0.5),
            size = 2
            )+
  theme(plot.title = element_text(size = 16, hjust = 0.5, vjust = 1),
        legend.text = element_text(size=8),
        legend.position = "bottom")
因此,我的期望是,我可以显示2度量的绝对值,它与条形图的中心对齐。
下面是示例数据样本数据
或者,这些样本数据将有助于:
structure(list(month = c("2019-06", "2019-07", "2019-08", "2019-06",
"2019-07", "2019-08", "2019-06", "2019-07", "2019-08", "2019-06",
"2019-07", "2019-08", "2019-06", "2019-07", "2019-08", "2019-06",
"2019-07", "2019-08"), OutletClassification = c("0010102_Lẻ đường phố",
"0010102_Lẻ đường phố", "0010102_Lẻ đường phố",
"0010401_Chạp phô", "0010401_Chạp phô", "0010401_Chạp phô",
"0010402_Lẻ chợ", "0010402_Lẻ chợ", "0010402_Lẻ chợ",
"0010102_Lẻ đường phố", "0010102_Lẻ đường phố",
"0010102_Lẻ đường phố", "0010401_Chạp phô", "0010401_Chạp phô",
"0010401_Chạp phô", "0010402_Lẻ chợ", "0010402_Lẻ chợ",
"0010402_Lẻ chợ"), variable = structure(c(1L, 1L, 1L, 1L,
1L, 1L, 1L, 1L, 1L, 2L, 2L, 2L, 2L, 2L, 2L, 2L, 2L, 2L), .Label = c("no_customer",
"total_sales"), class = "factor"), value = c(29, 30, 26, 18,
16, 15, 109, 109, 101, 234.062, 248.07, 195.67, 34.415, 28.077,
36.29, 618.741, 543.843, 474.76)), row.names = c(NA, -18L), class = "data.frame")回答 1
Stack Overflow用户
回答已采纳
发布于 2019-09-06 12:21:53
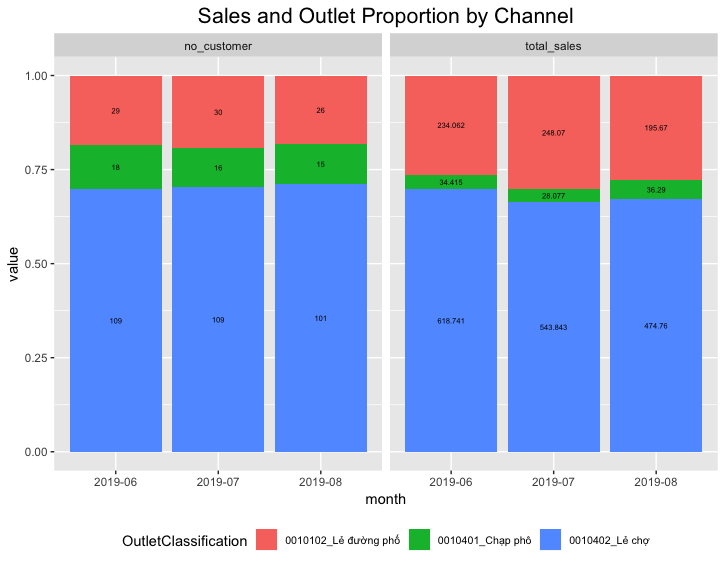
您可以使用position_fill(vjust = 0.5)。df是你发布的数据。
df %>%
  ggplot(aes(x = month, y = value, fill = OutletClassification, label = value)) +
  geom_bar(position = "fill",stat = "identity") +
  facet_wrap(~variable) +
  ggtitle("Sales and Outlet Proportion by Channel") +
  geom_text(position  = position_fill(vjust = 0.5), size = 2) +
  theme(plot.title = element_text(size = 16, hjust = 0.5, vjust = 1),
        legend.text = element_text(size=8),
        legend.position = "bottom")
页面原文内容由Stack Overflow提供。腾讯云小微IT领域专用引擎提供翻译支持
原文链接:
https://stackoverflow.com/questions/57820113
复制相关文章
相似问题
腾讯云开发者

Copyright © 2013 - 2026 Tencent Cloud. All Rights Reserved. 腾讯云 版权所有
深圳市腾讯计算机系统有限公司 ICP备案/许可证号:粤B2-20090059 ![]() 粤公网安备44030502008569号
粤公网安备44030502008569号
腾讯云计算(北京)有限责任公司 京ICP证150476号 | 京ICP备11018762号