背景
腾讯云数据开发治理平台 WeData 数据质量支持自定义模板创建和批量管理,帮助您根据业务场景定制化表质量检测逻辑。本文将为您介绍如何通过自定义模板页面新建规则模板、并根据自定义规则模板在数据监控页面对表创建检测规则。
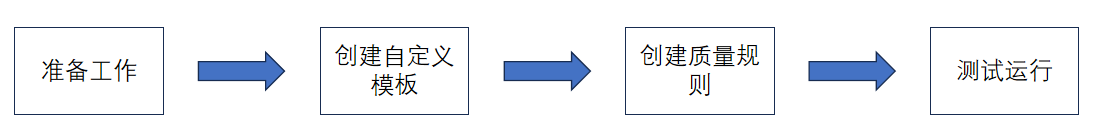
操作流程
步骤一 准备工作
1. 创建用户及项目
2. 在 WeData 产品内需要首先创建用户及项目,详情操作指引请查看 准备工作。
3. 创建调度资源组
4. 运行质量检测任务需要创建调度资源组,详情操作指引请查看 调度资源组。
步骤二 创建自定义模板
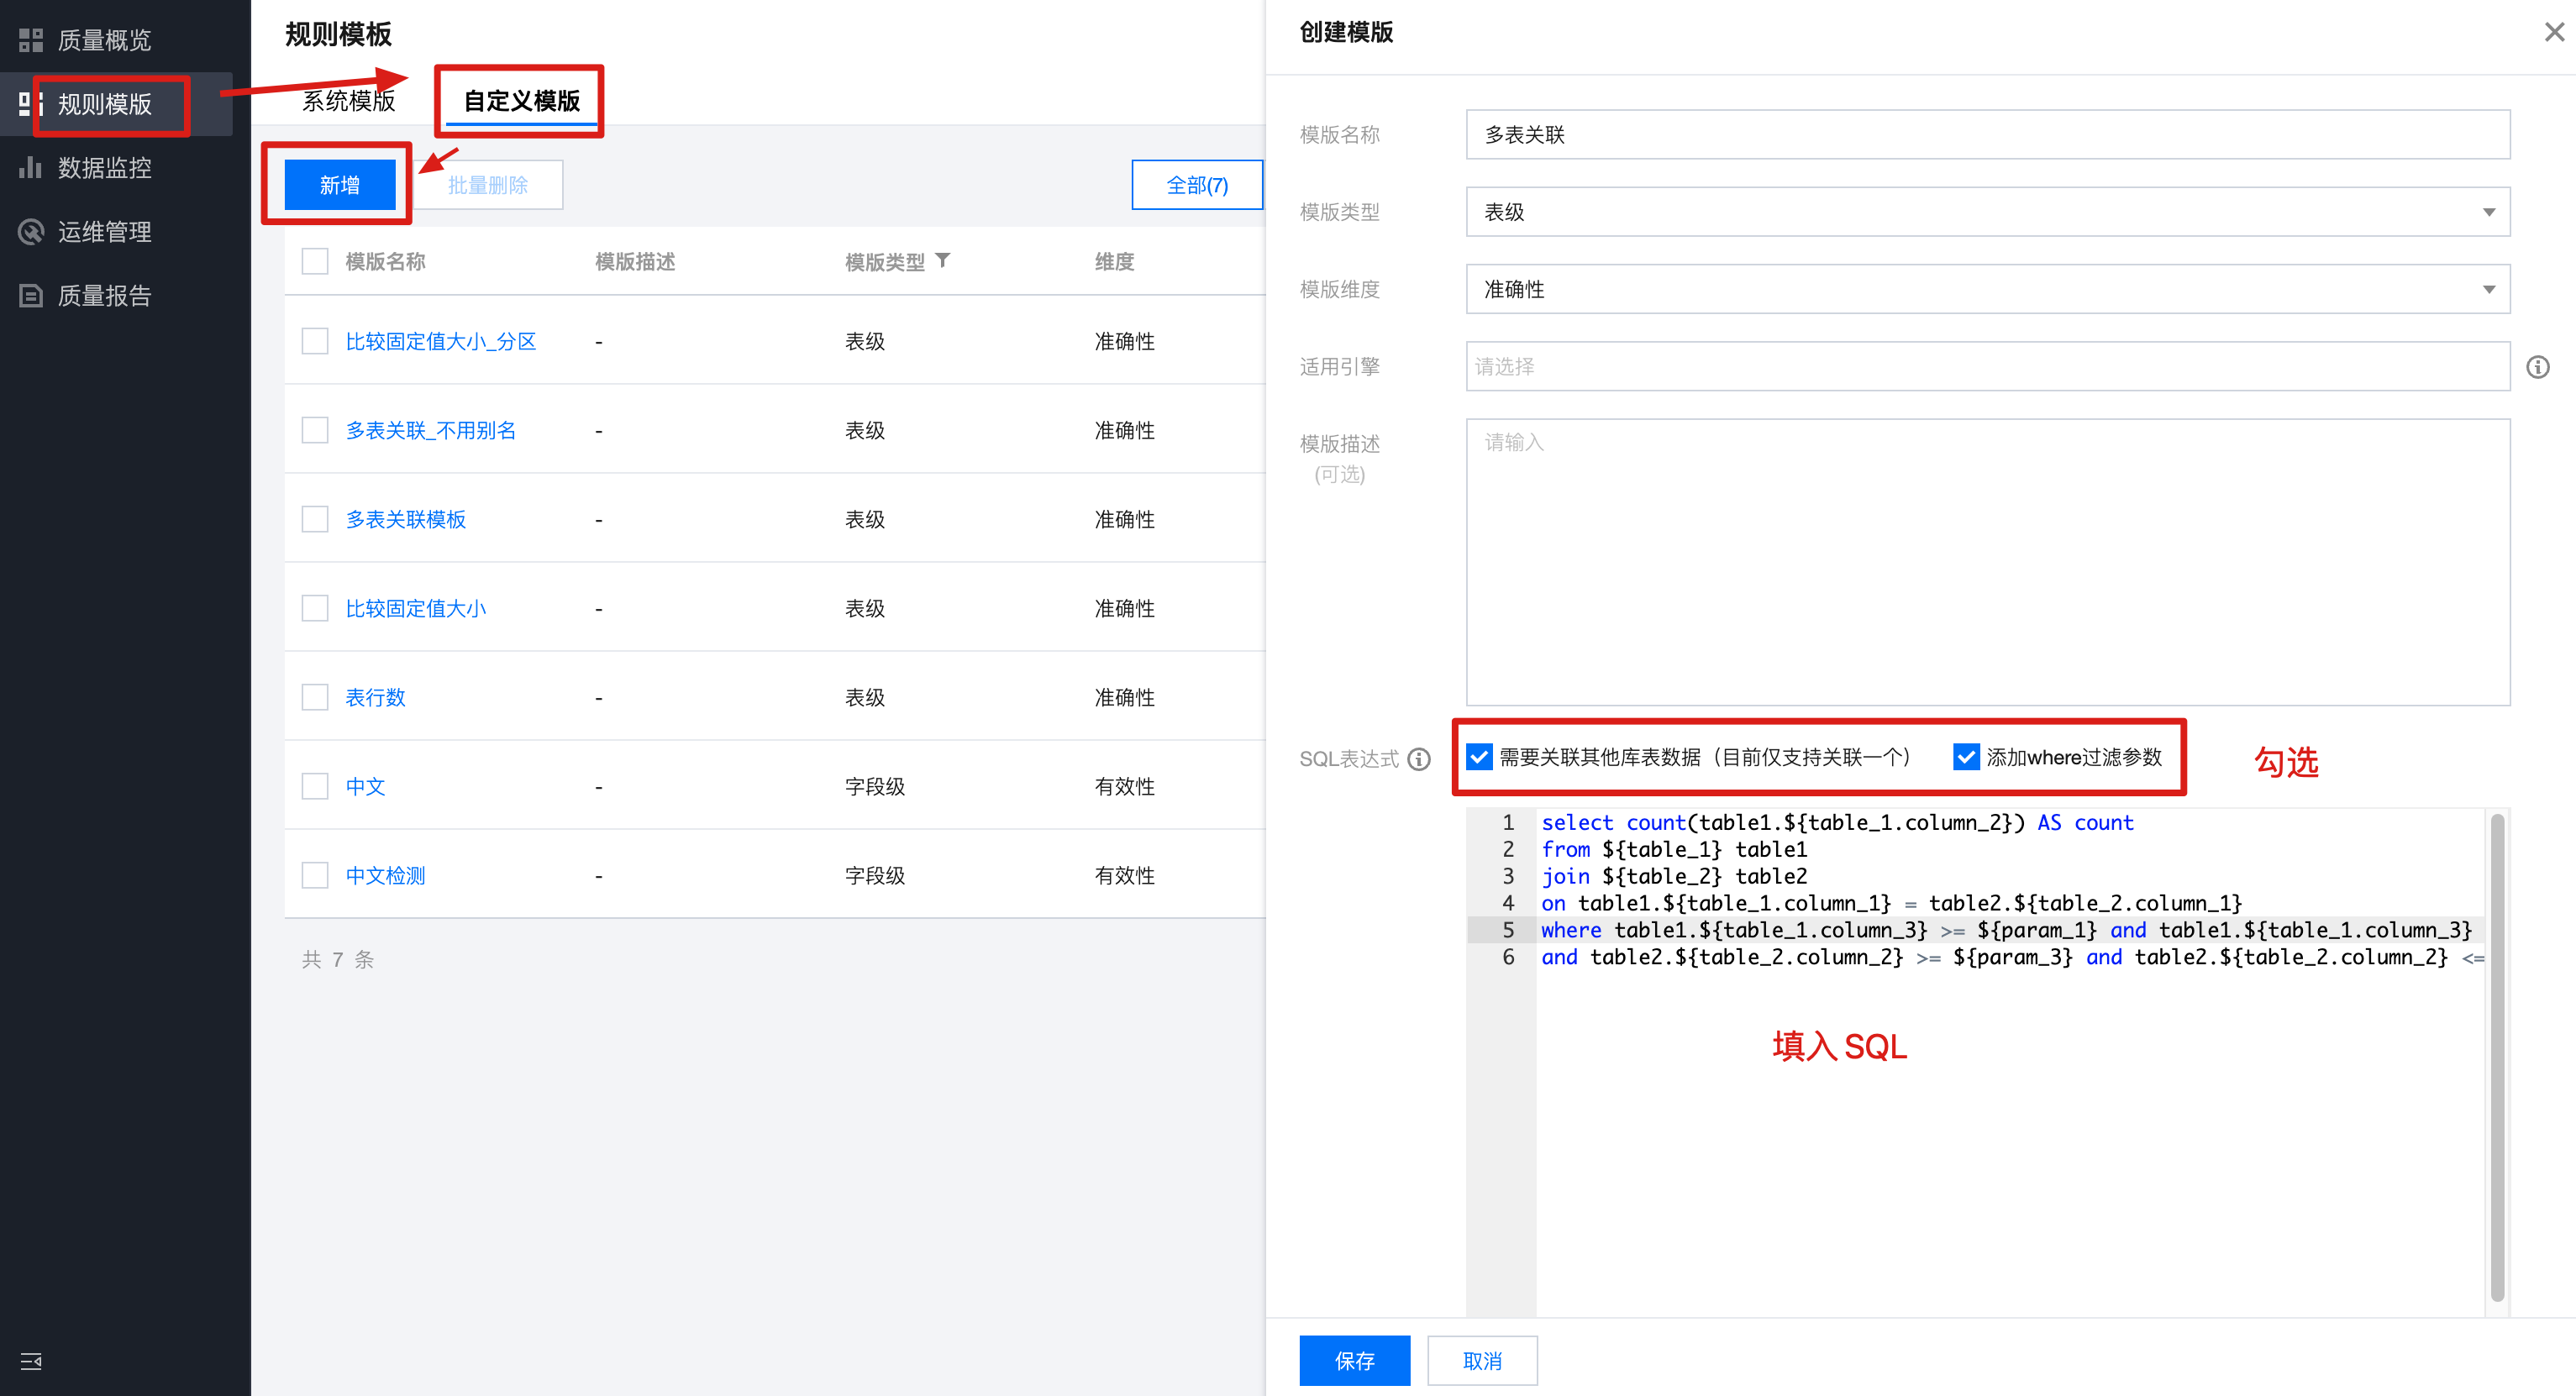
1. 进入数据质量 > 规则模板,单击自定义模板,新增模板并保存。
SQL 表达式:
select count(table1.${table_1.column_2}) AS countfrom ${table_1} table1join ${table_2} table2on table1.${table_1.column_1} = table2.${table_2.column_1}where table1.${table_1.column_3} >= ${param_1} and table1.${table_1.column_3} <= ${param_2}and table2.${table_2.column_2} >= ${param_3} and table2.${table_2.column_2} <= ${param_4};
解释说明:
上文中一共出现了两张表:${table_1} 和 ${table_2},
${table_1} 表示监控规则扫描的主表;
${table_2} 表示同数据源同数据库下的其他表(实际使用时也可以选择主表自己);
使用了表1四个字段,分别为:
${table_1.column_1}:用于与表2关联;
${table_1.column_2}:用于结果计数;
${table_1.column_3}:用于过滤条件,大于等于参数1,小于等于参数2;
使用了表2两个字段,分别为:
${table_2.column_1}:用于与表1关联;
${table_2.column_2}:用于过滤条件,大于等于参数3,小于等于参数4;
使用了4个 where 参数,分别为:
${param_1}:SQL 中表1字段3的最小值;
${param_2}:SQL 中表1字段3的最大值;
${param_3}:SQL 中表2字段2的最小值;
${param_4}:SQL 中表2字段2的最大值。
最终计算结果:符合条件的表1字段2的个数,为一个数值。
截图示例:
步骤三 创建质量规则
1. 进入数据监控,找到需要监控的表,单击配置监控任务。
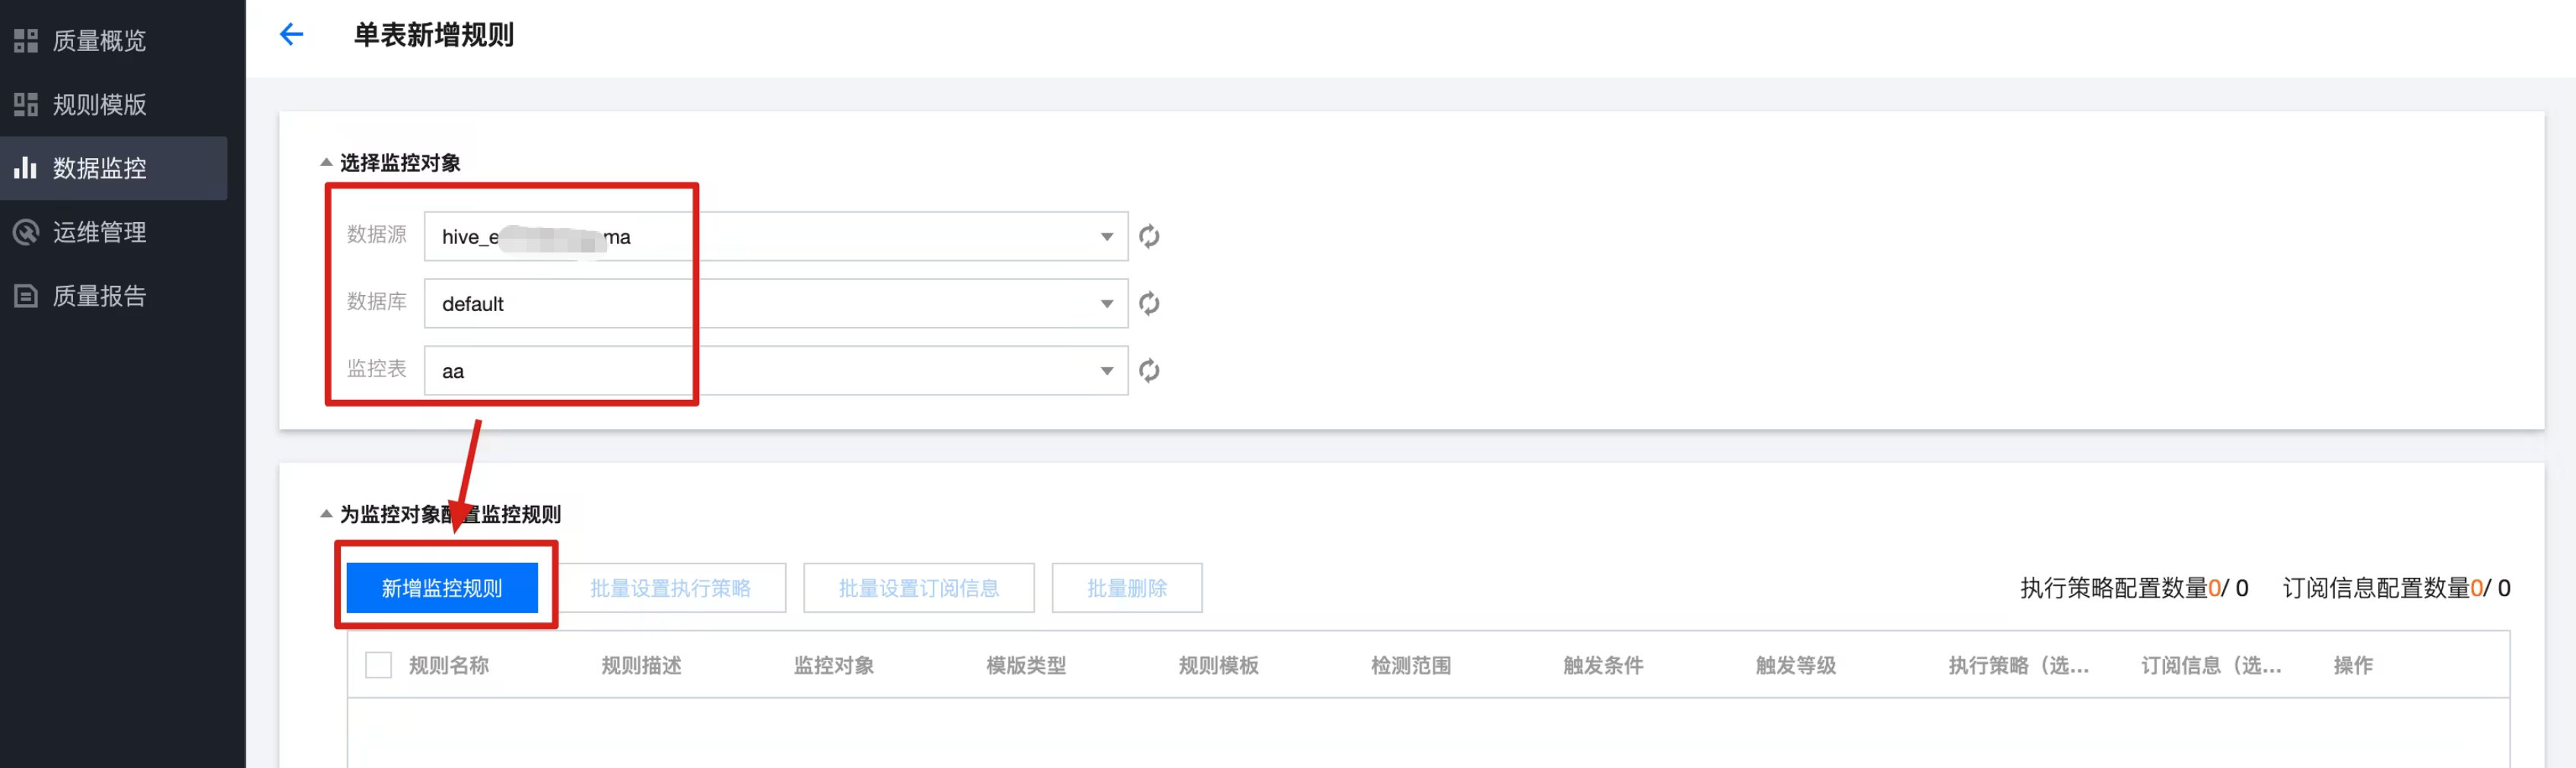
2. 单击新增规则,规则类型选择自定义模板,选中刚创建的模板,根据模板变量选择库表参数及 where 参数,配置好触发条件及等级,单击保存。
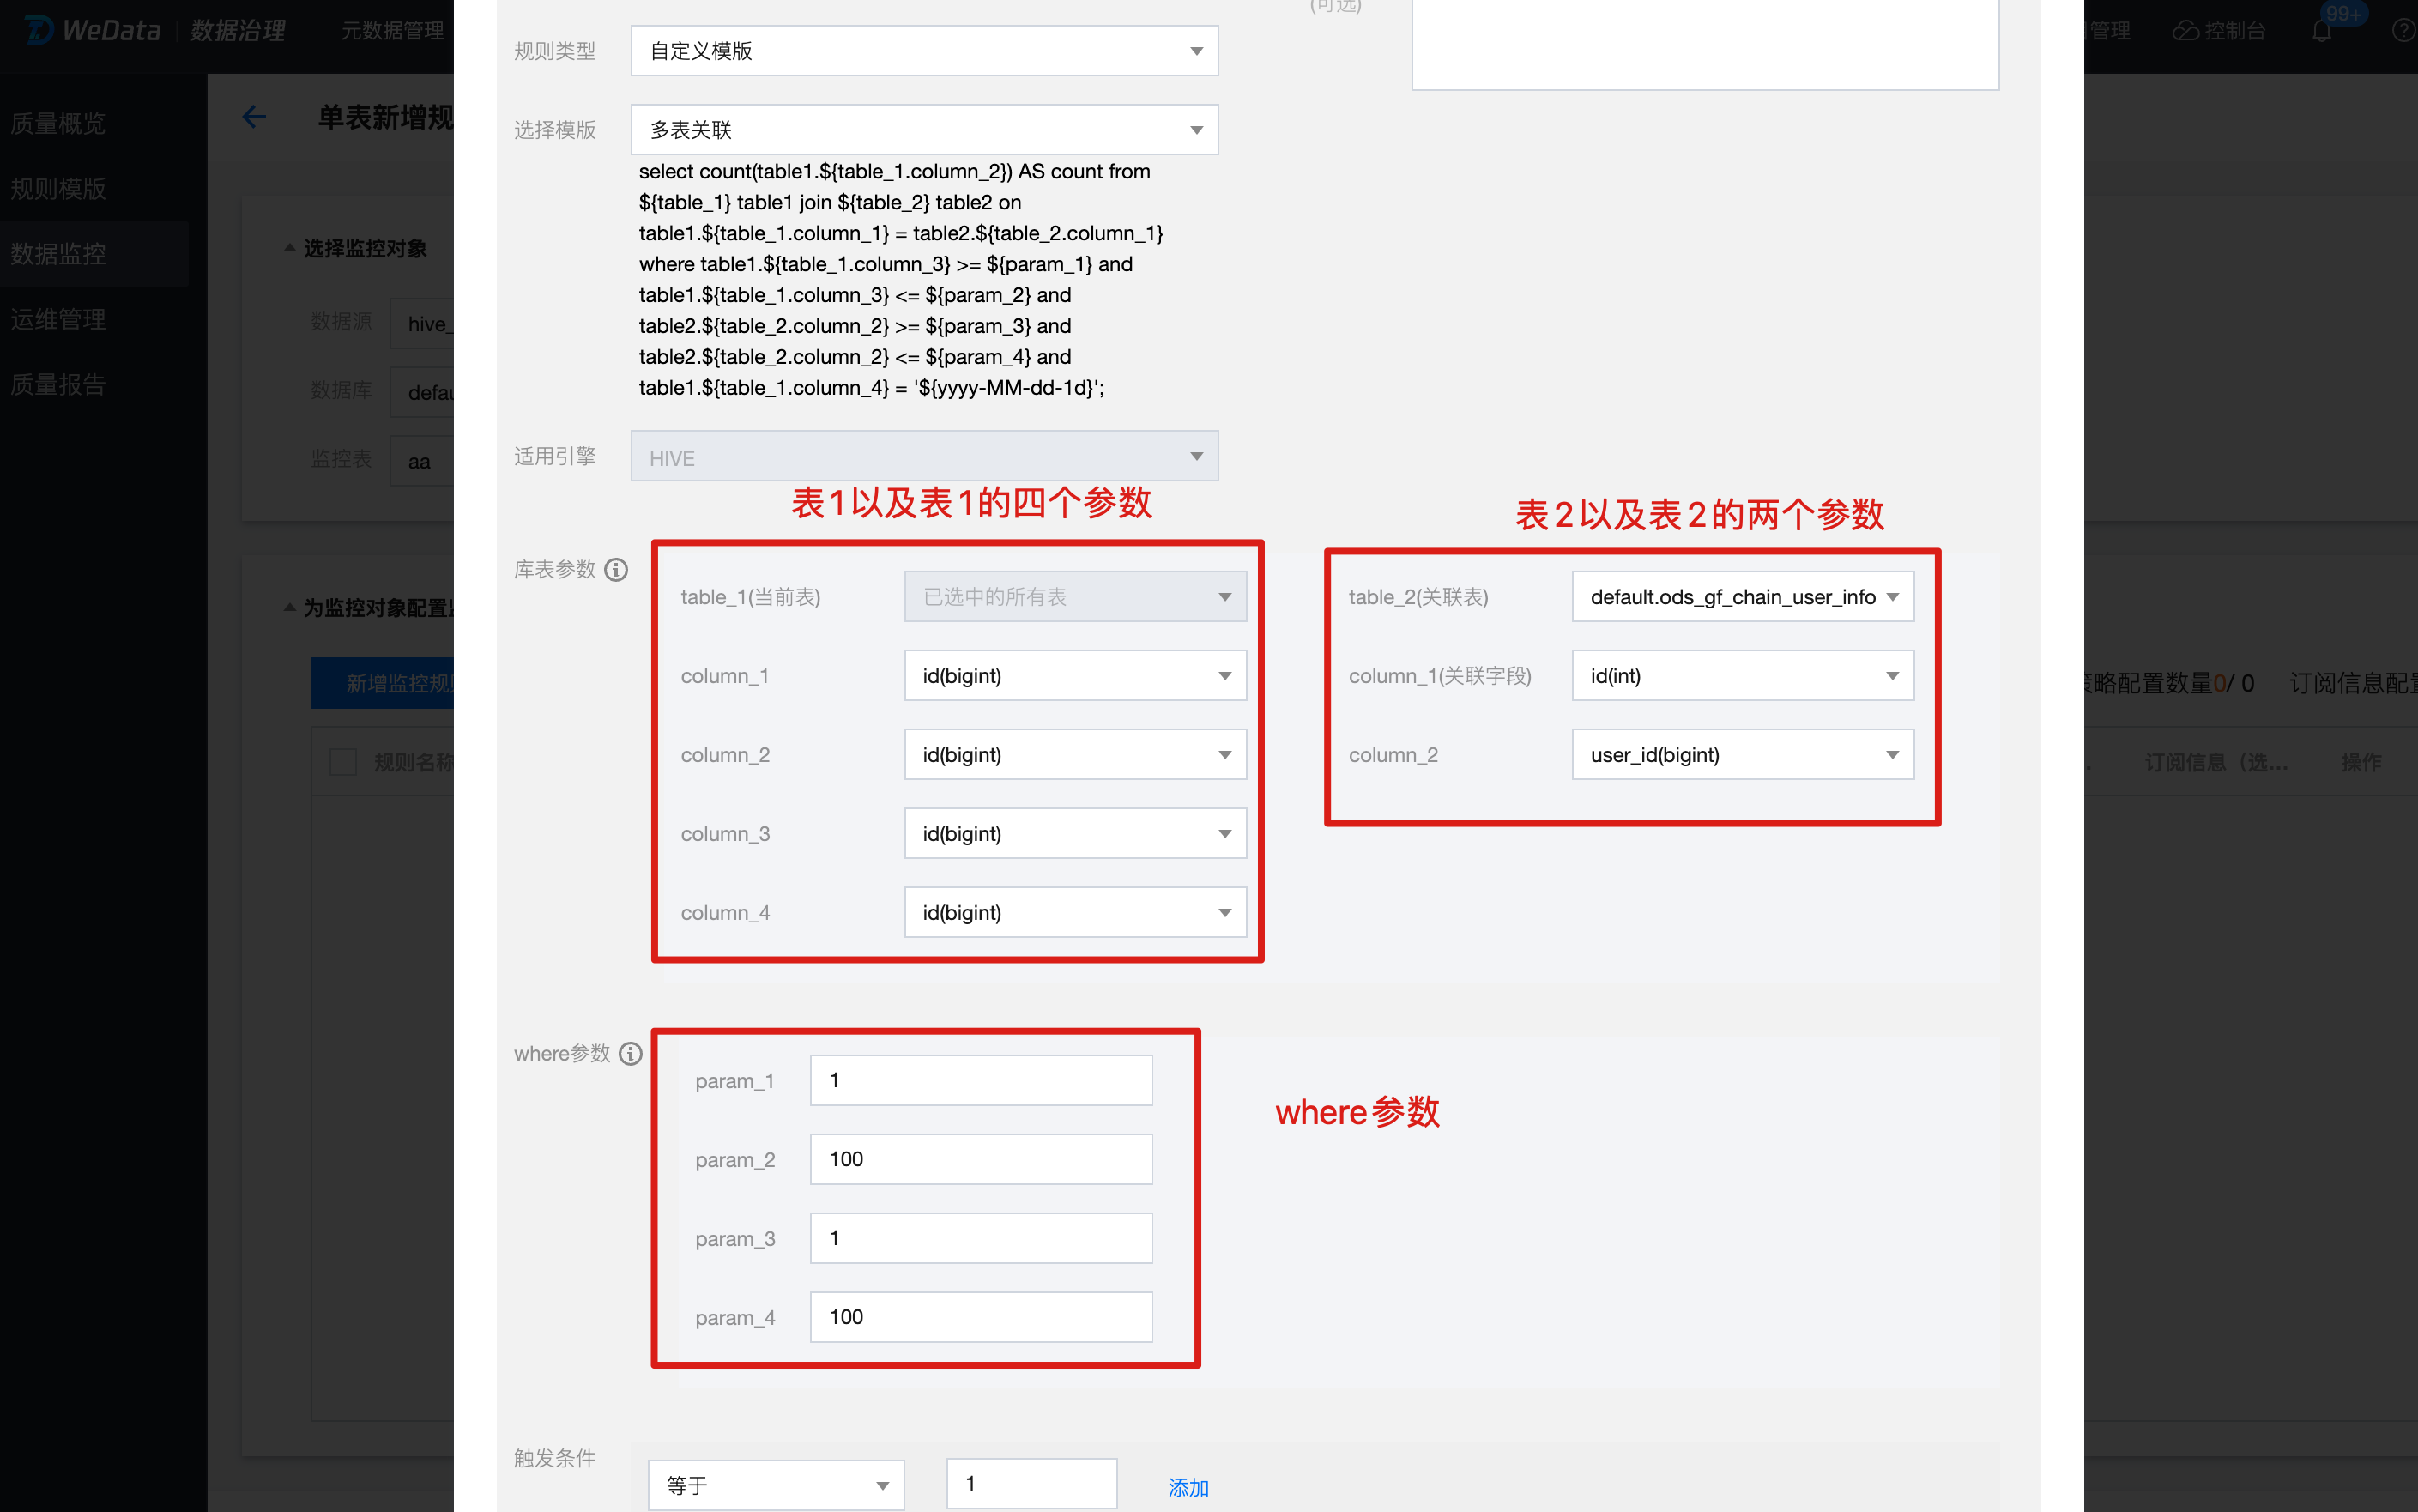
注意:
使用自定义模板前请先分析每个字段是什么含义,再进行映射。
步骤四 测试运行
1. 单击试运行,选择执行引擎、计算资源、执行资源,在验证规则中选择刚创建的规则。
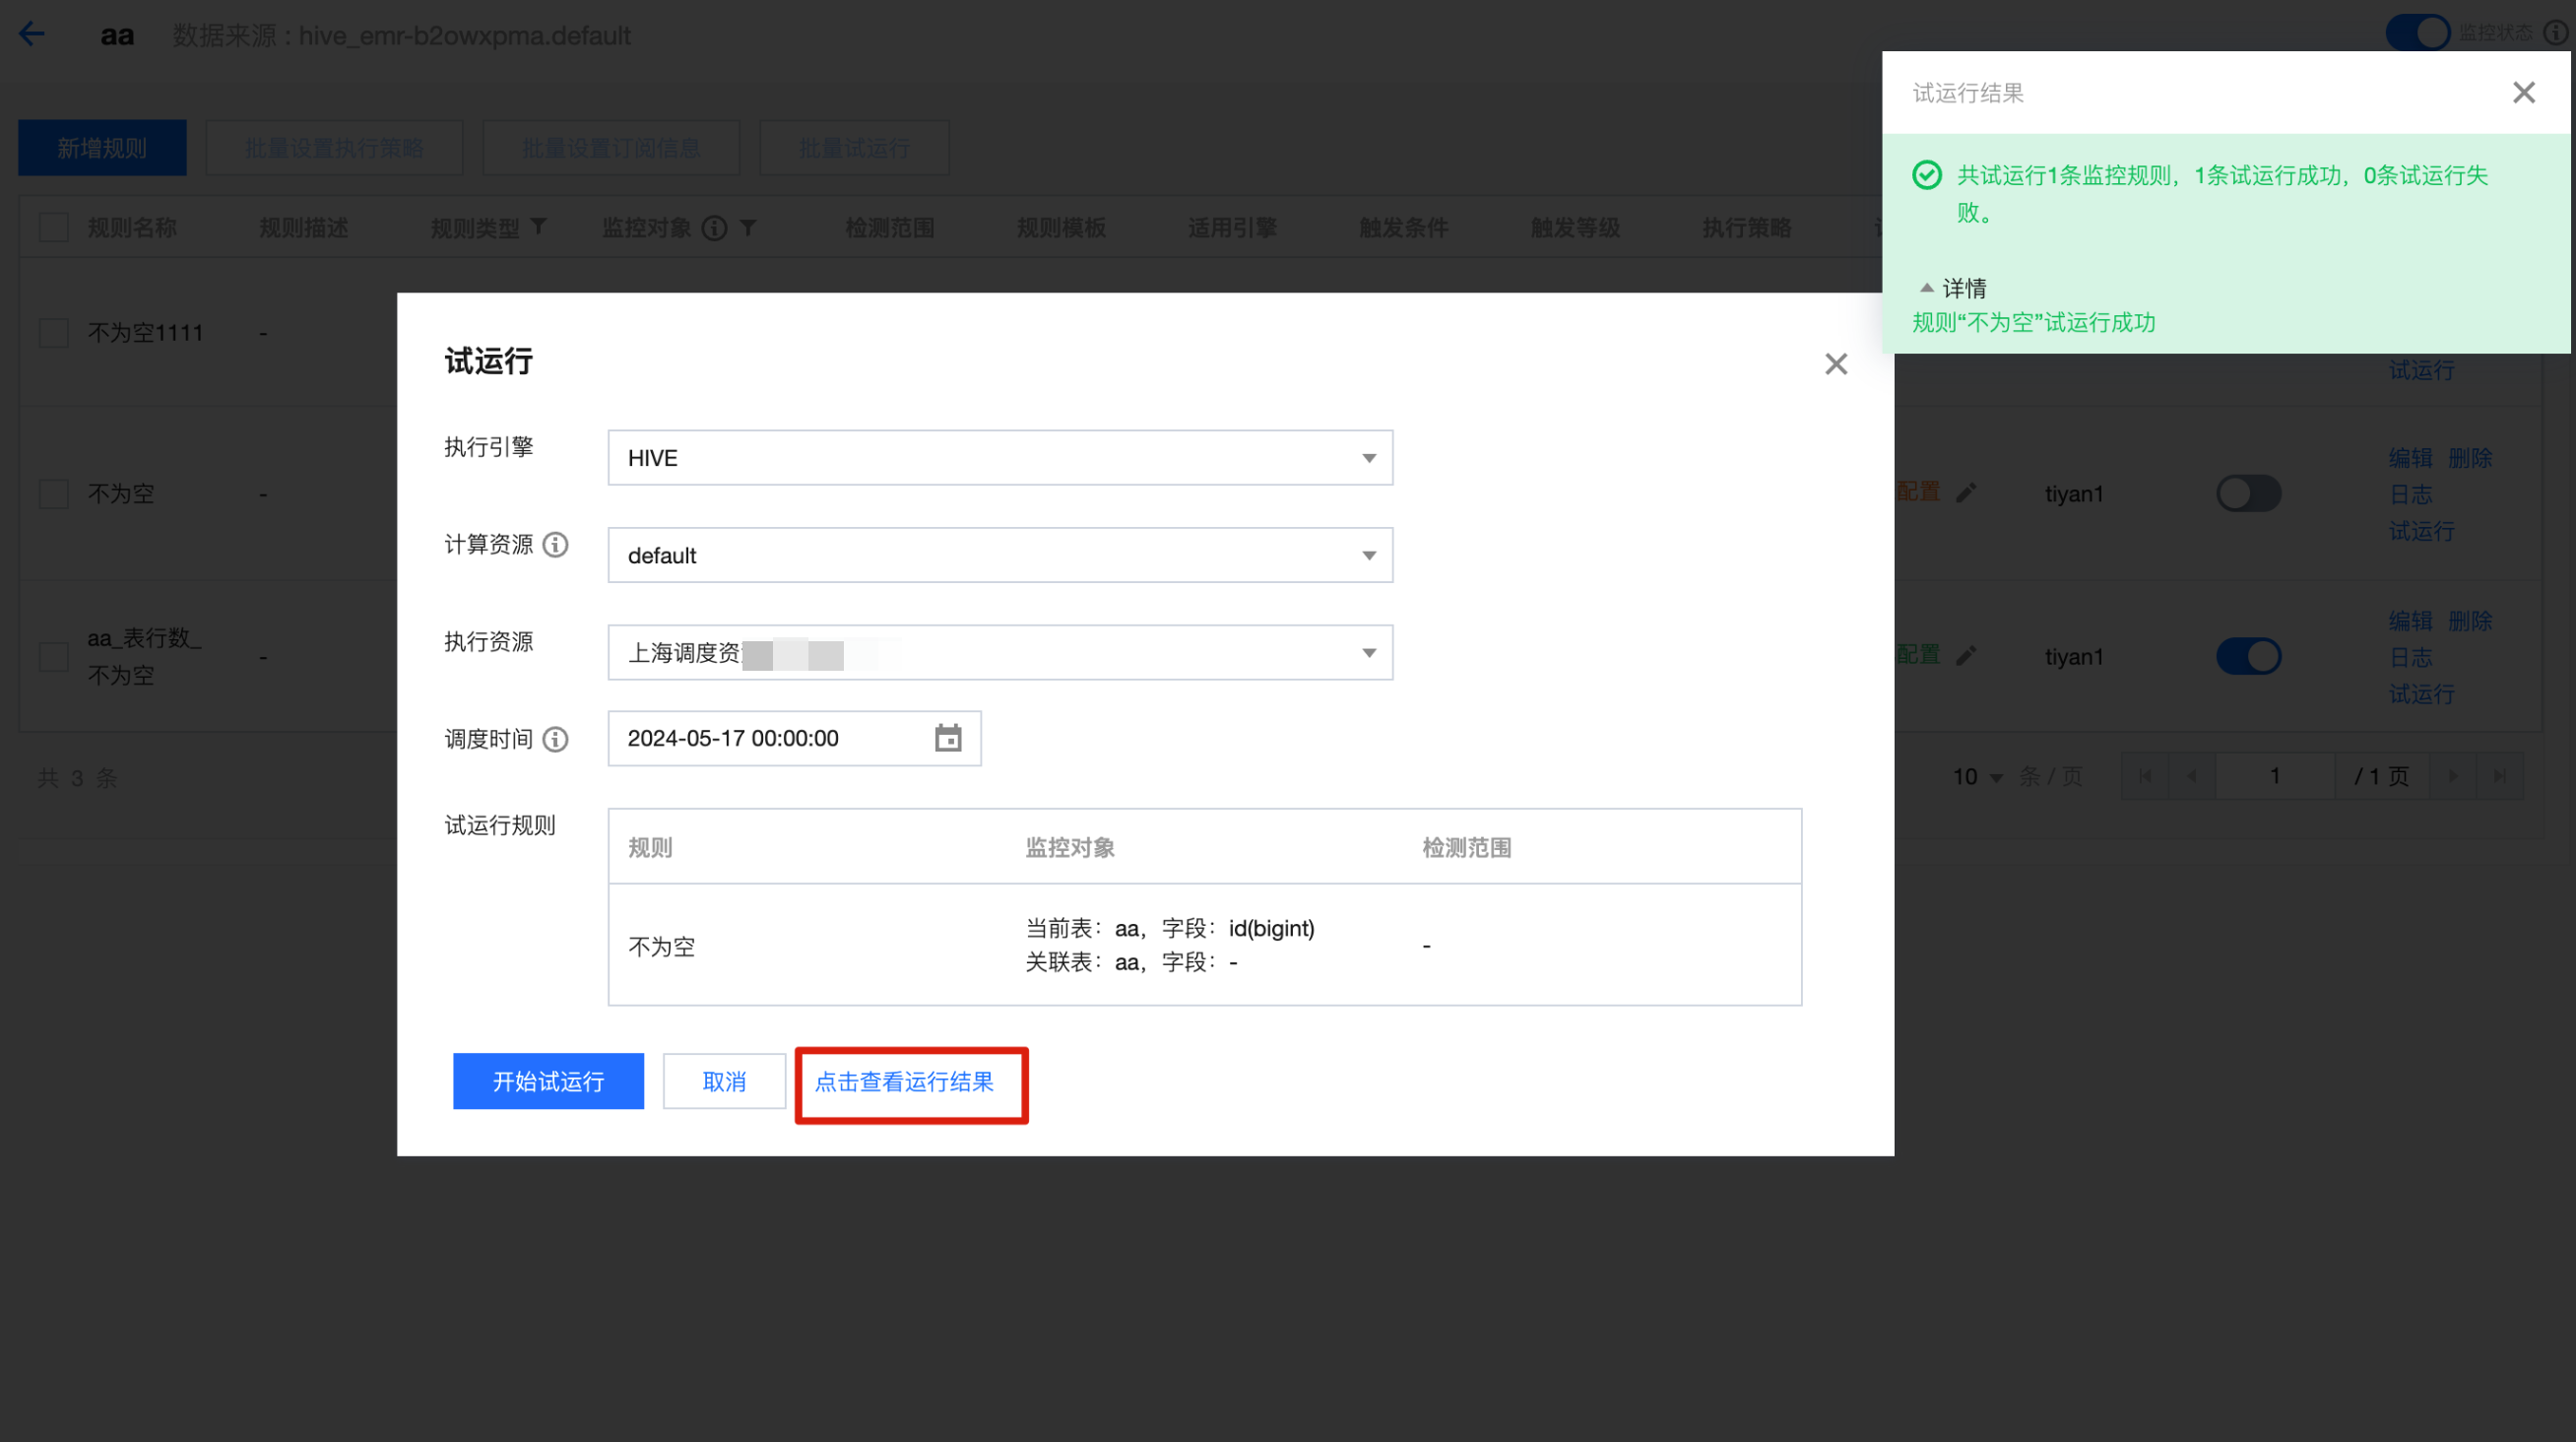
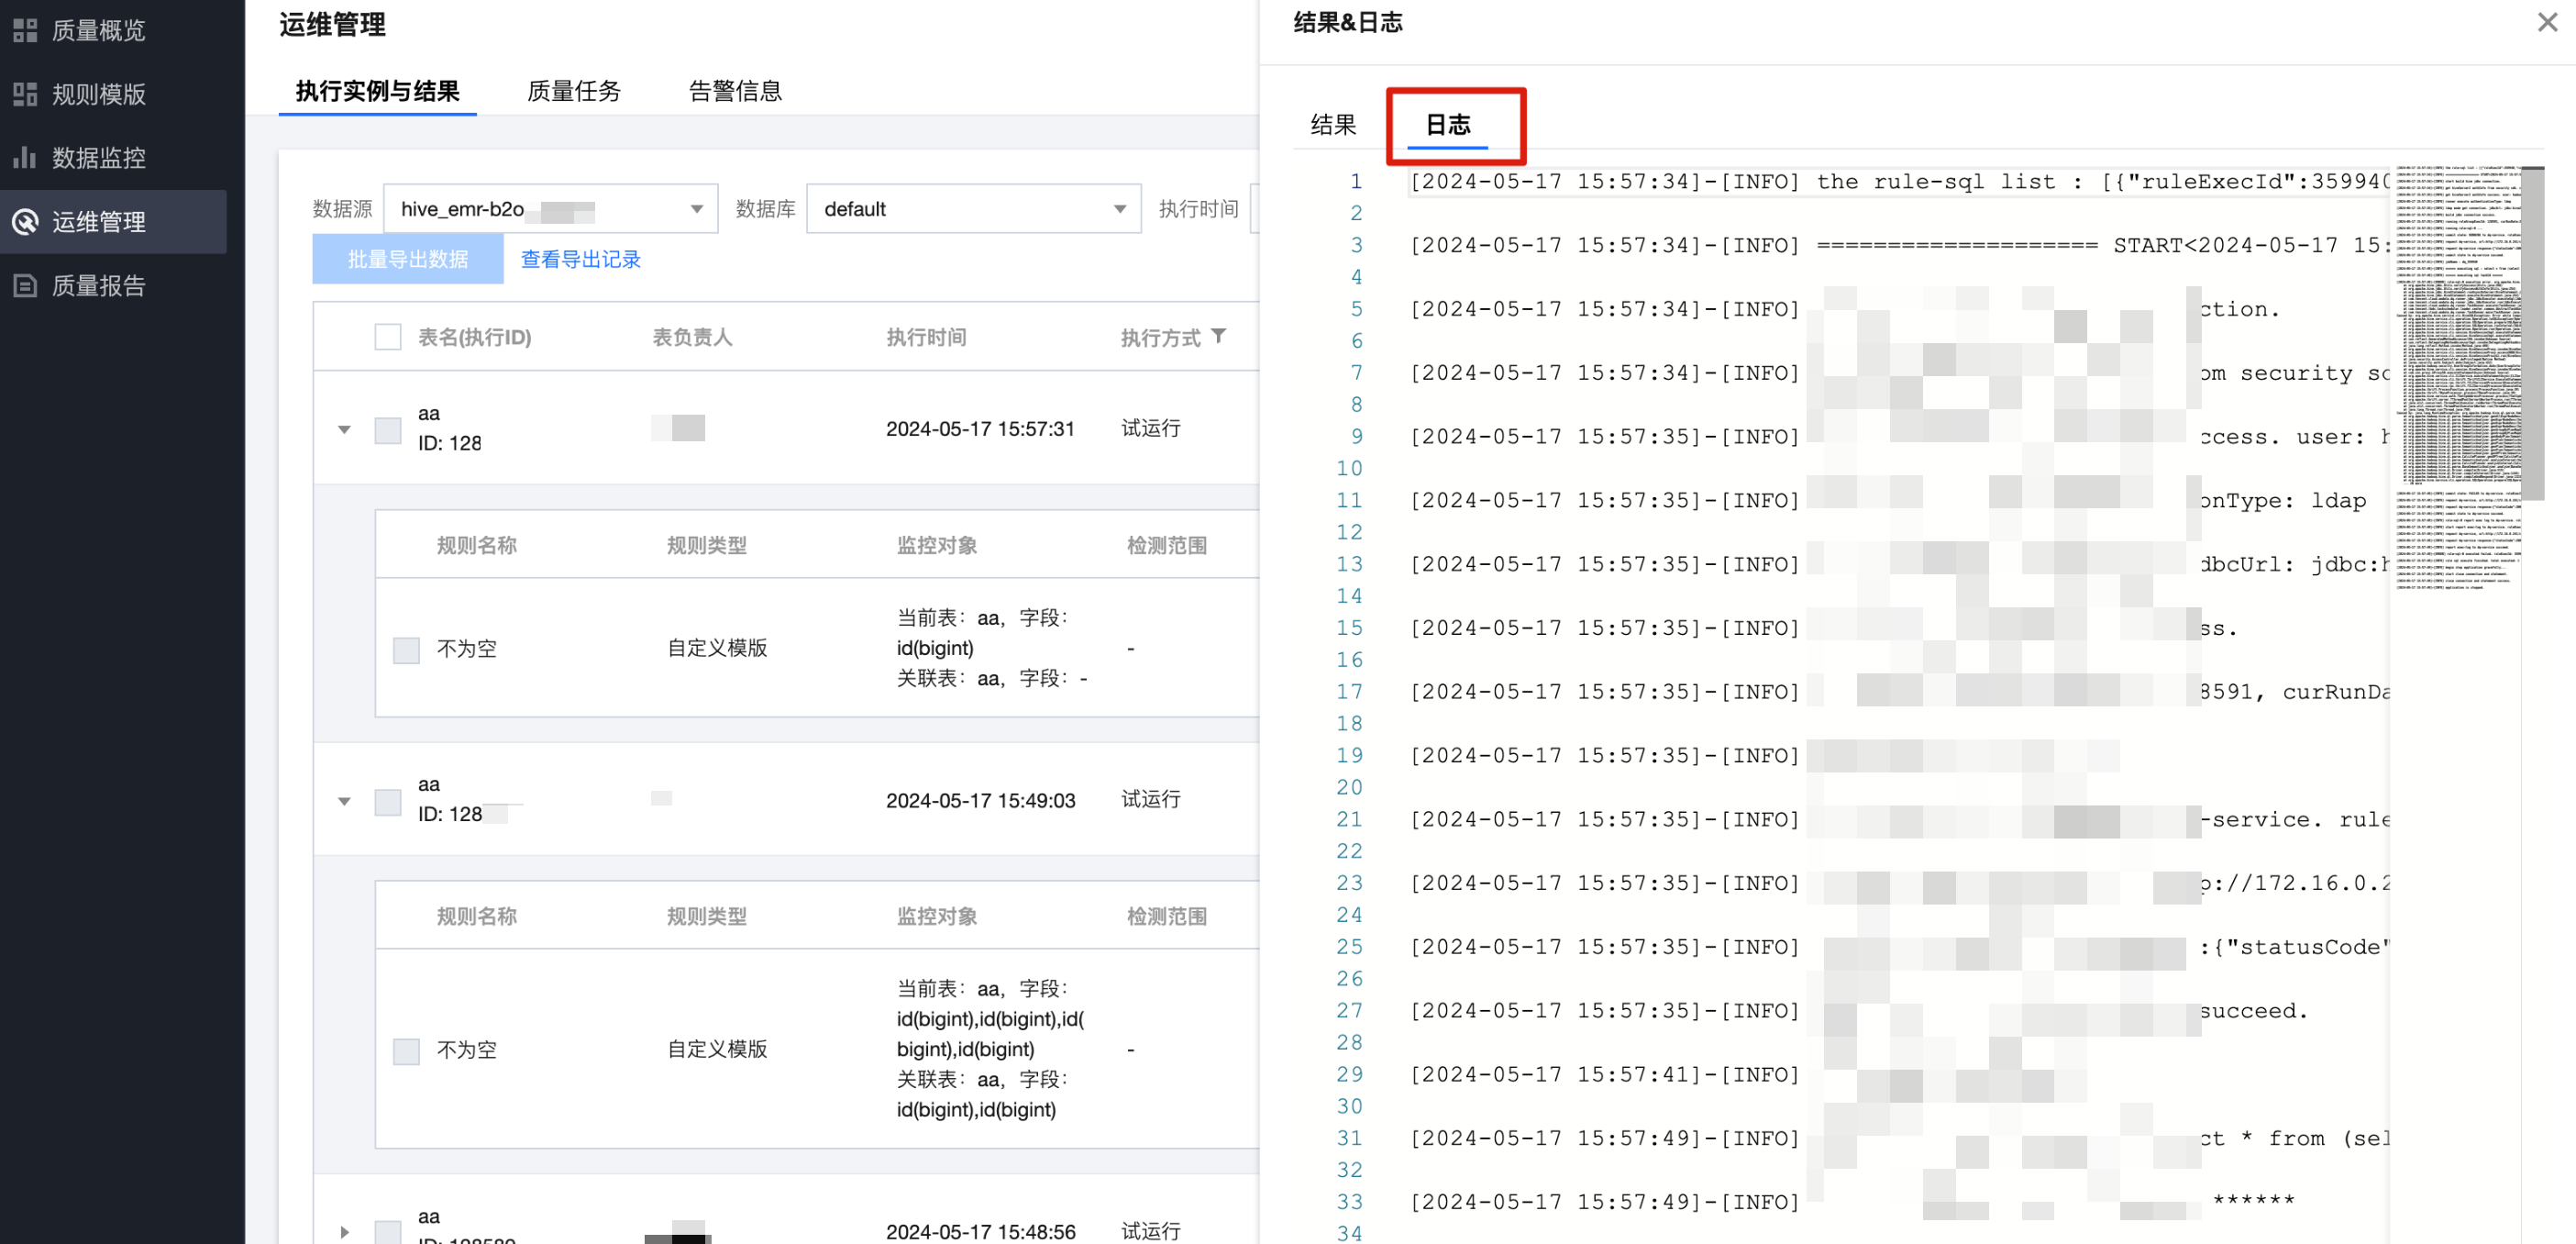
2. 单击查看运行结果,跳转到运维管理页面查看运行结果。
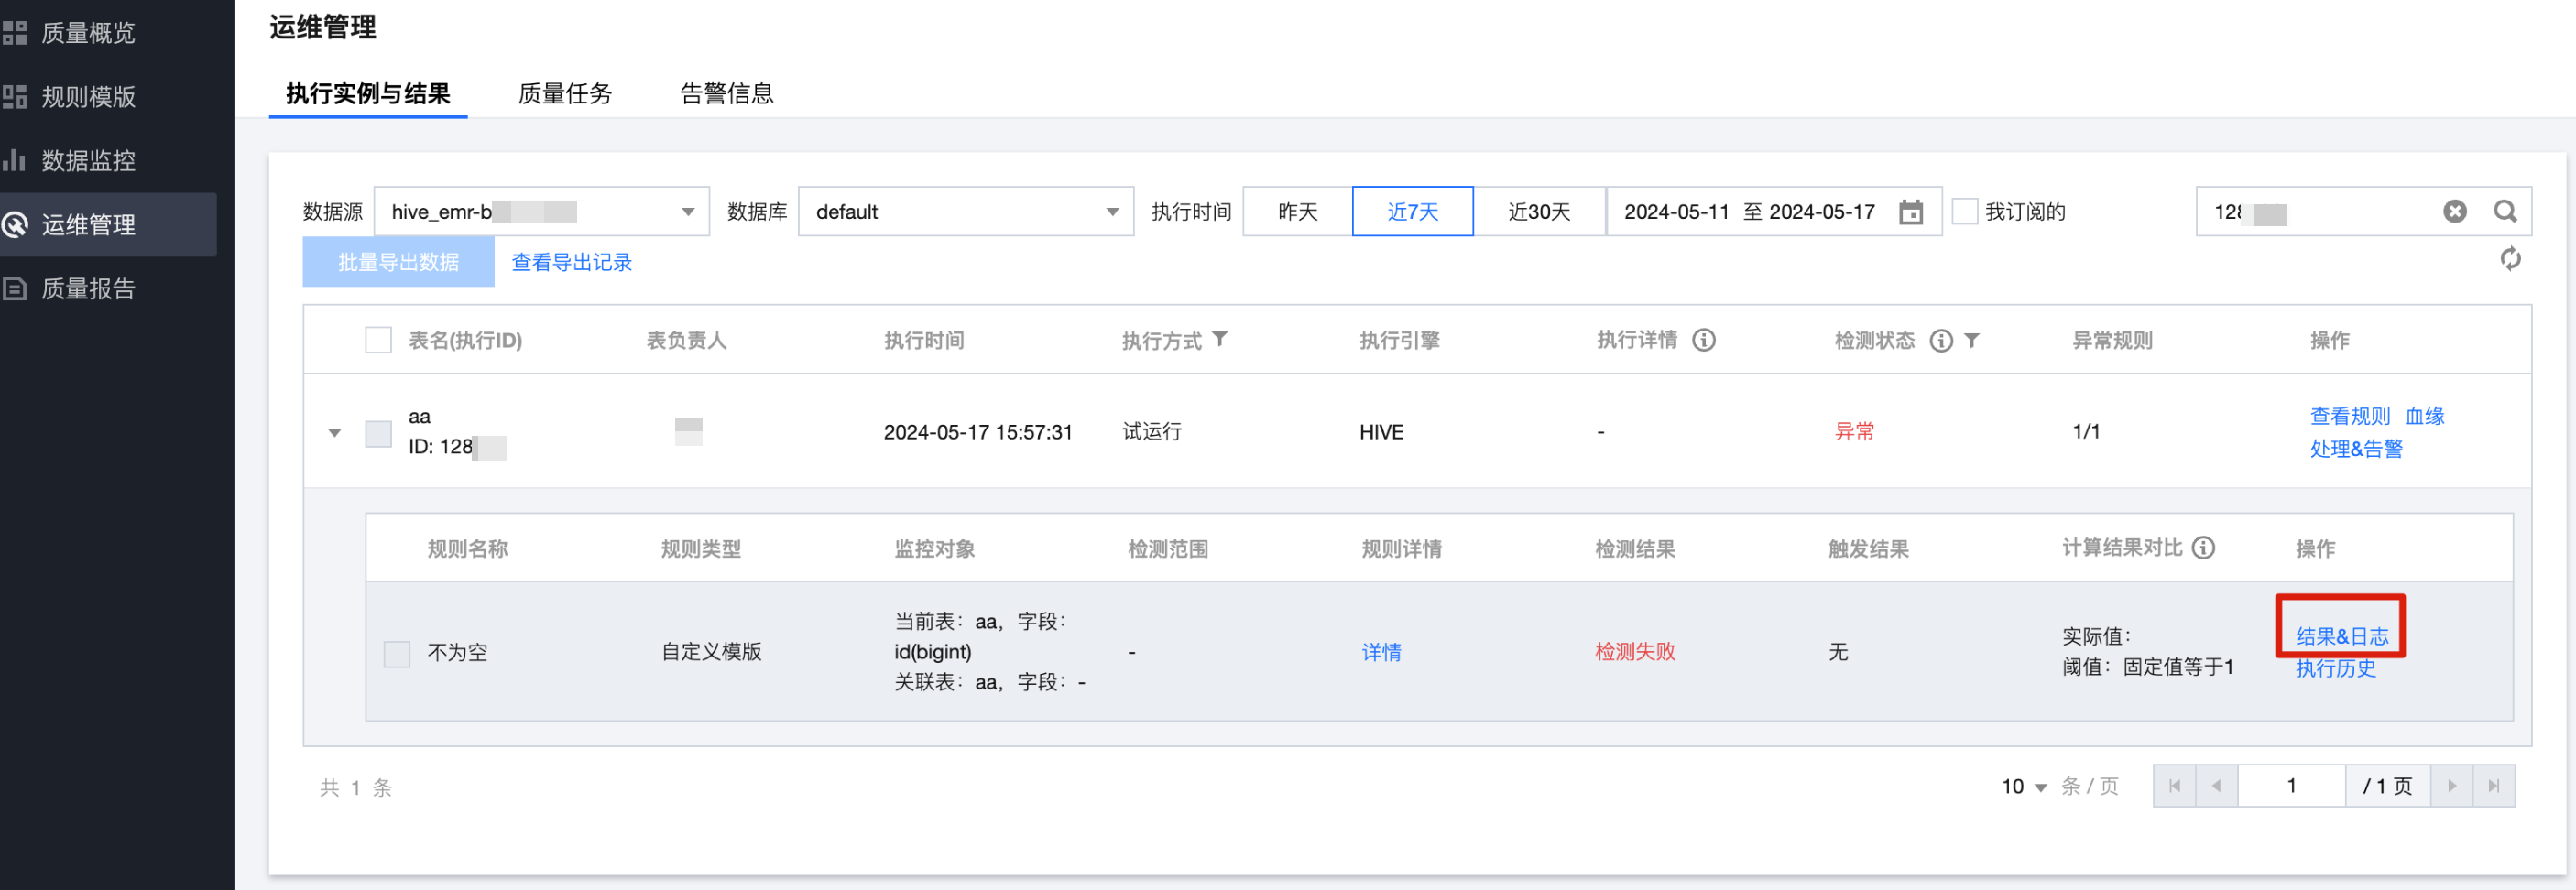
3. 单击结果&日志,查看运行日志。
其中 EXECUTING SQL : xxxxxx,打印的是提交给 hive/spark/dlc 引擎进行质量检测 SQL。