搭建数仓
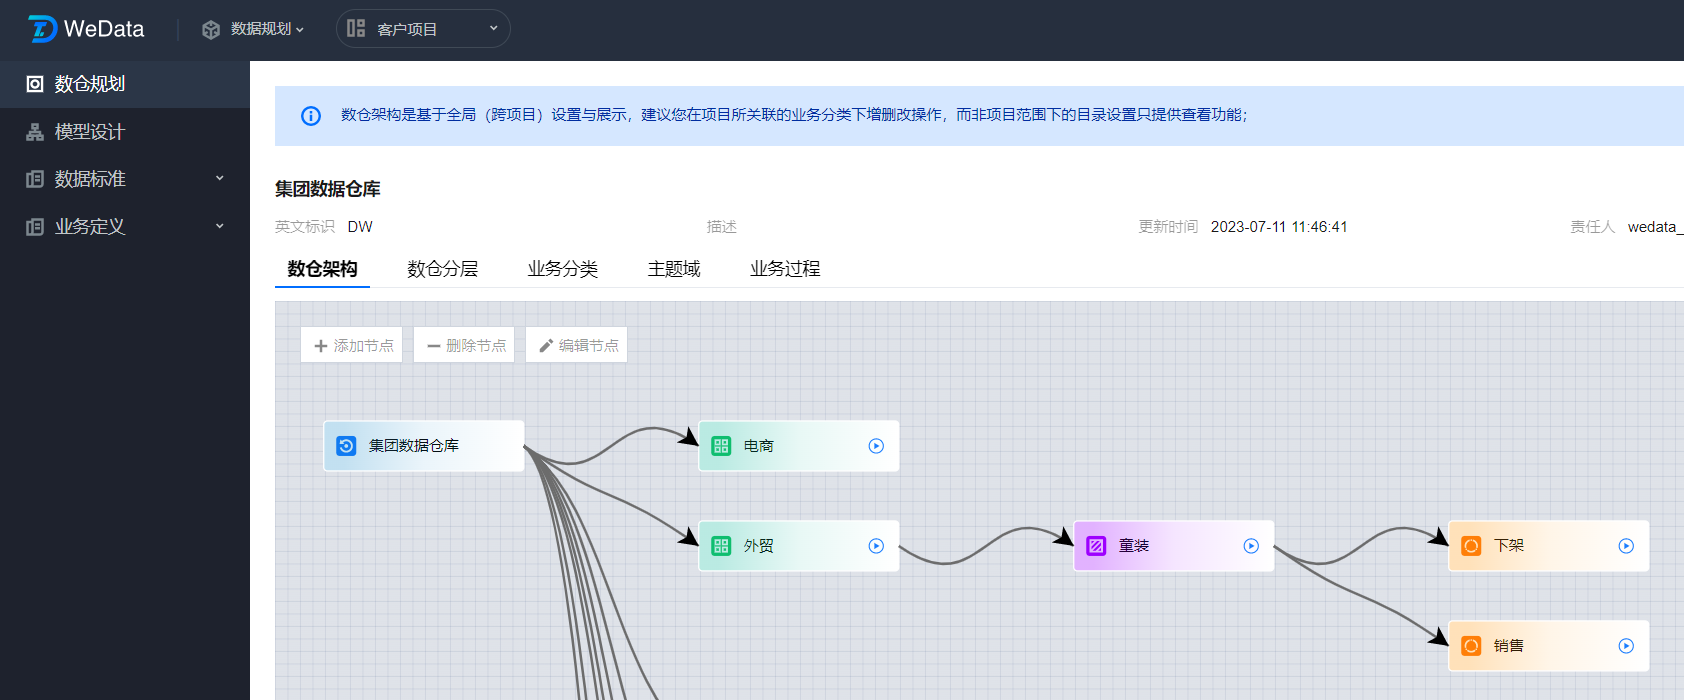
业务调研会按照业务和数据维度进行数据仓库的框架搭建,基于分层分类分域思想进行抽象定义:
数据层级定义包括 ods、dwd、dws 和 ads、dim 层等,通过定义逻辑分层和物理库进行关联映射。
业务类型定义包括业务分类、主题域、业务过程,对数据对象进行自定义业务目录管理。
定义后数仓架构会自动生成,后续模型指标维度的业务定义过程,将依托整体的数仓架构进行定义管理。
模型设计
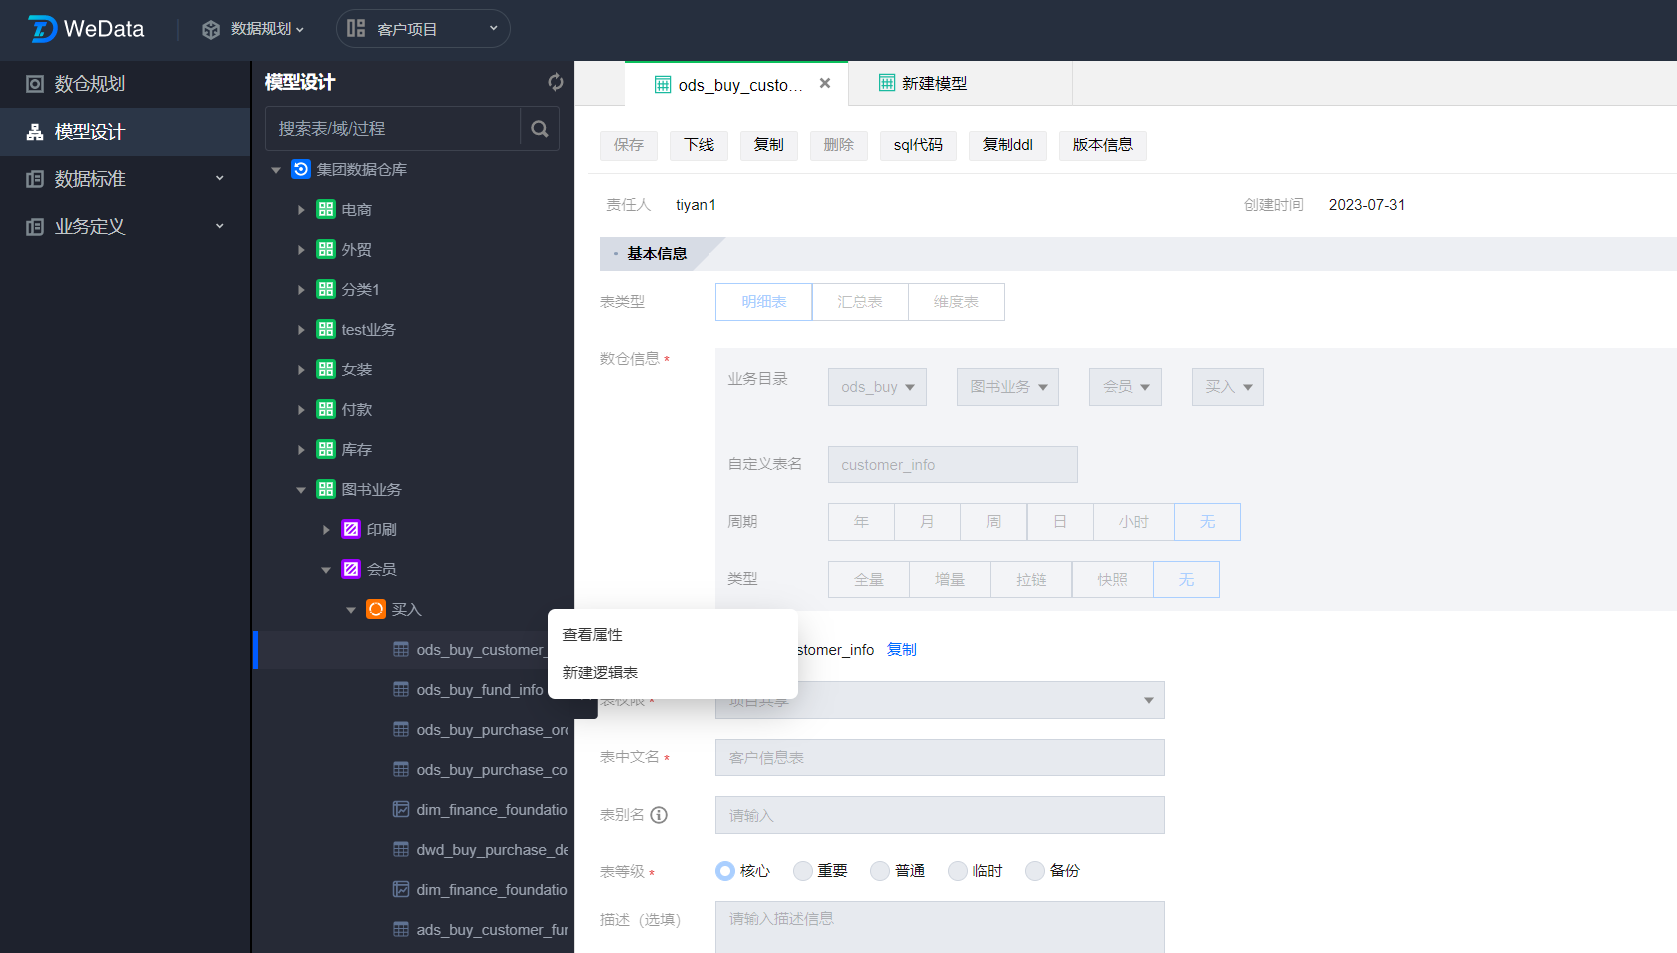
搭建好数仓后,设计者会基于数据特征、业务场景对业务实体--逻辑模型—物理模型的定义,其中逻辑表定义时,首先会根据数仓架构进行标准化命名,同时字段配置环节可以绑定元数据、值域标准,从而完成标准化定义过程;
模型设计过程会同时从数据驱动(自底向上)、业务驱动(自顶向下)两个维度设计:
1. 数据驱动维度,设计者首先需要从生产源系统进行原始数据同步至接口层,接口层原始数据经过清洗转换后会形成明细表,明细表也叫事实表,用于保存最细粒度清单数据,明细表也是指标统计的来源表,其字段会关联绑定基础指标、维度条件。
2. 从业务驱动需要根据业务场景设计出汇总层和集市层,其中通过定义汇总表保存不同维度条件下汇总计算后的指标数据,该表会作为衍生指标的目标表进行1对1绑定。
3. 定义的分析维度会形成维度表,用于保存维度的属性层级数据,该表会和普通维度1对1绑定,也可以在维度定义时自动生成。
完成逻辑模型设计后,可通过发布动作生成物理模型,从而实现设计到开发过程的串接;若前期已经创建了部分物理模型,也可以逆向导入反向生成逻辑模型,实现设计过程的补齐。
业务定义
在进行业务调研过程中,设计者需要根据业务场景抽象定义出指标和维度:
1. 指标定义
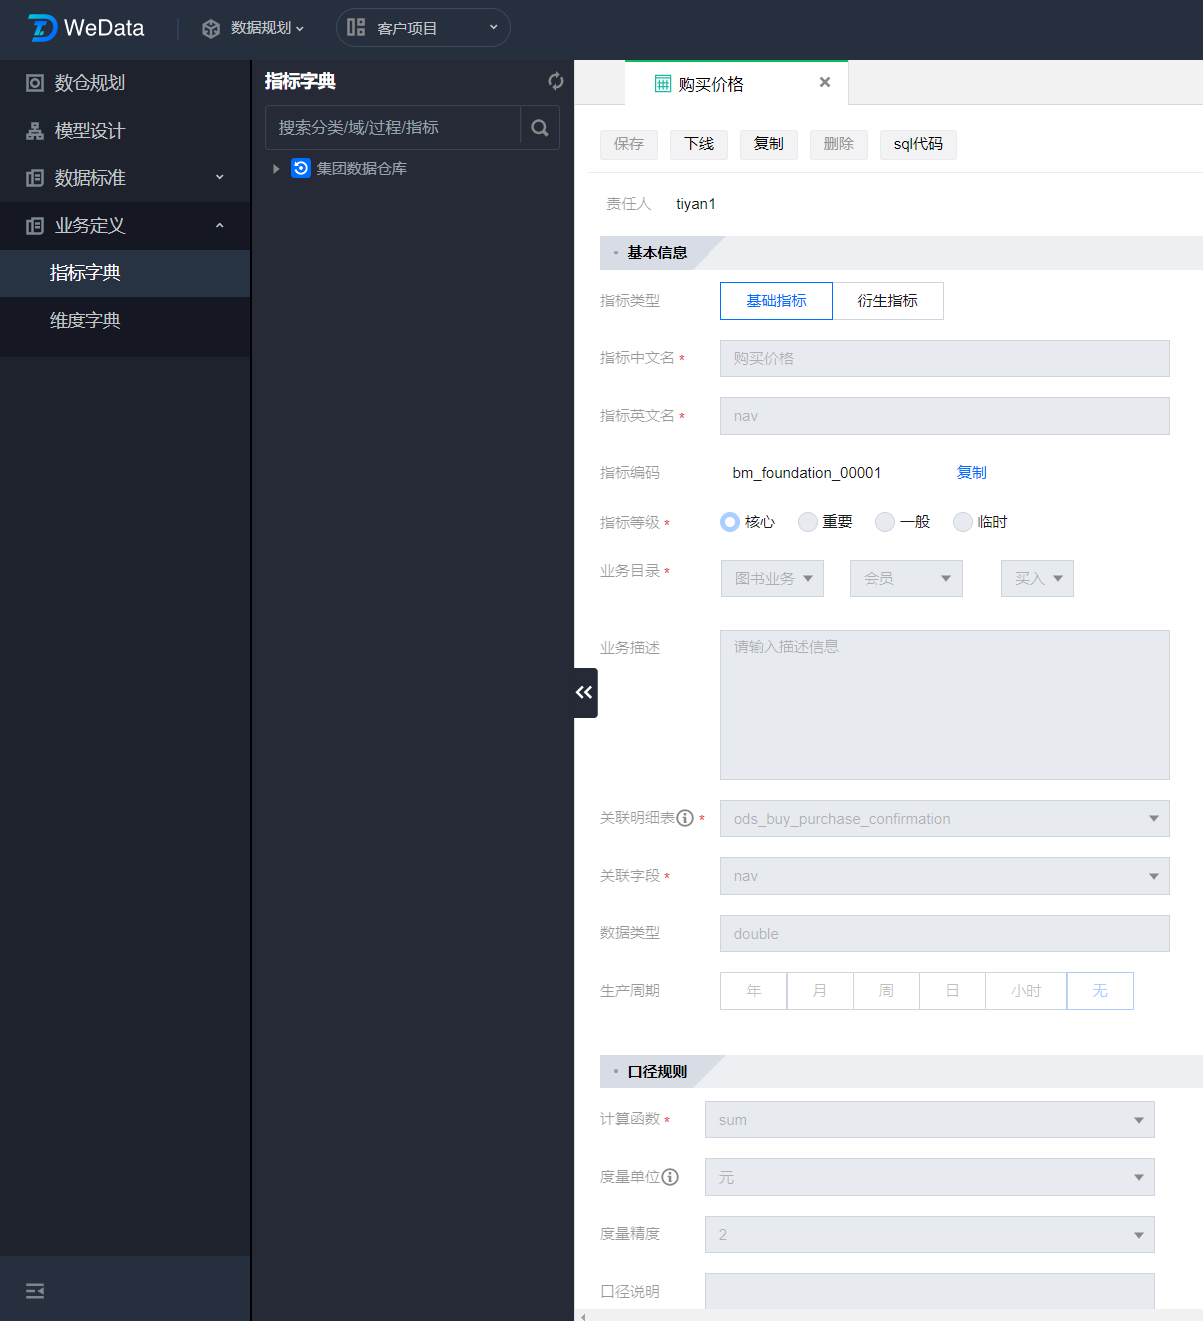
指标分为基础指标和衍生指标两类:
1.1 基础指标是不包含维度条件的度量,需要定义其基本属性、统计口径和单位精度等,衍生指标将会继承基础指标的口径单位。基础指标的数据来源于明细表某一字段,因此需要指标定义中进行关联。
1.2 衍生指标可以通过基础指标+维度条件定义某一特征范围的指标,如某些渠道范围、产品类型范围的用户增长数;也可通过多个衍生指标在同一维度条件下的组合计算结果,如增长率;衍生指标定义后会绑定到某一汇总表的字段,从而进行指标生产。
2. 维度定义
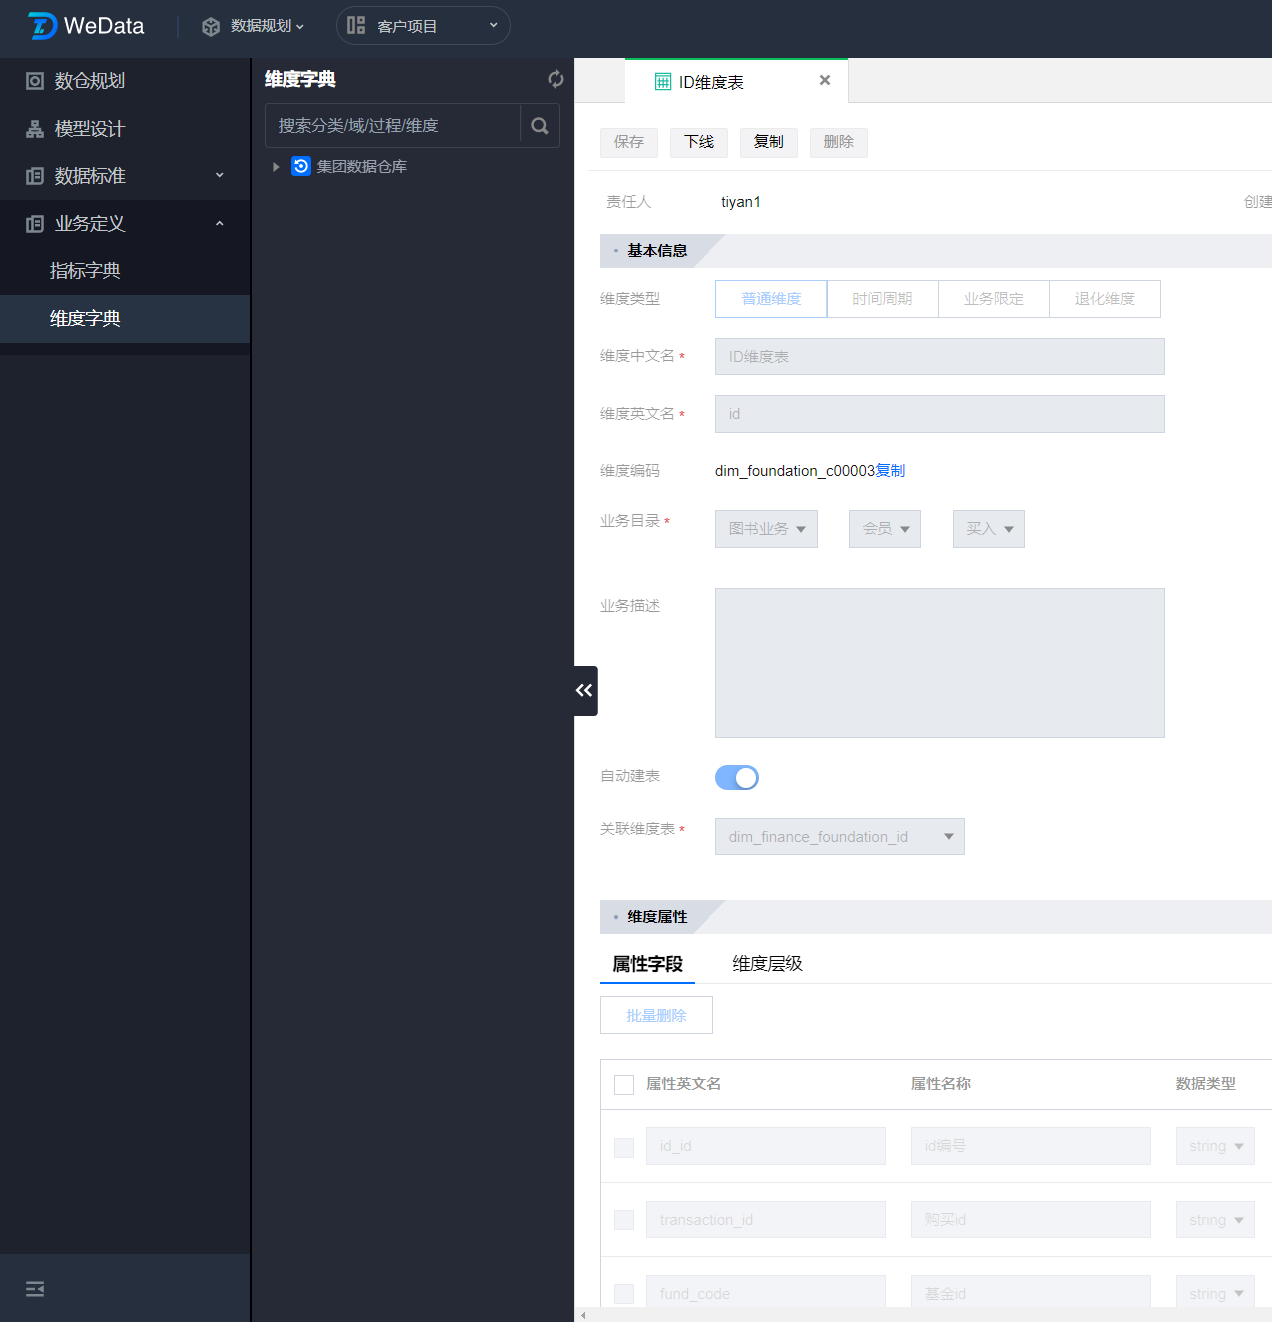
维度按照定义特征可分为:
2.1 普通维度:可以理解为 sql 中的 group by 条件,普通维度会唯一对应一张维表,在维度建模中进行关联;
2.2 业务限定:也称为修饰词,用于从业务维度筛选标签特征;
2.3 时间周期:时间类限定条件;
2.4 退化维度:将维度退回到事实表中。因为有时维度除了主键没有其他内容,虽然也是合法维度键,但是一般都会退回到事实表中,减少关联次数,提高查询性能。
指标、维度需要依次定义发布后,才能与表模型建立关联,同时被后续衍生定义所引用,从而指导指标生产落地。
数据标准
模型指标定义、开发生产过程中,需要按照统一的数据标准规范操作,因此需要对业务对象进行规则定义,标准管理便是从如下四个模块进行标准的定义管理:
1. 定义标准规则
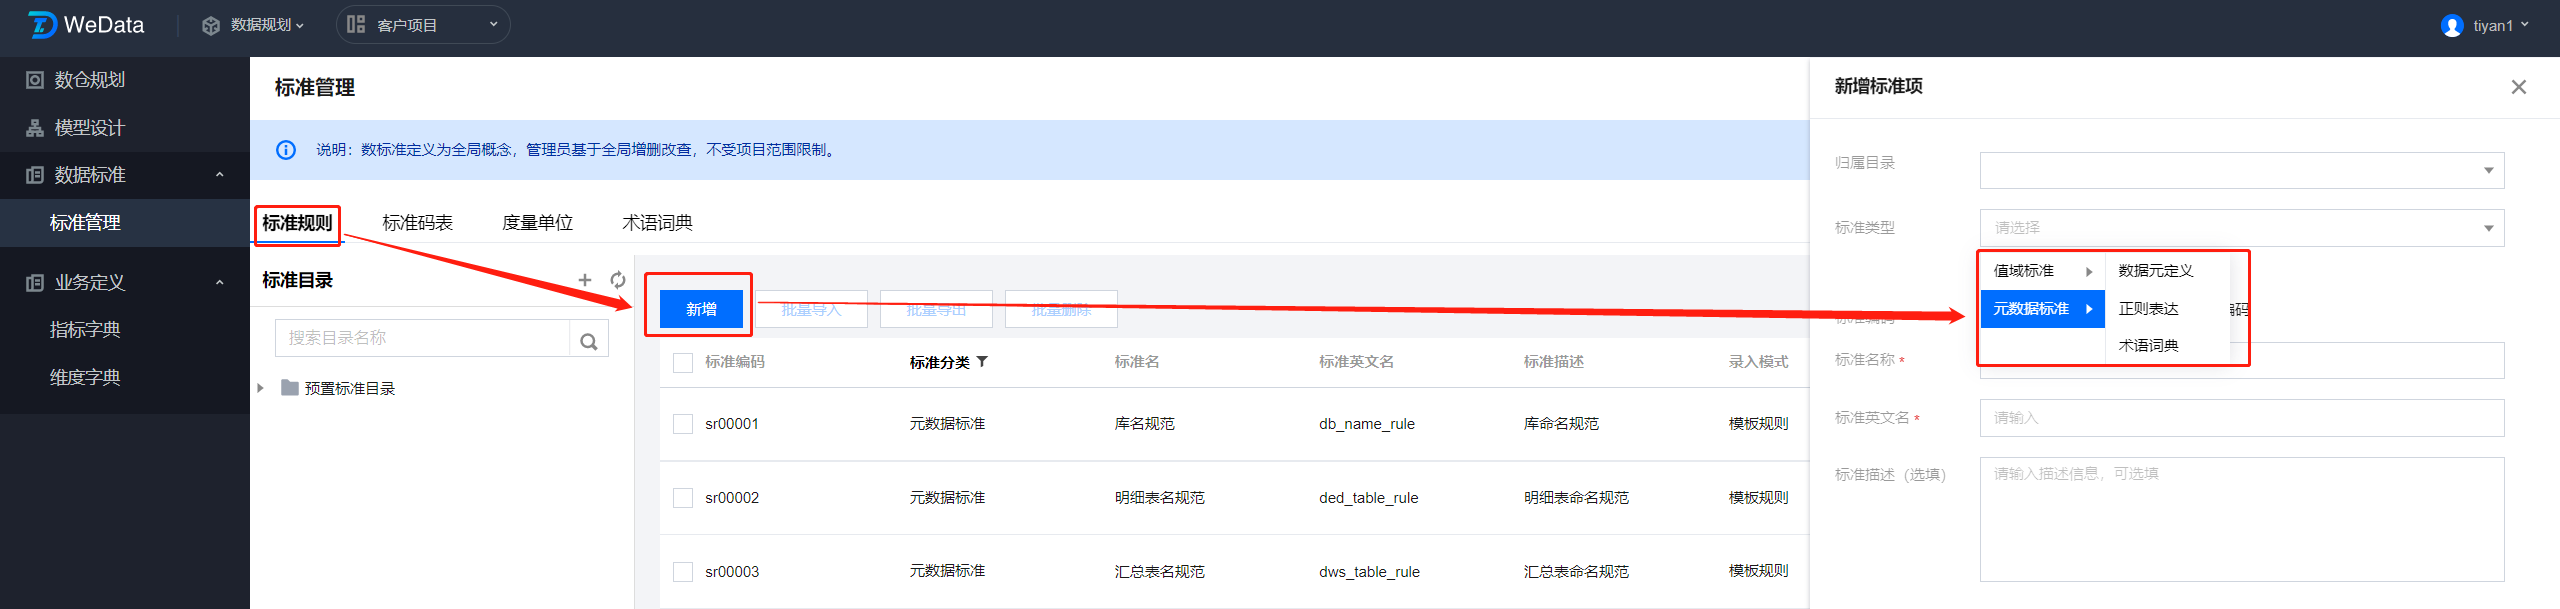
可以定义表、字段、指标级标准,其中元数据标准用于定义业务对象命名、类型规范,值域标准用于定义取值范围特征。
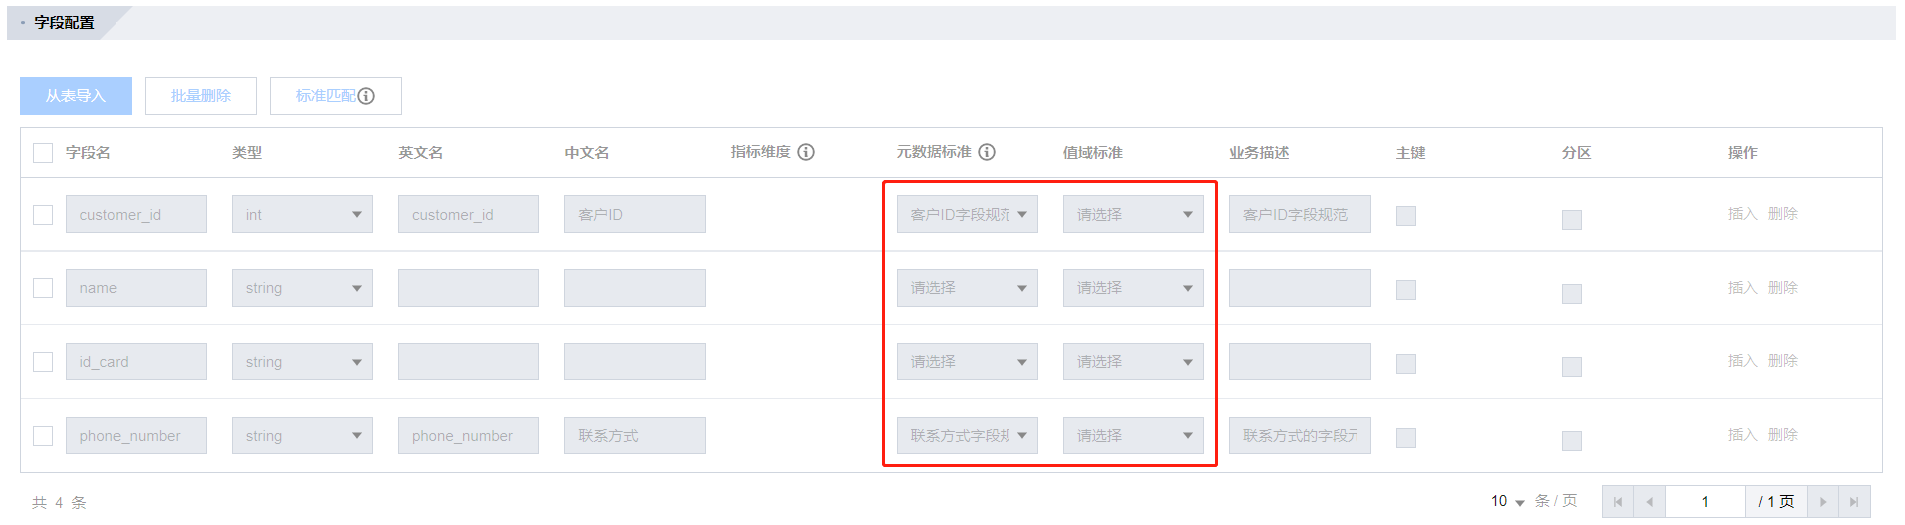
规则发布后可以在模型设计/物理模型字段中进行关联绑定:
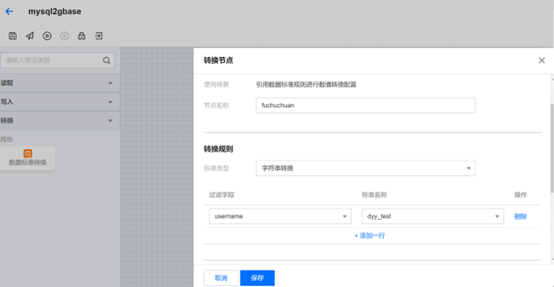
也可以在后续数据开发过程中使用 ETL 任务进行标准转换任务定义:
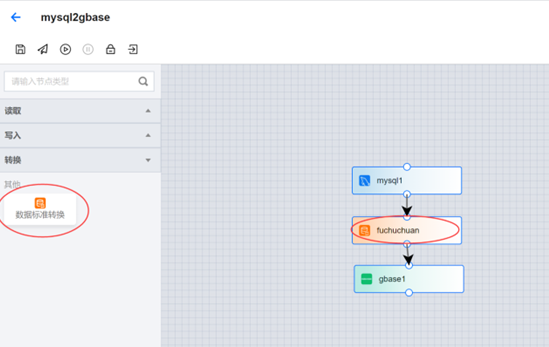
转换规则配置:
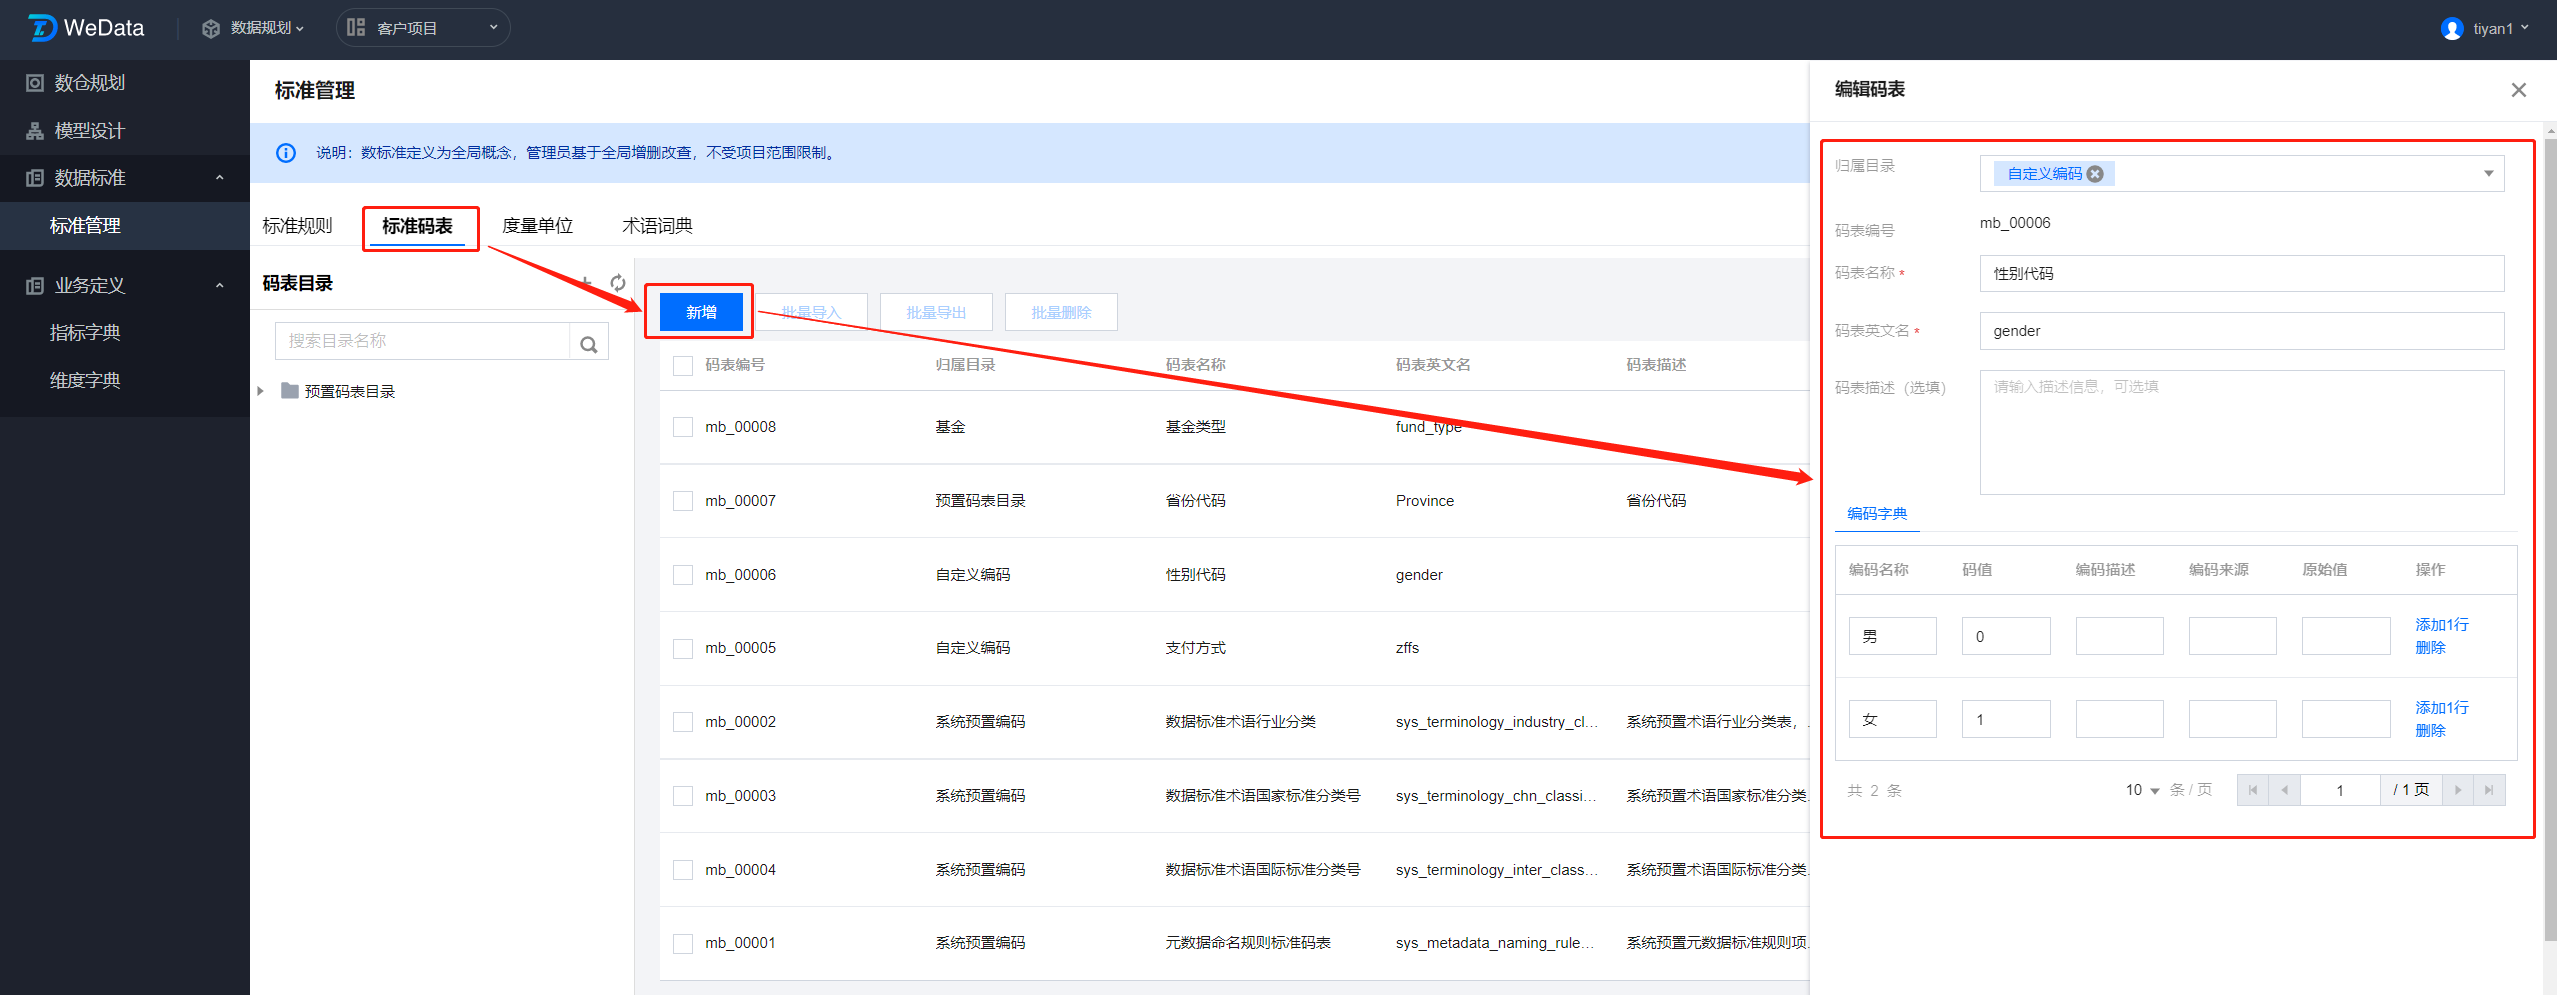
2. 定义标准编码
对于数据枚举类型需要单独通过标准编码进行管理,编码定义发布后,可以在标准规则进行引用。
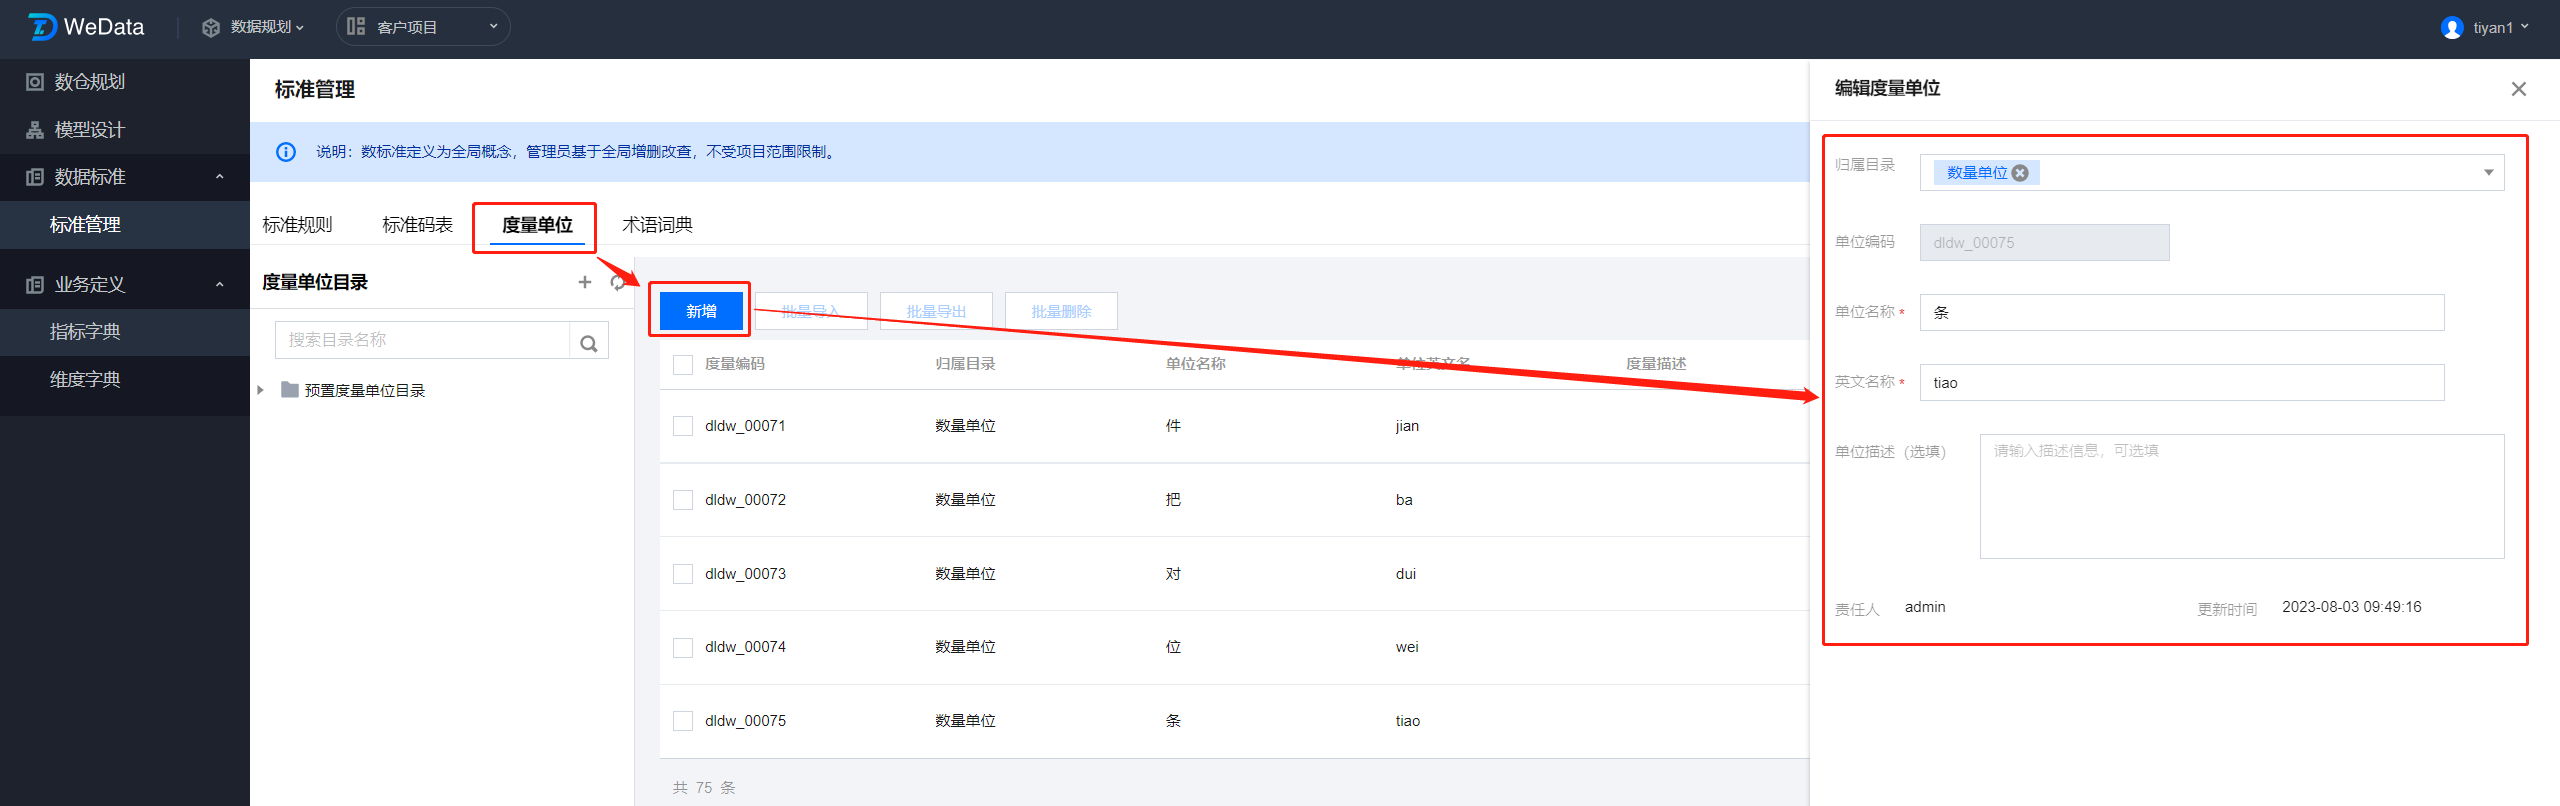
3. 定义度量单位
在定义指标时会用到度量单位,系统会预置通用单位,对于需要个性定义的单位可以在此模块进行定义。
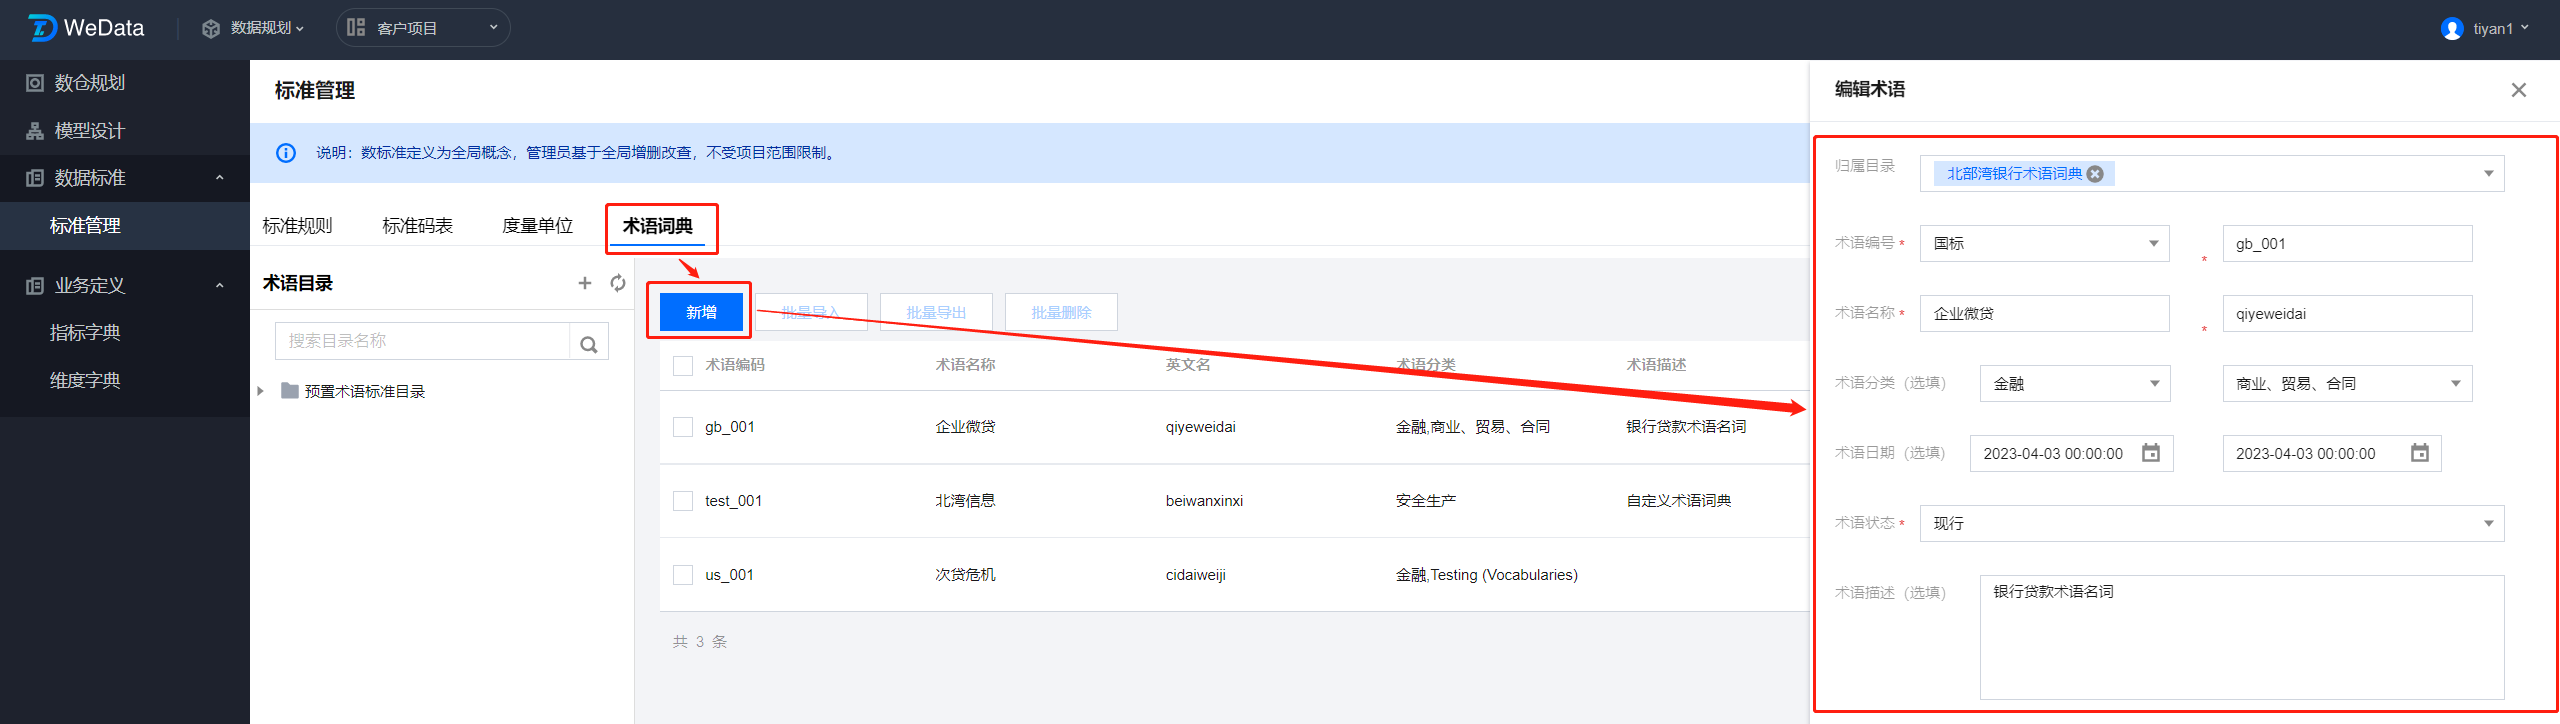
4. 定义术语字典
行业标准元数据会在术语字典进行批量定义,定义发布后可以在标准规则进行引用。