实例运维页面用于管理计算任务生成的实例快照,依据调度策略和事件监听进行操作。用户可在页面上查看并管理周期实例和事件实例,通过多种功能维护实例,确保数据处理与运行流程的稳定、高效和可靠。
前提条件
使用限制
1. 系统目前仅保留4个月内的实例,4个月前的实例会被自动清理。
2. 超过1个月处于等待事件 、等待上游的实例,系统会自动置终态(失败),减少对调度系统的压力。
3. 数据集成模块中创建的数据同步任务请进入数据集成-实例运维中维护,相关内容请参考 实时同步任务配置与运维 或 离线同步任务配置与运维。
操作步骤
进入运维页面
1. 登录腾讯云 WeData 数据开发治理平台。
2. 单击左侧目录树项目列表。
3. 选择对应的项目,并在右侧操作栏中单击进入运维中心模块。
4. 在左侧目录树中单击周期实例运维。
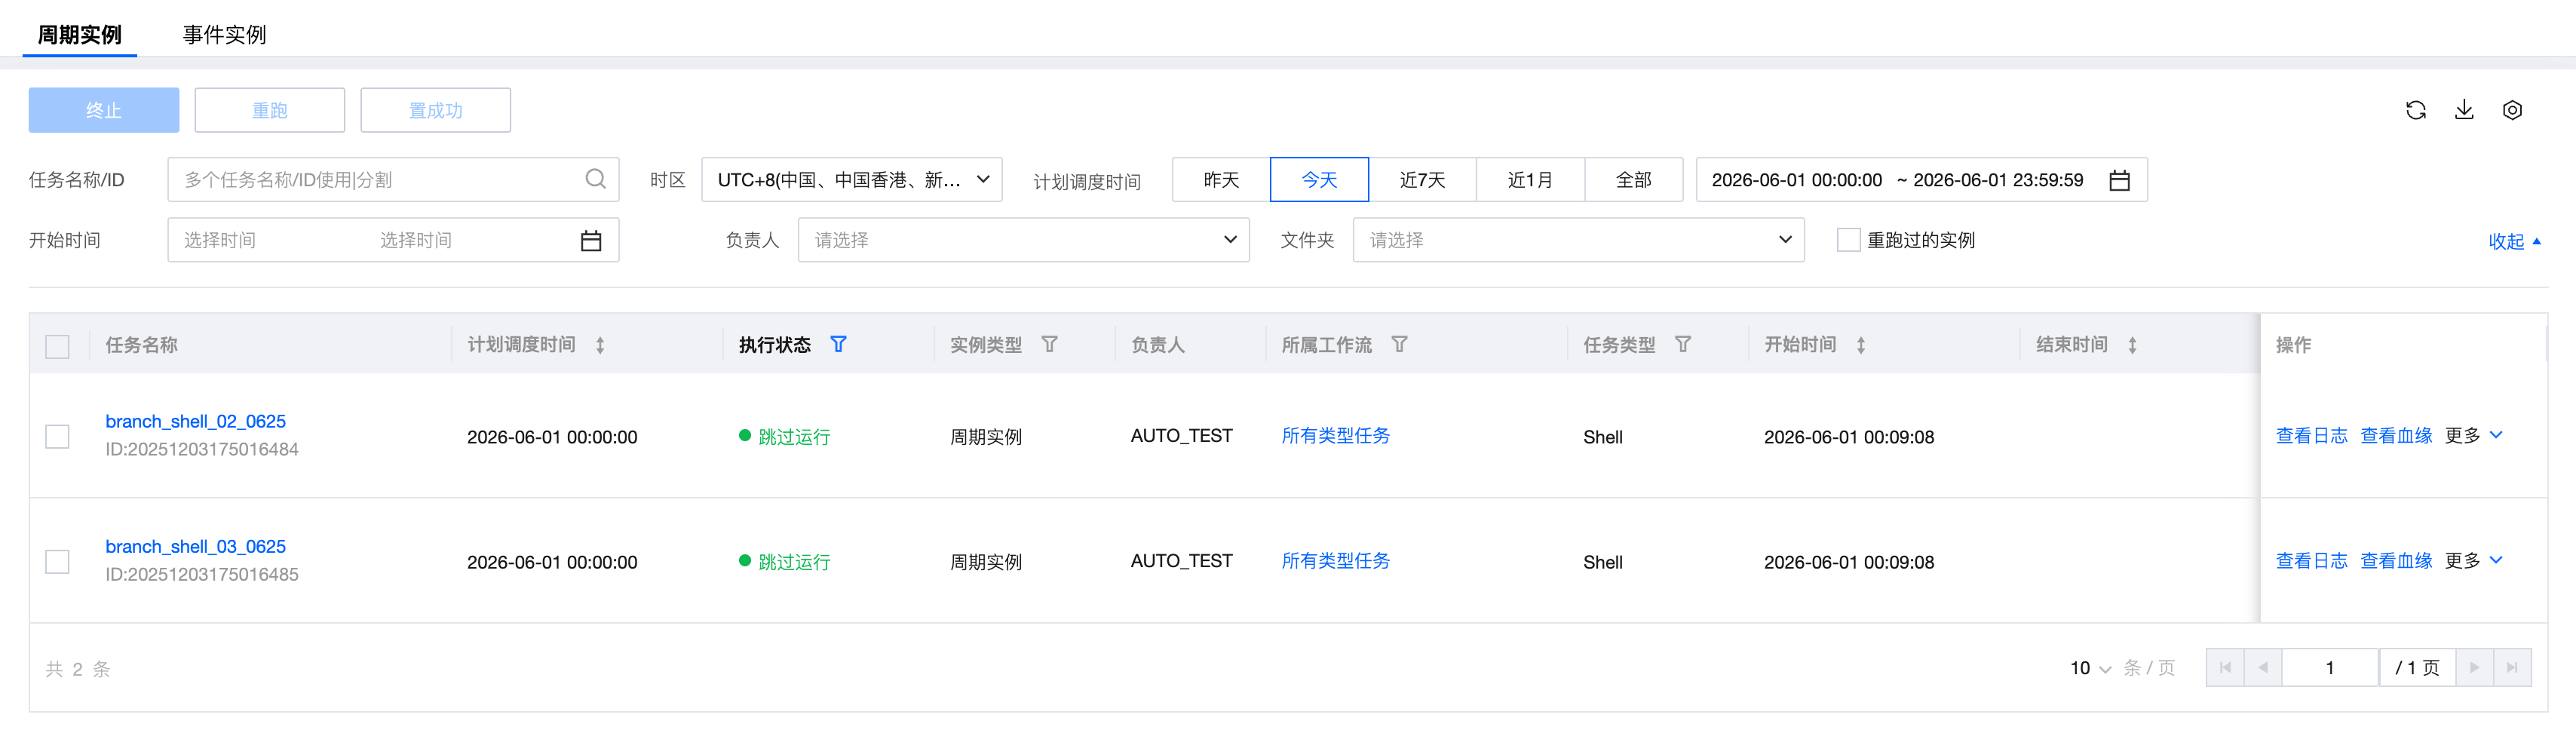
查看周期实例列表
周期实例页面以列表形式展示了计算任务通过调度策略生成实例的详细信息与操作功能,可以查看实例运行状态、日志,父子实例的上下游关系,可以对实例执行重跑、终止、置成功等操作。
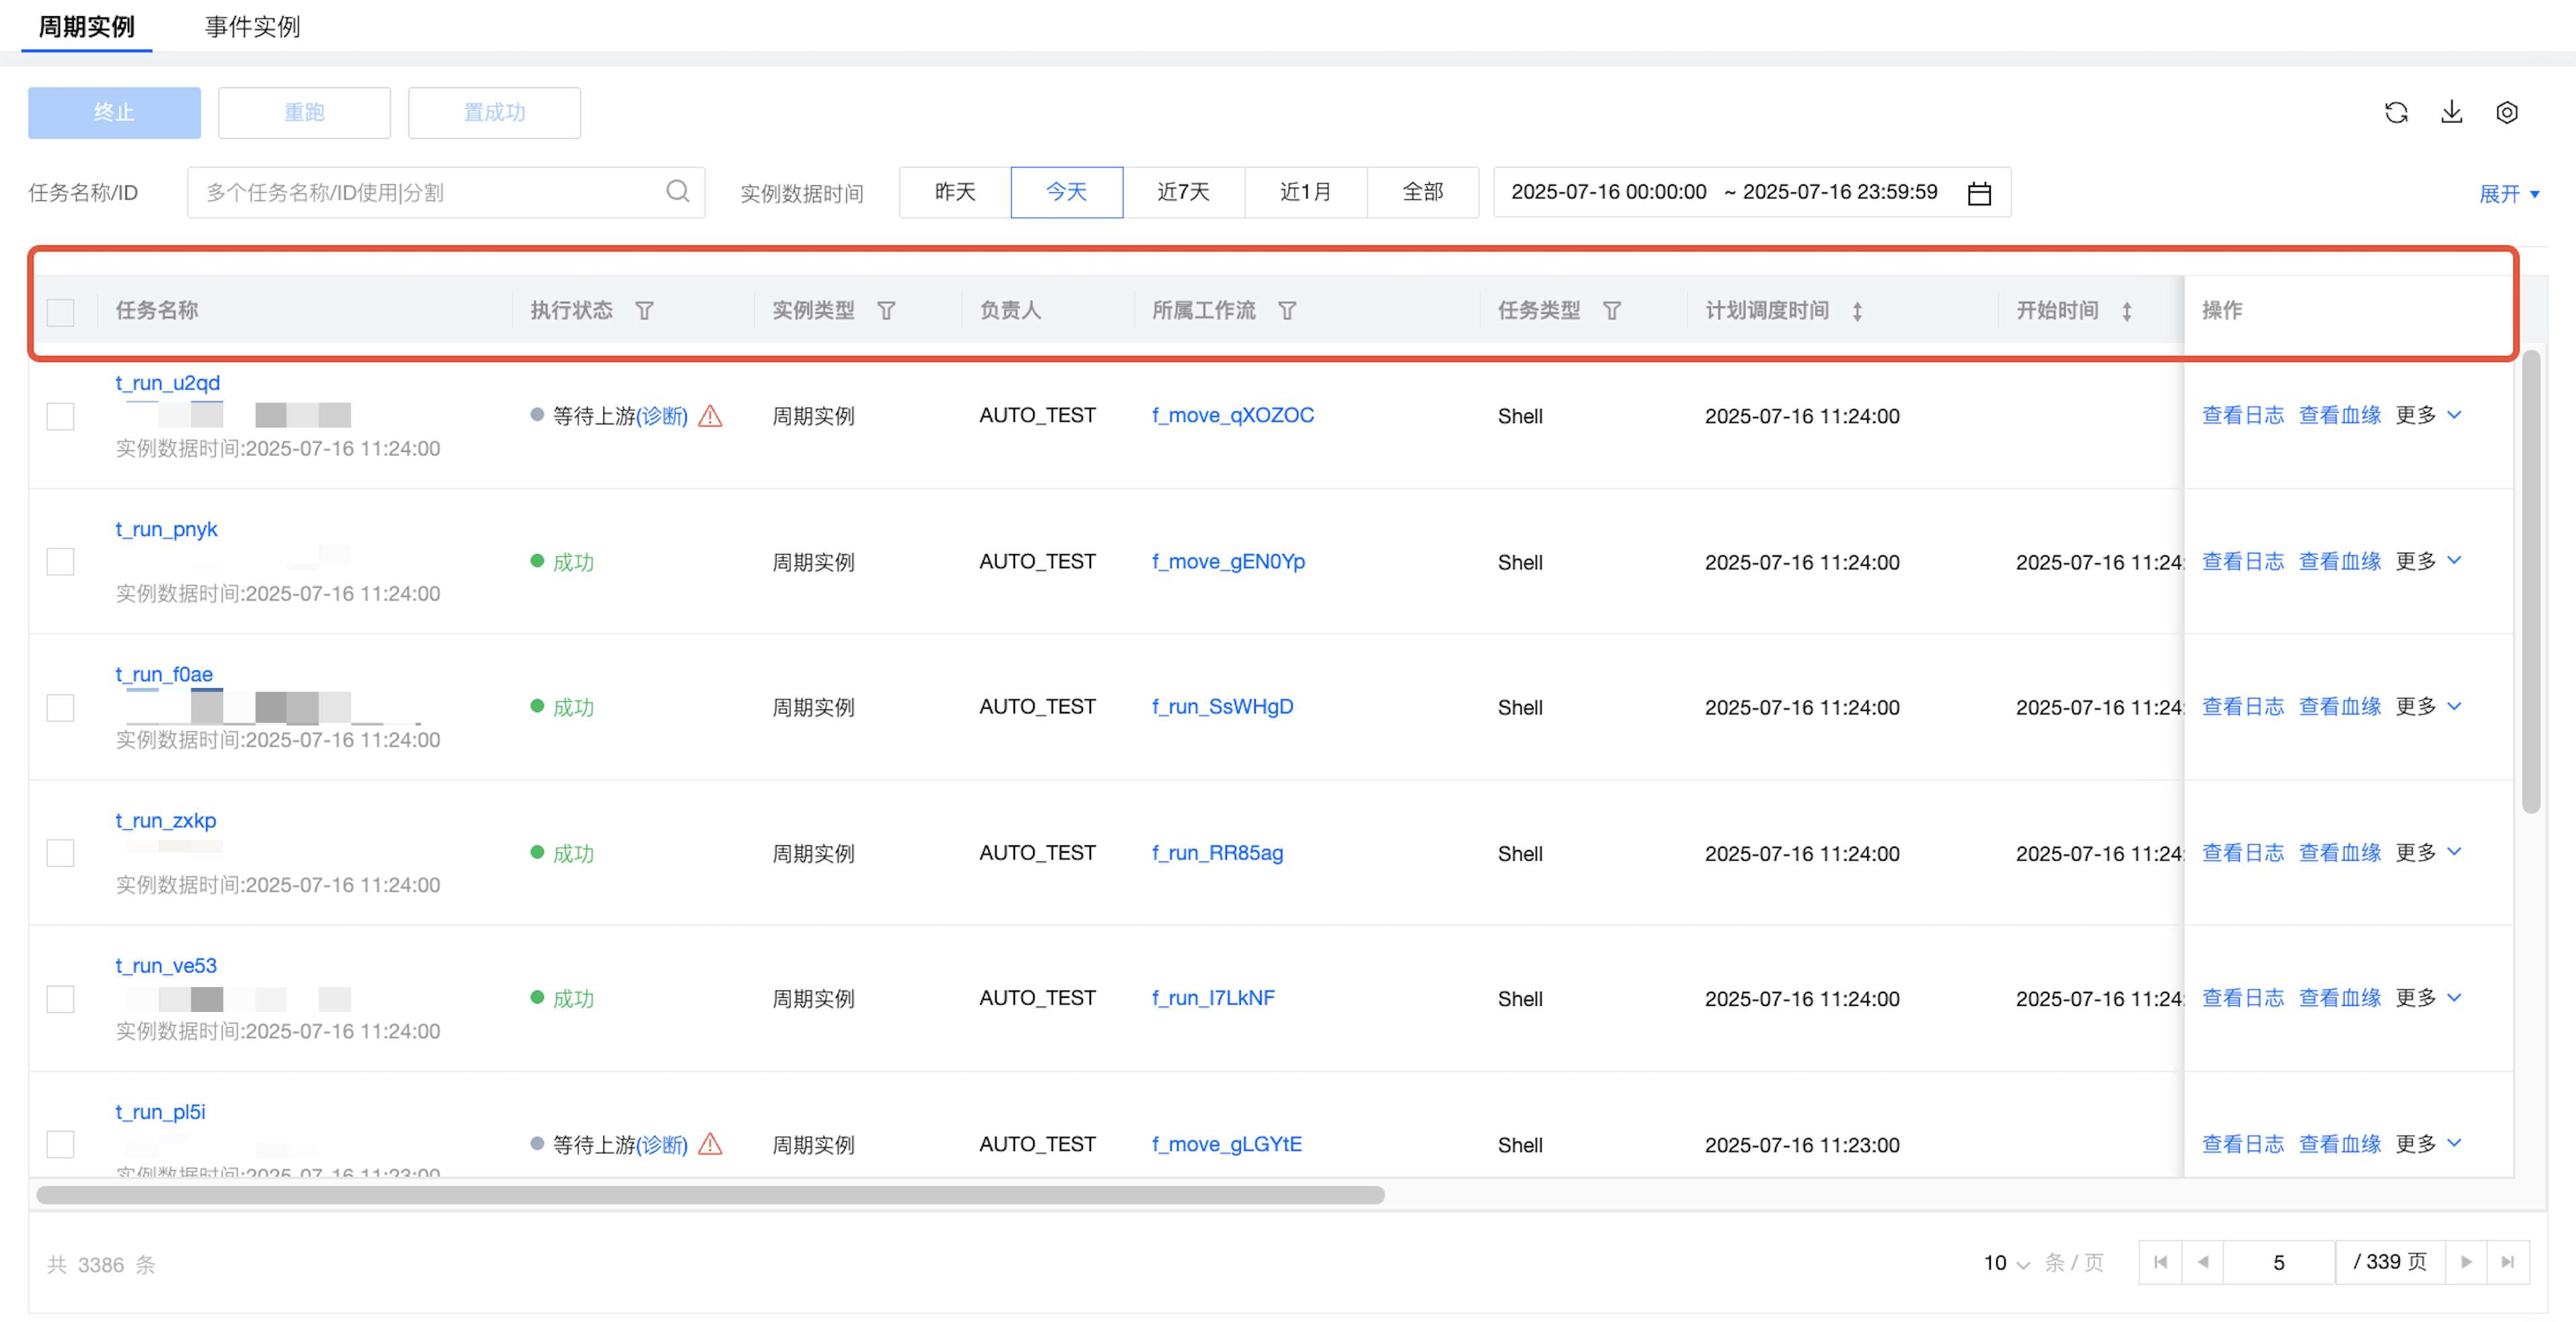
周期实例列表信息
功能说明:
信息 | 描述 |
任务名称 | 任务名称:点击可跳转到实例详情页-实例血缘,支持复制。
任务 ID:用于后台查询日志、排查问题等场景,支持复制。
实例数据时间:展示任务的数据时间,任务名称 + 实例数据时间可唯一确定一个实例。 |
执行状态 | 周期实例的运行状态,方便发现故障、问题等异常情况。 等待事件:实例所属的计算任务配置有监听事件,需要等待事件触发后实例即可正常运行。 等待上游:实例所属的计算任务在工作流编排流程中存在上游依赖任务,需要等待上游计算任务生成实例并运行成功后,当前实例任务才会正常运行。 等待运行:等待调度资源或超过调度并发数,等待下发到执行机。实例刚生成处于准备运行阶段,短时间内会进入下一阶段。 运行中:实例处于运行中阶段,可以通过日志实时查看运行过程。 跳过运行:分支条件不满足跳过运行。 失败重试:当实例运行失败时,按照计算任务调度策略中失败重试的相关配置,实例会在失败后再次执行。 失败:任务实例运行失败。 成功:任务实例运行成功。 在执行状态列提供了诊断信息和错误码信息 诊断信息:提供诊断信息、可能原因及操作指引,方便用户在实例异常时可快速定位问题并解决。 错误码:提供错误码、错误信息,在无法定位问题时,可复制错误码找平台同学协助运维。 |
实例类型 | 根据生成周期实例的调度策略显示对应的实例类型。 周期实例:由周期调度策略运行生成的计算任务实例,例如,天、周、月、小时、分钟的调度计划生成的任务实例均属于周期实例。 非周期实例:一次性执行生成的计算任务实例。 补录实例:通过数据补录生成的任务实例。 |
负责人 | 显示周期实例的负责人名称,明确计算任务实例的运维责任归属,默认为计算任务的创建用户。 |
所属工作流 | 显示周期实例所属计算任务在编排空间中的所属工作流名称,方便识别实例归属,进行统一管理。单击所属工作流名称可以跳转到对应计算任务的工作流配置页面。 |
任务类型 | 显示周期实例所属的计算任务类型。 |
计划调度时间 | 周期实例的调度运行周期。 |
开始时间 | 周期实例生成后开始运行的时间。格式为:yyyy-MM-dd HH:mm:ss。 |
结束时间 | 周期实例运行结束时间。格式为:yyyy-MM-dd HH:mm:ss。 |
执行时长 | 周期实例运行后开始时间到结束时间的运行时长。 |
执行资源组 | 周期实例执行使用的执行资源组。 |
失败重试次数 | 周期调度、补录或每次重跑会从0开始计数,超过设置的重试次数还未运行成功,则任务失败。“失败重试次数”在任务调度设置 > 高级设置 > 失败重试次数中自定义设置,默认值为5。 |
累计运行次数 | 指实例周期调度、补录和每次重跑执行次数的总和。 |
文件夹 | 显示周期实例所属计算任务在编排空间中的所属文件夹目录,方便识别计算任务实例归属,进行统一管理。 |
周期类型 | 显示周期实例所属计算任务的调度周期。 |
周期实例运维操作
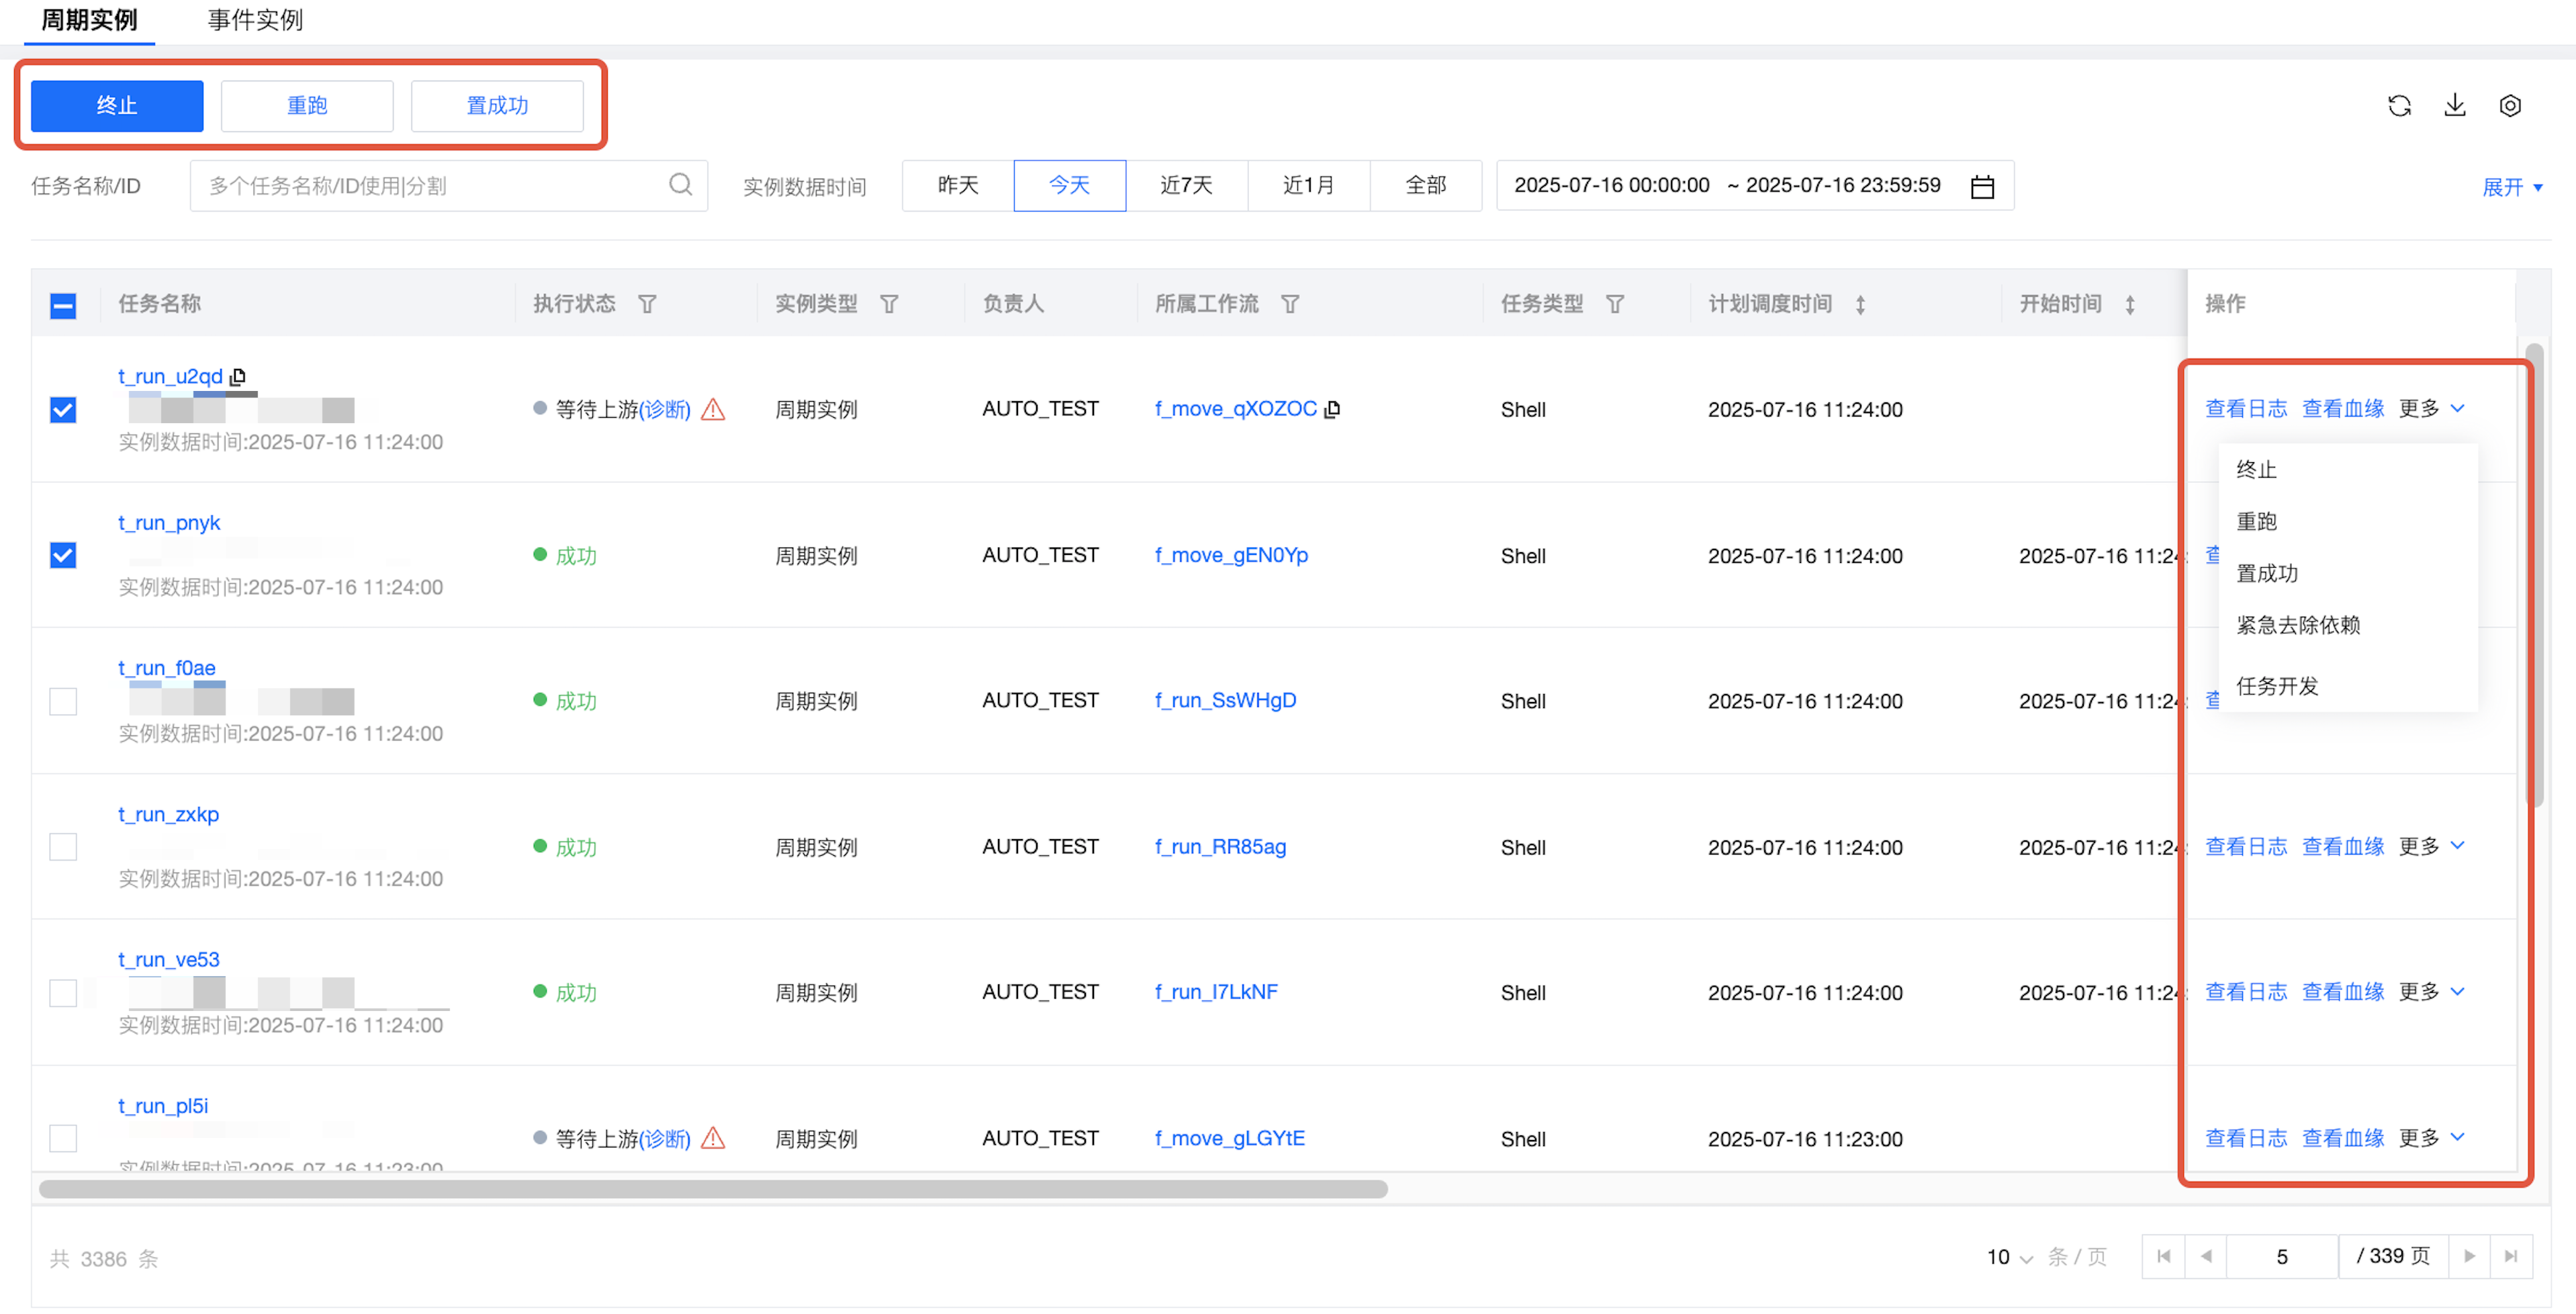
功能说明:
操作 | 描述 |
批量操作 | 在任务名称前进行勾选,再使用上方的功能按钮,可以批量将选中的周期实例执行终止、重跑、置成功的运行操作。 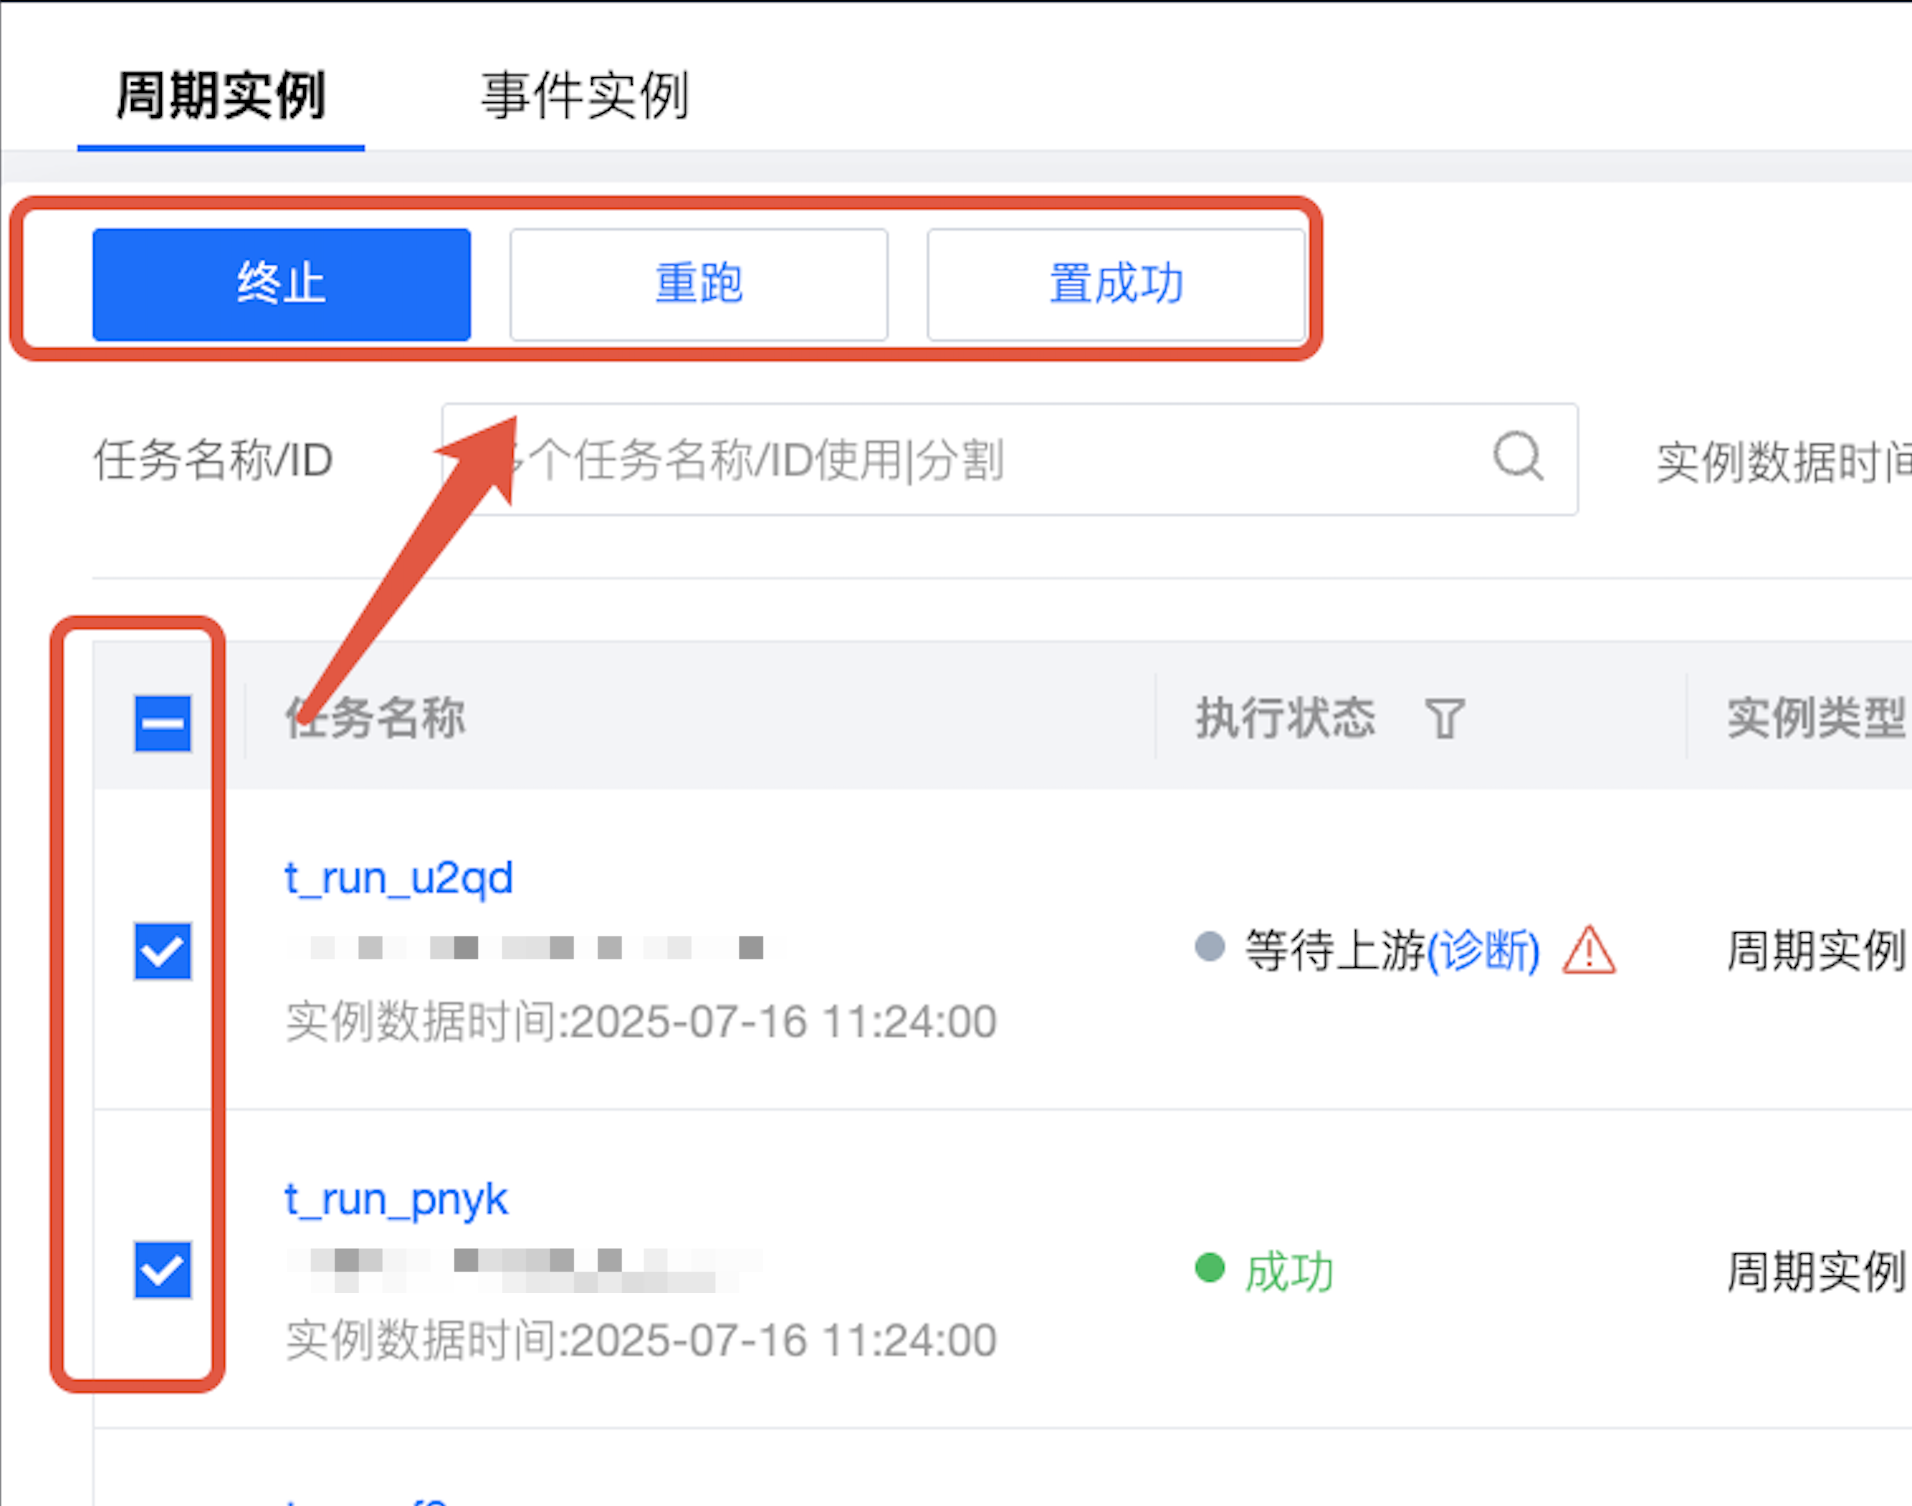 |
| |
| |
| |
查看日志 | 跳转到实例详情页 > 执行日志,可查看实例生成后每次执行的全流程,包含等待事件/上游、等待运行、运行中的开始时间、结束时间、耗时、具体情况、执行日志、执行代码等信息。 |
查看血缘 | 跳转到实例详情页 > 实例血缘,可查看实例的上下游关系,并支持在 DAG 图上诊断上下游阶段进行简单的信息查看和操作。 |
终止 | 仅对周期实例状态为“等待事件”、“等待上游”、“等待运行”和“运行中”操作有效。终止实例后,对应实例会被终止运行,执行状态会置为“失败”。 |
重跑 | 仅对周期实例状态为“失败”、“成功”、“等待运行”或“失败重试”操作有效。重跑实例后,对应任务实例将重新执行。重跑实例时可能会影响到上下游依赖、监听事件等调度策略,所以进行重跑时需要设置相关的配置项。 重跑实例范围:可以选择三种重跑方式。 当前实例:只重跑当前已选中的实例 该实例及下游实例:重跑当前已选中实例以及下游任务实例 下游实例:只重跑当前已选中实例的下游任务实例 下游实例范围:若重跑实例范围选择“该实例及下游实例”或“下游实例”,则可以指定下游实例的范围。包含: 所在工作流:当前工作流中下游实例 所在项目:当前项目中下游实例 所有项目:所有下游实例 指定实例:用户自行定义下游实例范围 忽略事件:当涉及重跑的实例对应的计算任务配置有监听事件时,可以选择是否忽略事件触发条件进行实例重跑。 检查父任务:检查选中实例的直接上游父任务,选择是否检查选中实例上一周期的实例,由调度配置 > 自依赖中的设置确定。 高级参数: 自定义参数:可以重新指定任务的参数,方便补录实例执行新的逻辑。 调度参数 默认任务自带参数,用户可以重新指定任务的参数,方便补录实例执行新的逻辑,新的参数会覆盖之前任务参数值。 参数名支持下拉选择配置参数,选择参数名后参数值会自动填充,可按需修改。 应用参数 针对 Spark SQL、PySpark 任务,支持重新指定应用参数值。 |
置成功 | 仅对周期实例状态为“运行中”、“失败”、“等待事件”、“等待上游”和“等待运行”有效。置成功实例后对应任务实例执行状态会置为“成功”。 |
紧急去除依赖 | 该操作可以将实例的依赖关系去除,用于在紧急场景下,上游实例未达到成功状态,影响下游实例执行,用户自行判断上游实例对当前实例影响不大时,可进行紧急去除依赖操作。将对应上游与当前实例的依赖关系去除,保证当前实例可正常执行。 该操作仅针对当前实例生效,不影响之前的实例及后续实例的依赖关系。 该操作为不可逆操作,即后续对该实例的重跑和补录操作都将不再检查去除的依赖关系。 可按需去除部分依赖。 去除的依赖关系在实例 DAG 图上还会展示,会进行特殊标识,以便用户区分。 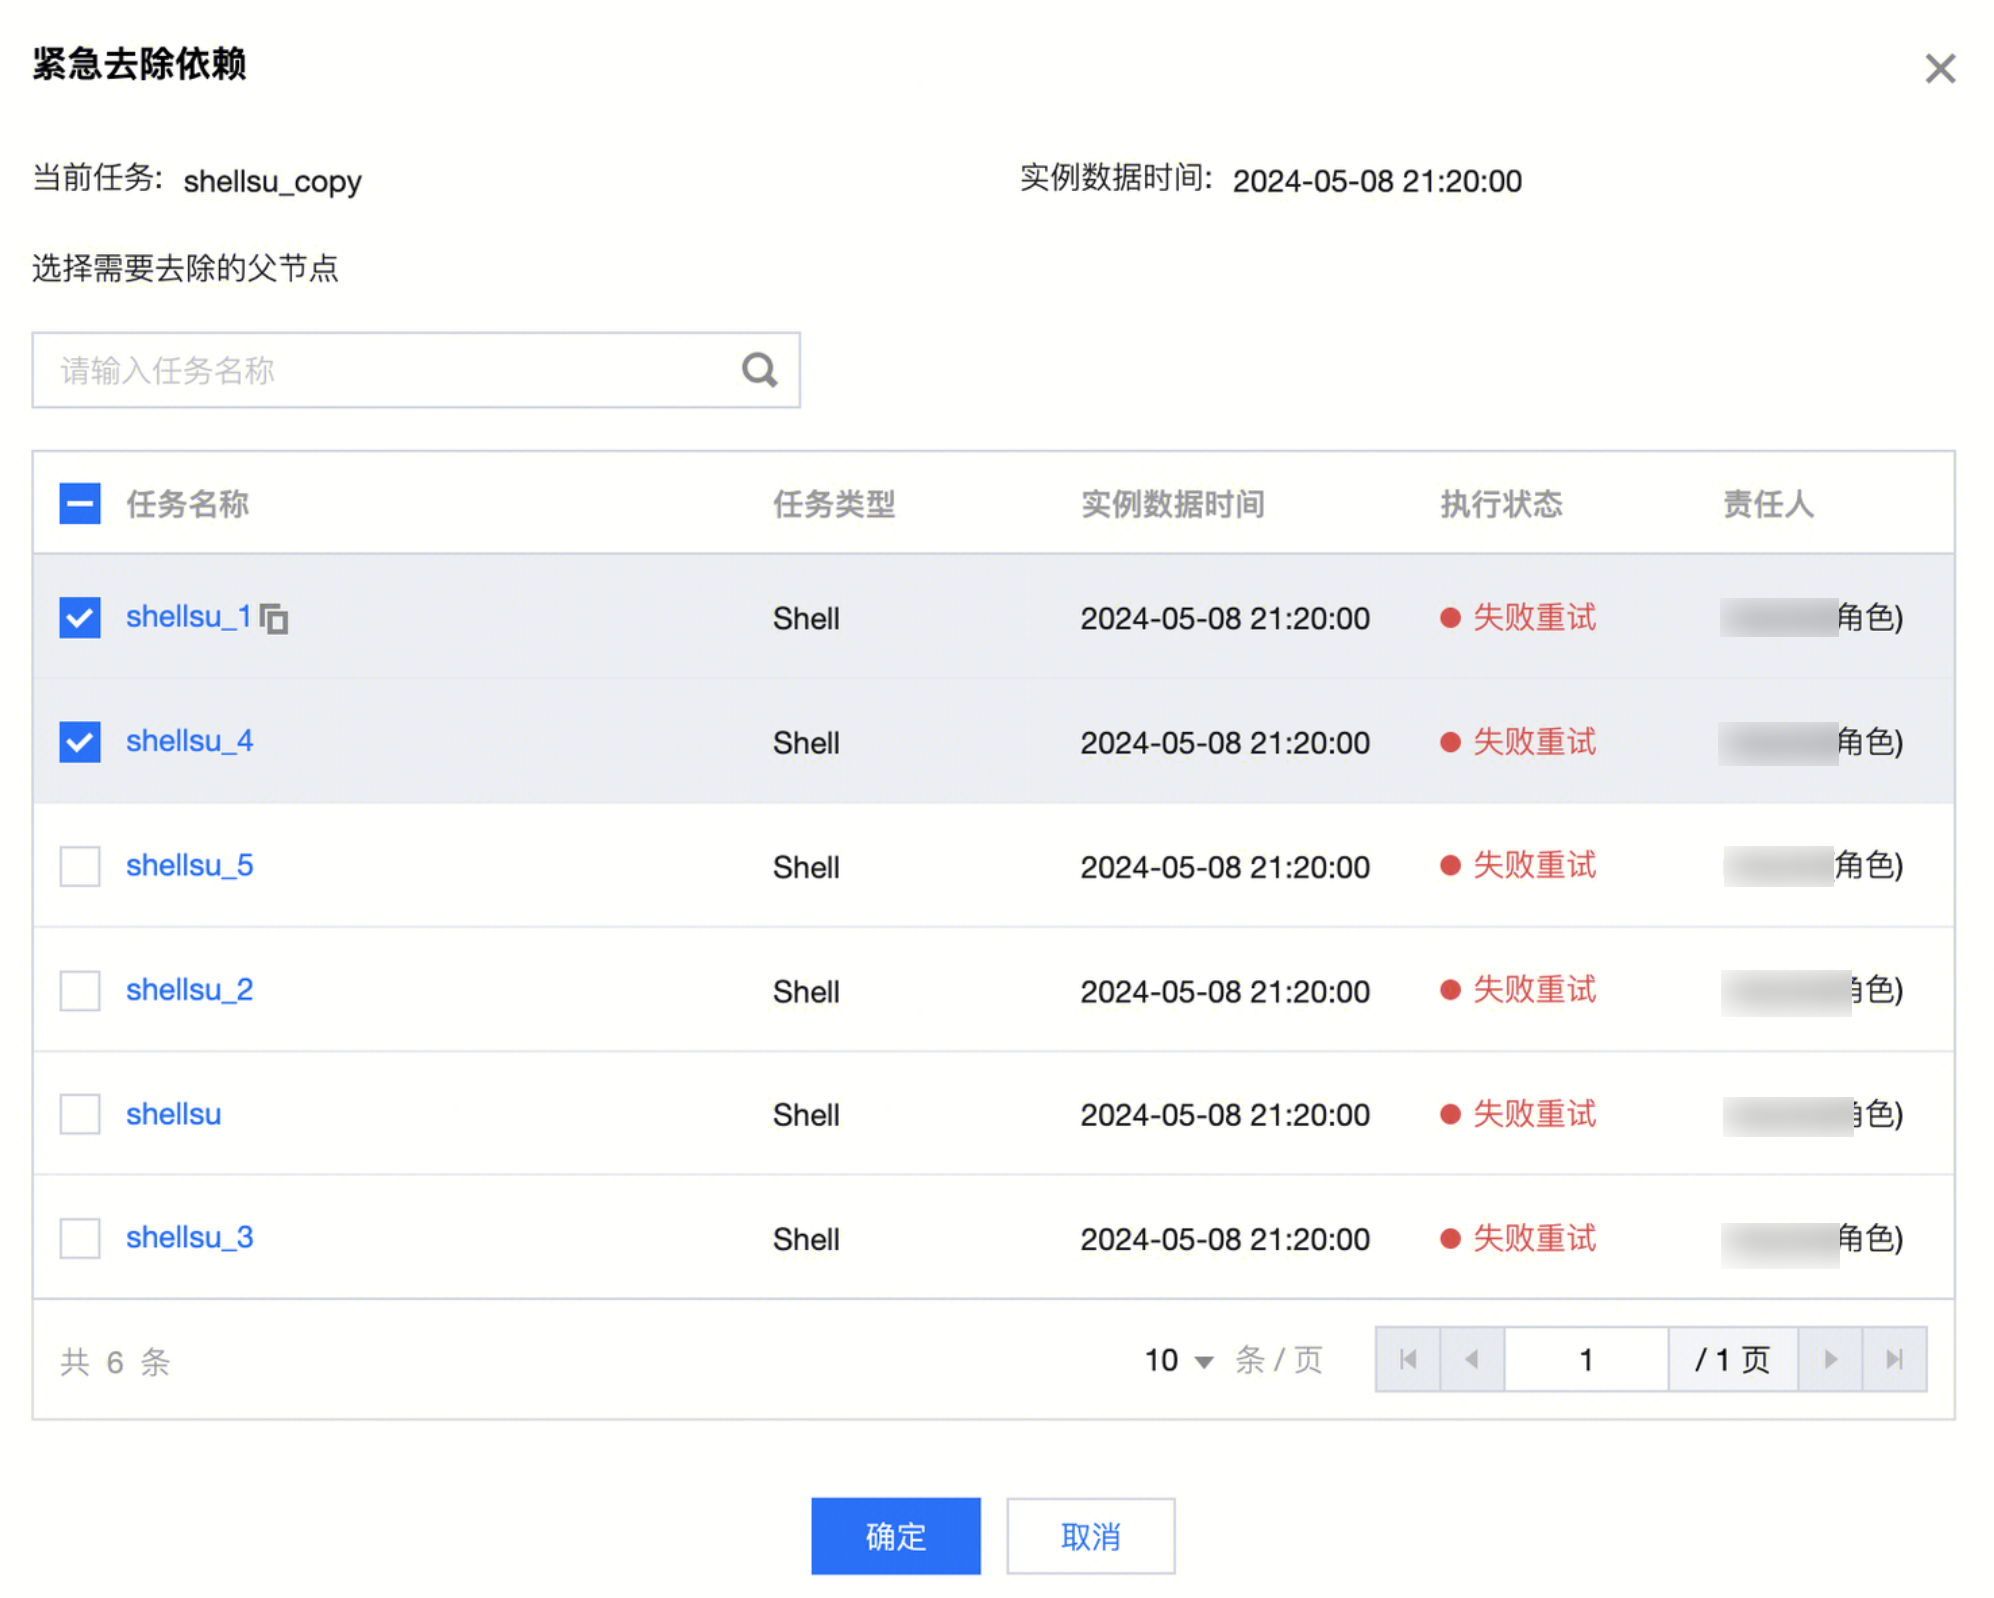 |
任务开发 | 跳转到编排空间中对应周期实例的计算节点配置界面,是实例运维跳转计算任务节点编辑的快捷通道。 |
周期实例筛选&列表操作
操作 | 描述 |
筛选项 - 列表上方 | 支持按照任务名称/ID、时区、计划调度时间、开始时间、负责人、文件夹、重跑过的实例进行筛选。 |
筛选项 - 列表内 | 支持按照执行状态、实例类型、所属工作流、任务类型、执行资源组、周期类型进行筛选。 |
列表操作 | 刷新:可以刷新周期实例列表的最新状态,一般用于对周期实例进行操作后、查看实例运行状态等场景,帮助用户方便获取最新的运维信息。 下载:可下载当前实例列表的数据,目前仅支持下载列表中当前0点前生成的实例。 列表配置:支持调整当前列表展示的字段及字段的顺序。 |
周期实例详情页
实例详情页集合了实例的所有运行历史、运行情况、实例血缘、操作记录等信息,以及实例的基本操作。帮助用户查看和运维实例。
Tab 页 | 描述 |
执行日志 | 查看实例生成后每次执行的全流程,包含等待事件/上游、等待运行、运行中的开始时间、结束时间、耗时、具体情况、执行日志、执行代码等信息。 执行列表:最右侧为实例每次执行的记录列表,每次周期调度、重跑、补录的首次执行或重试都会被记录成一次执行。 执行信息:每次执行都可查看等待事件/上游、等待运行、任务运行三个阶段的基本情况 等待事件/上游:展示直接上游实例/事件列表及状态,方便快速识别阻塞实例/事件。 等待运行:等待下发到执行机。 任务运行:已下发到执行机并开始执行,可查看执行日志及执行代码。 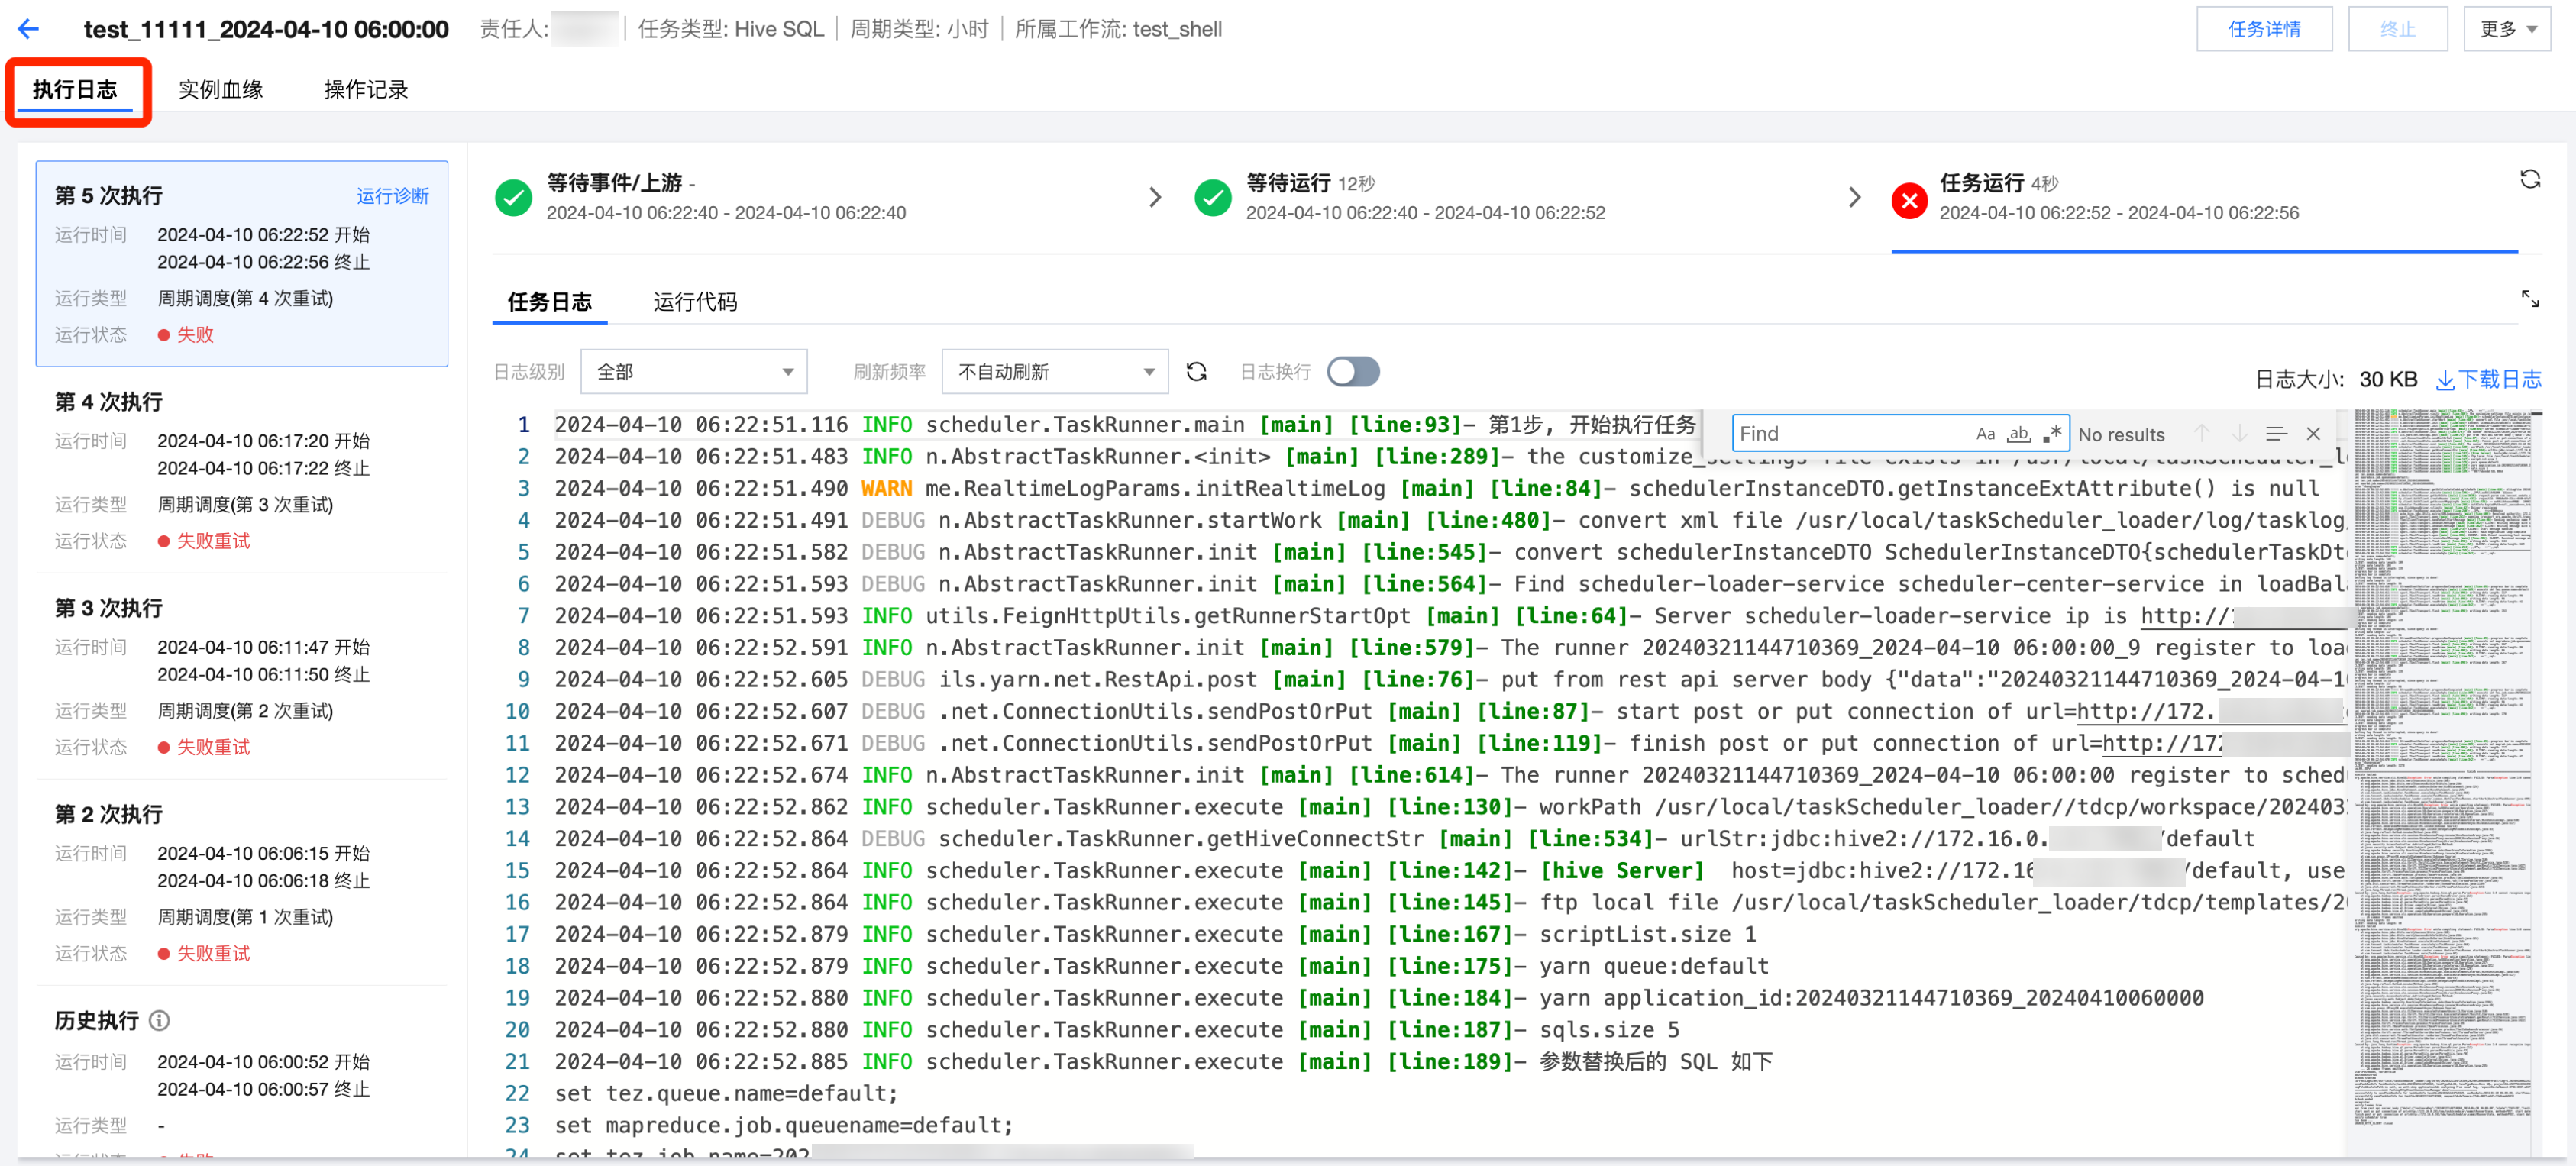 For-each 节的执行信息展示遍历列表,单击遍历可查看某次遍历对应的实例 DAG 图。在实例 DAG 图中,单击右键节点 > 查看日志,即可进入子节点实例查看其运行情况和日志。 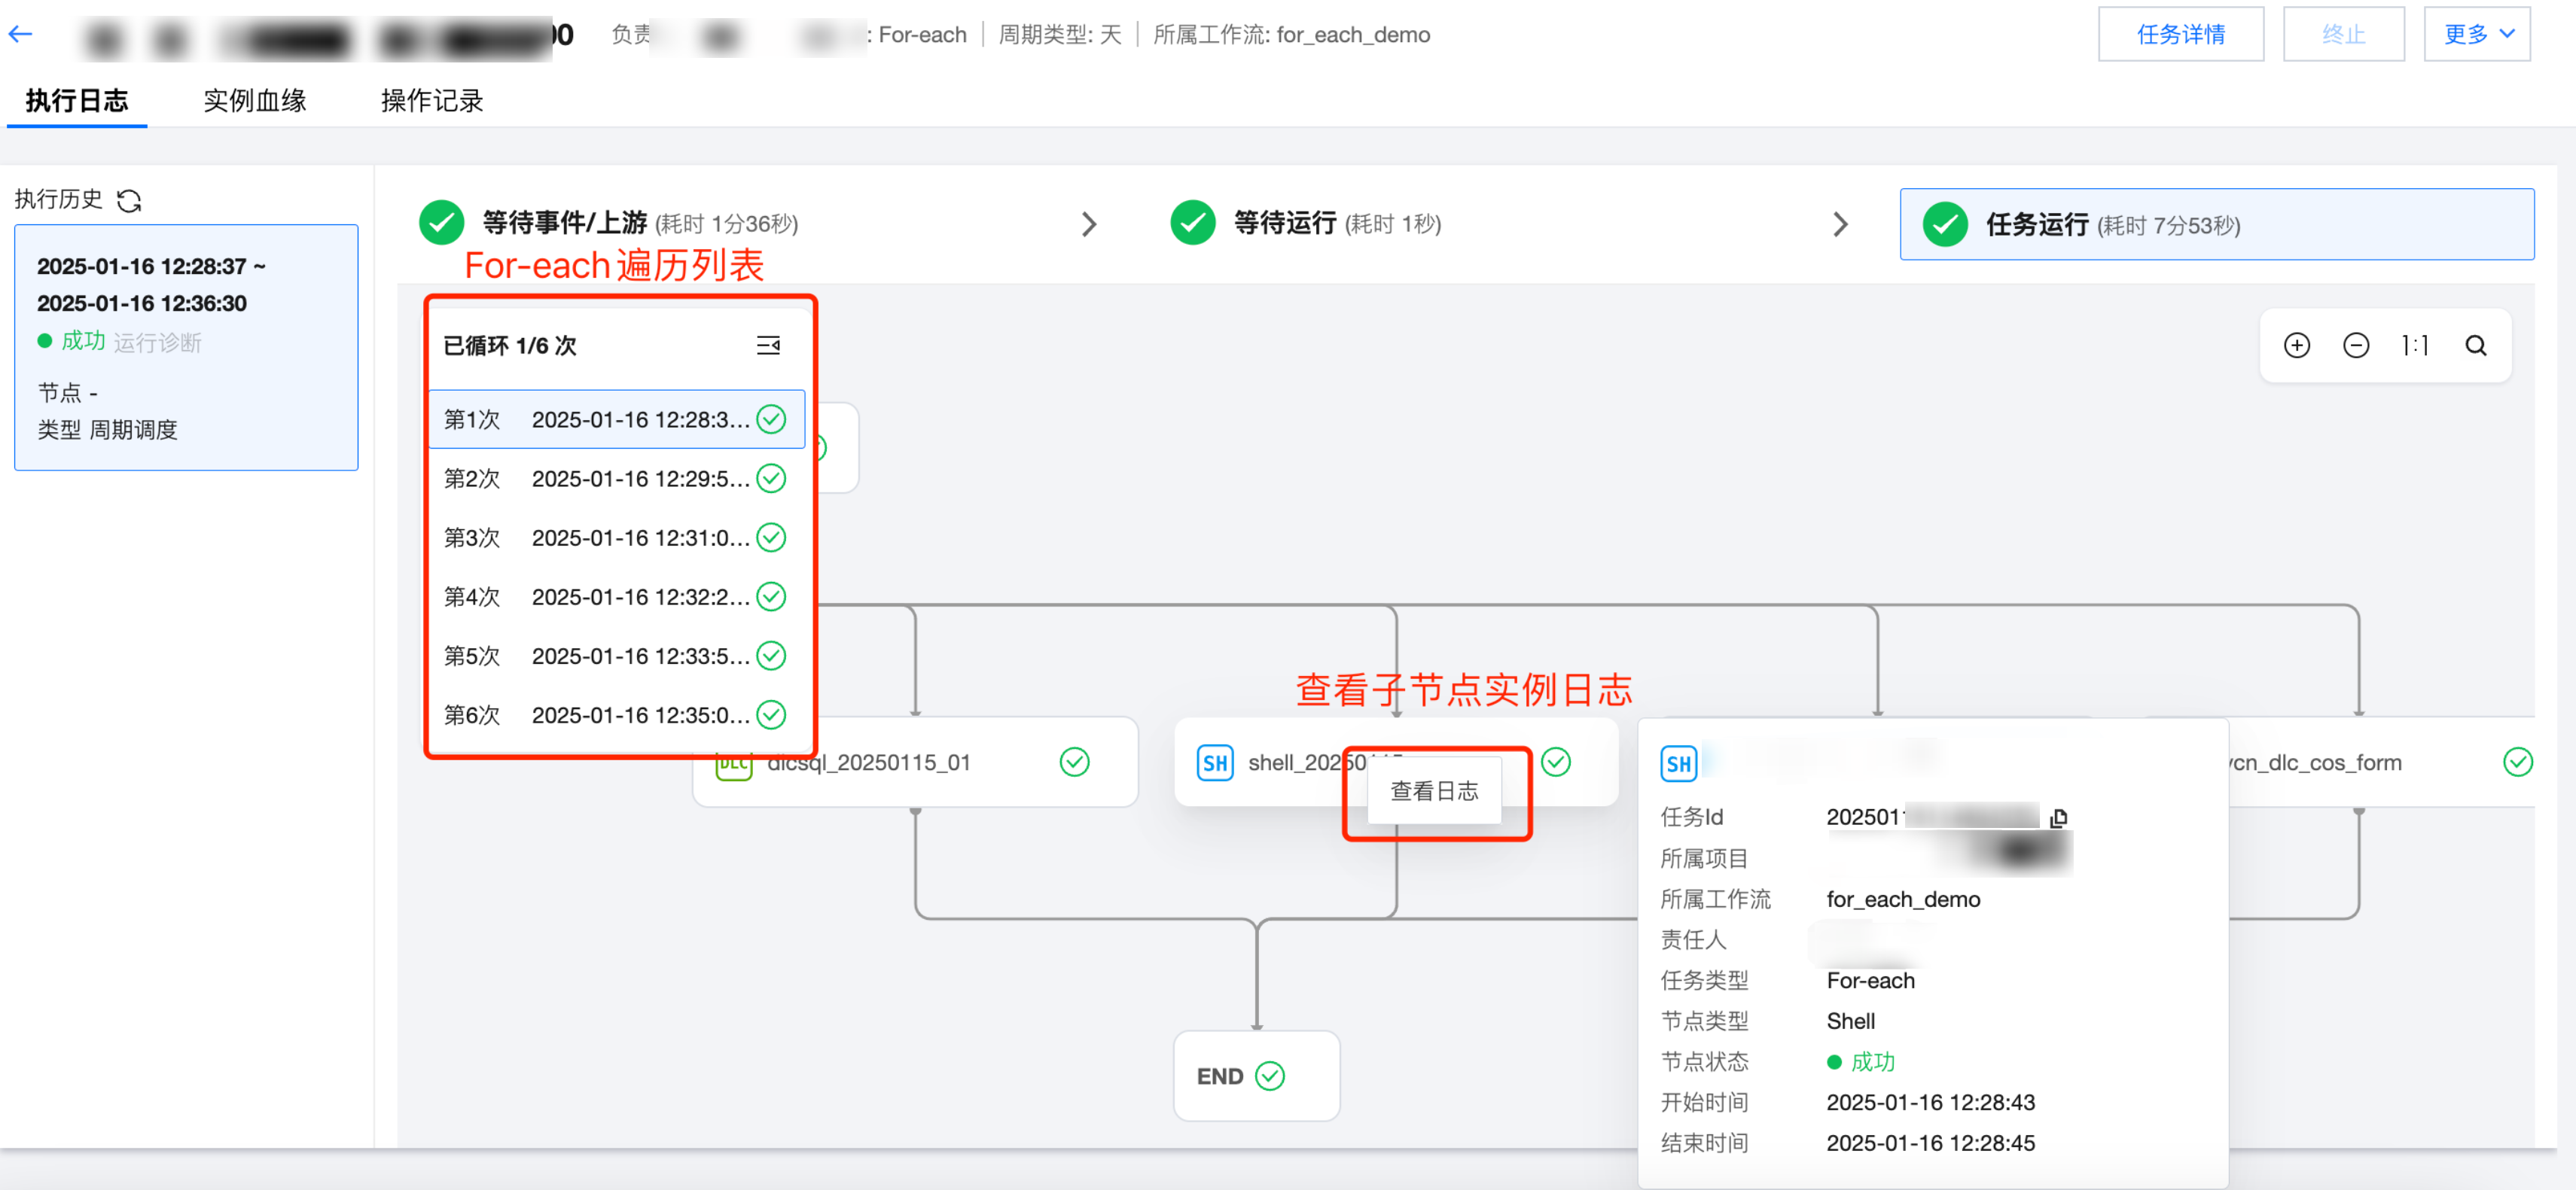 子节点实例详情页可查看运行代码和执行日志。 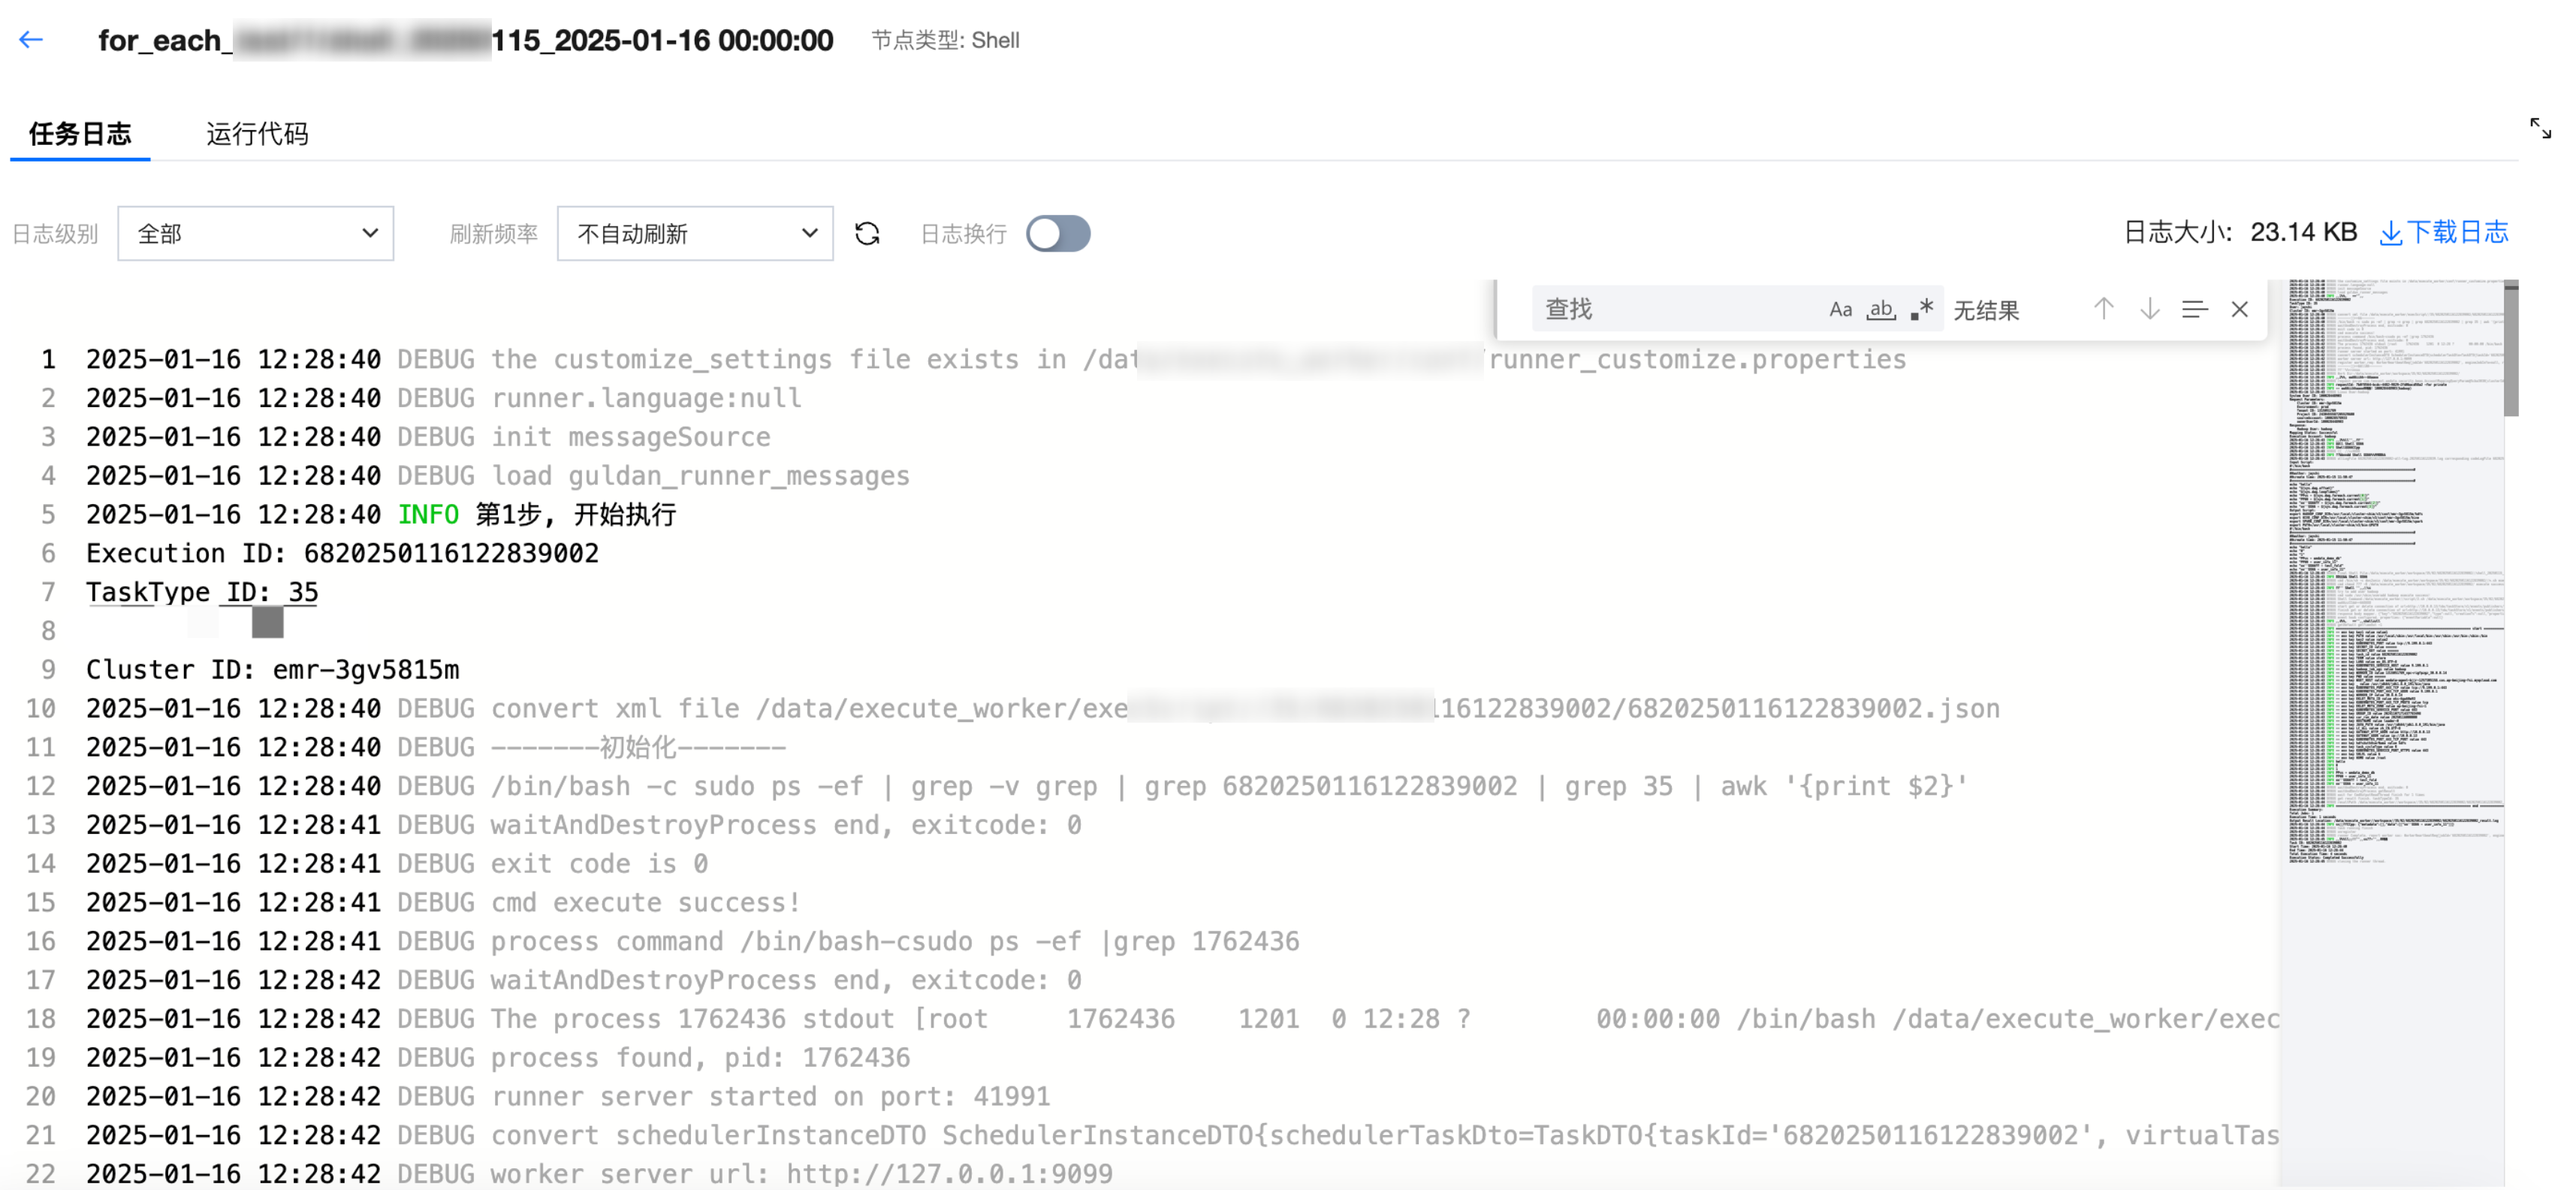 |
实例血缘 | 查看当前计算任务实例在其所属的工作流中与其他计算任务实例的上下游关系,并且会显示每个计算节点的运行状态与详细信息,用不同颜色标记实例运行状态。
图模式:通过图模式查看实例血缘,可逐层向上展开,支持实例基础操作。 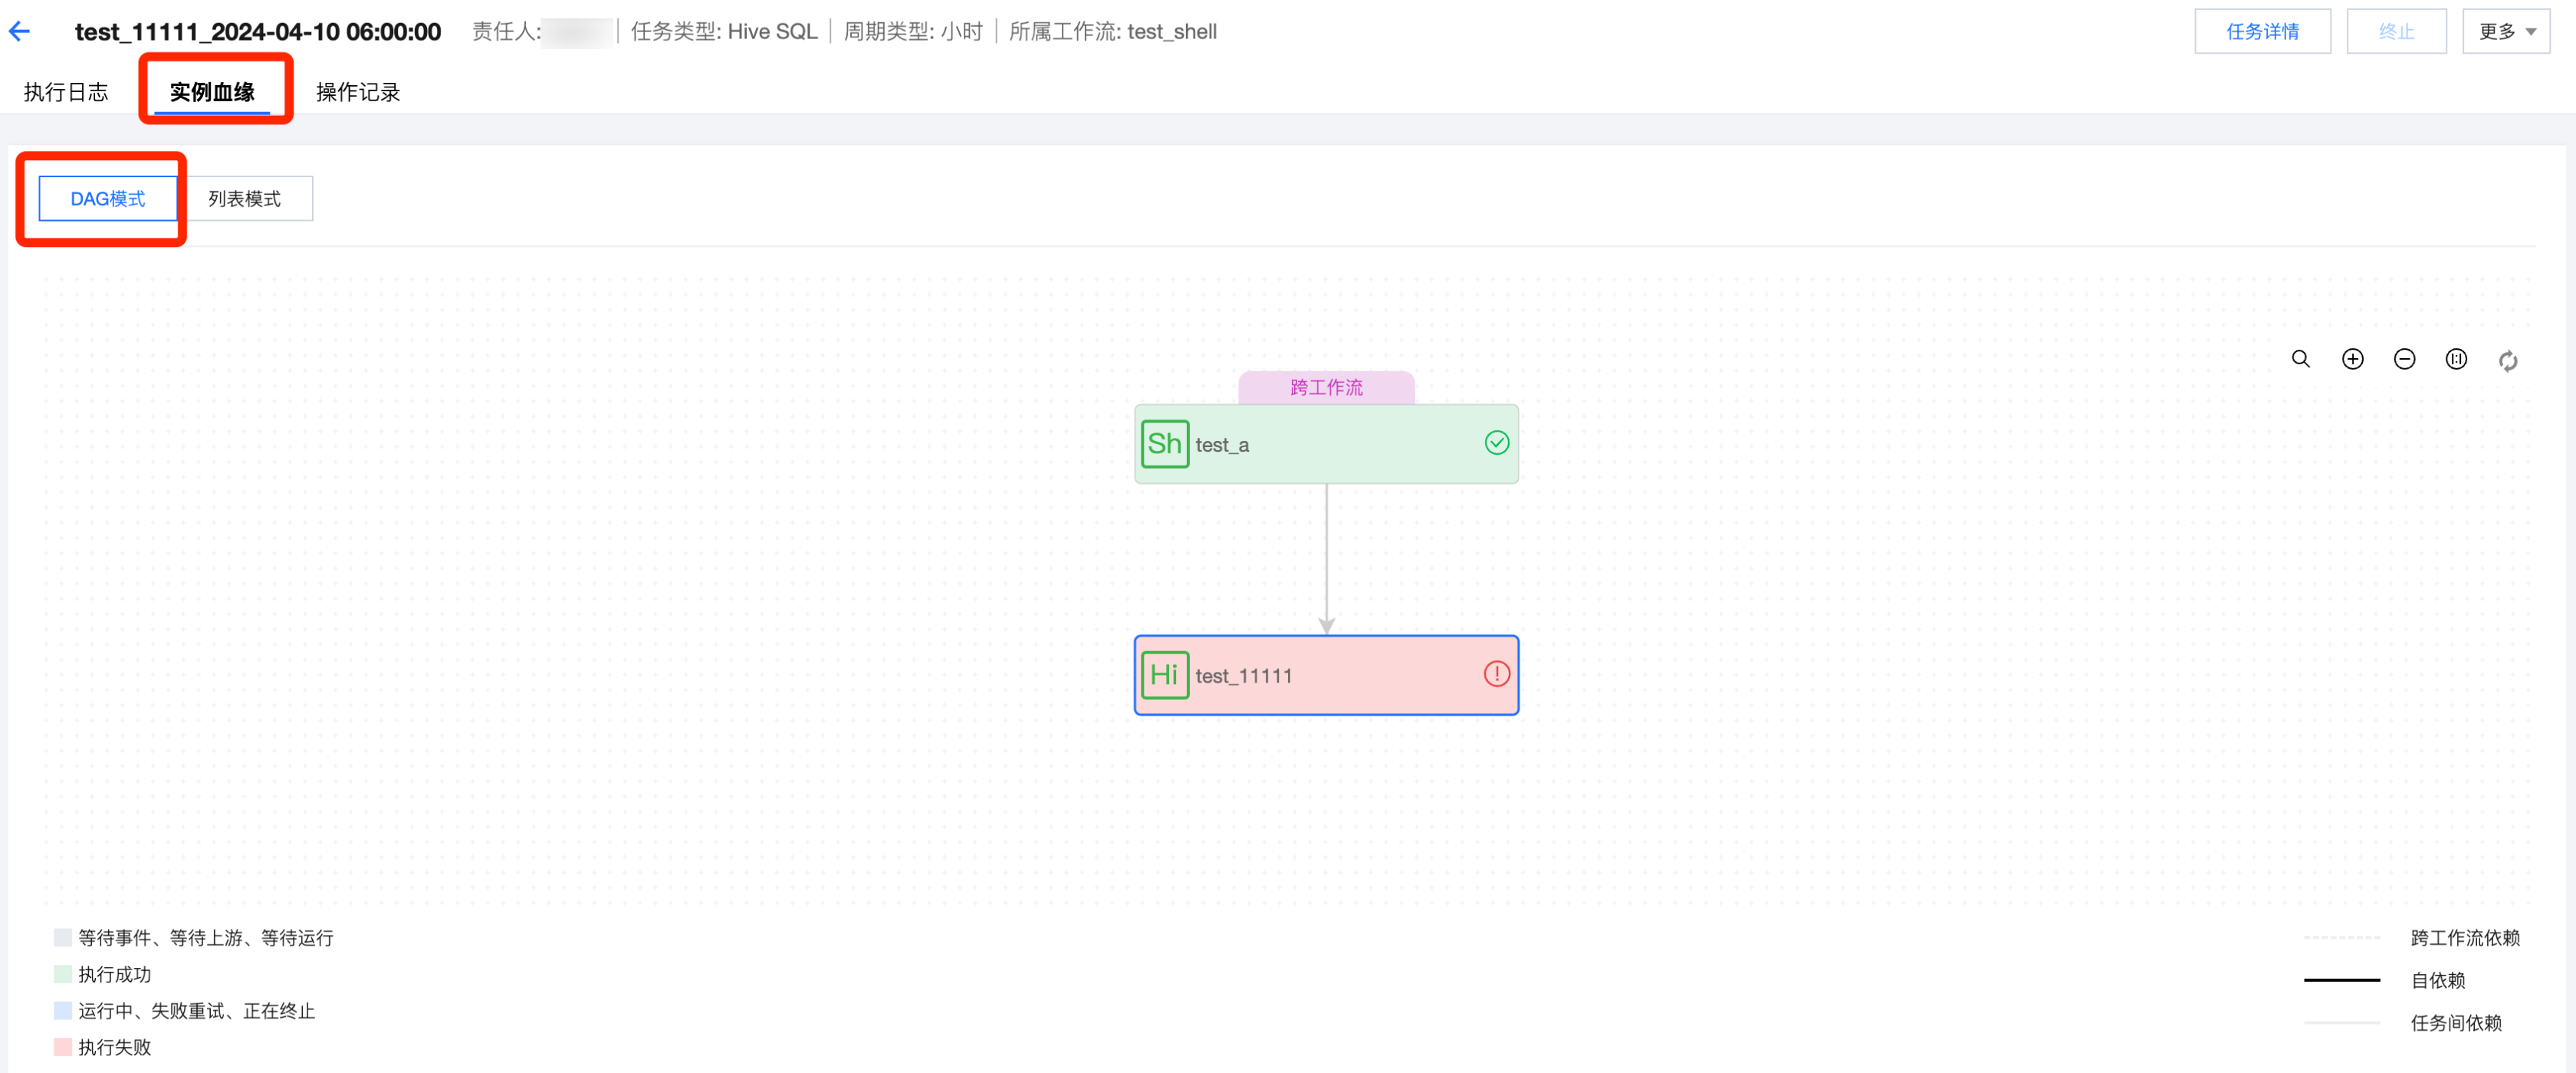 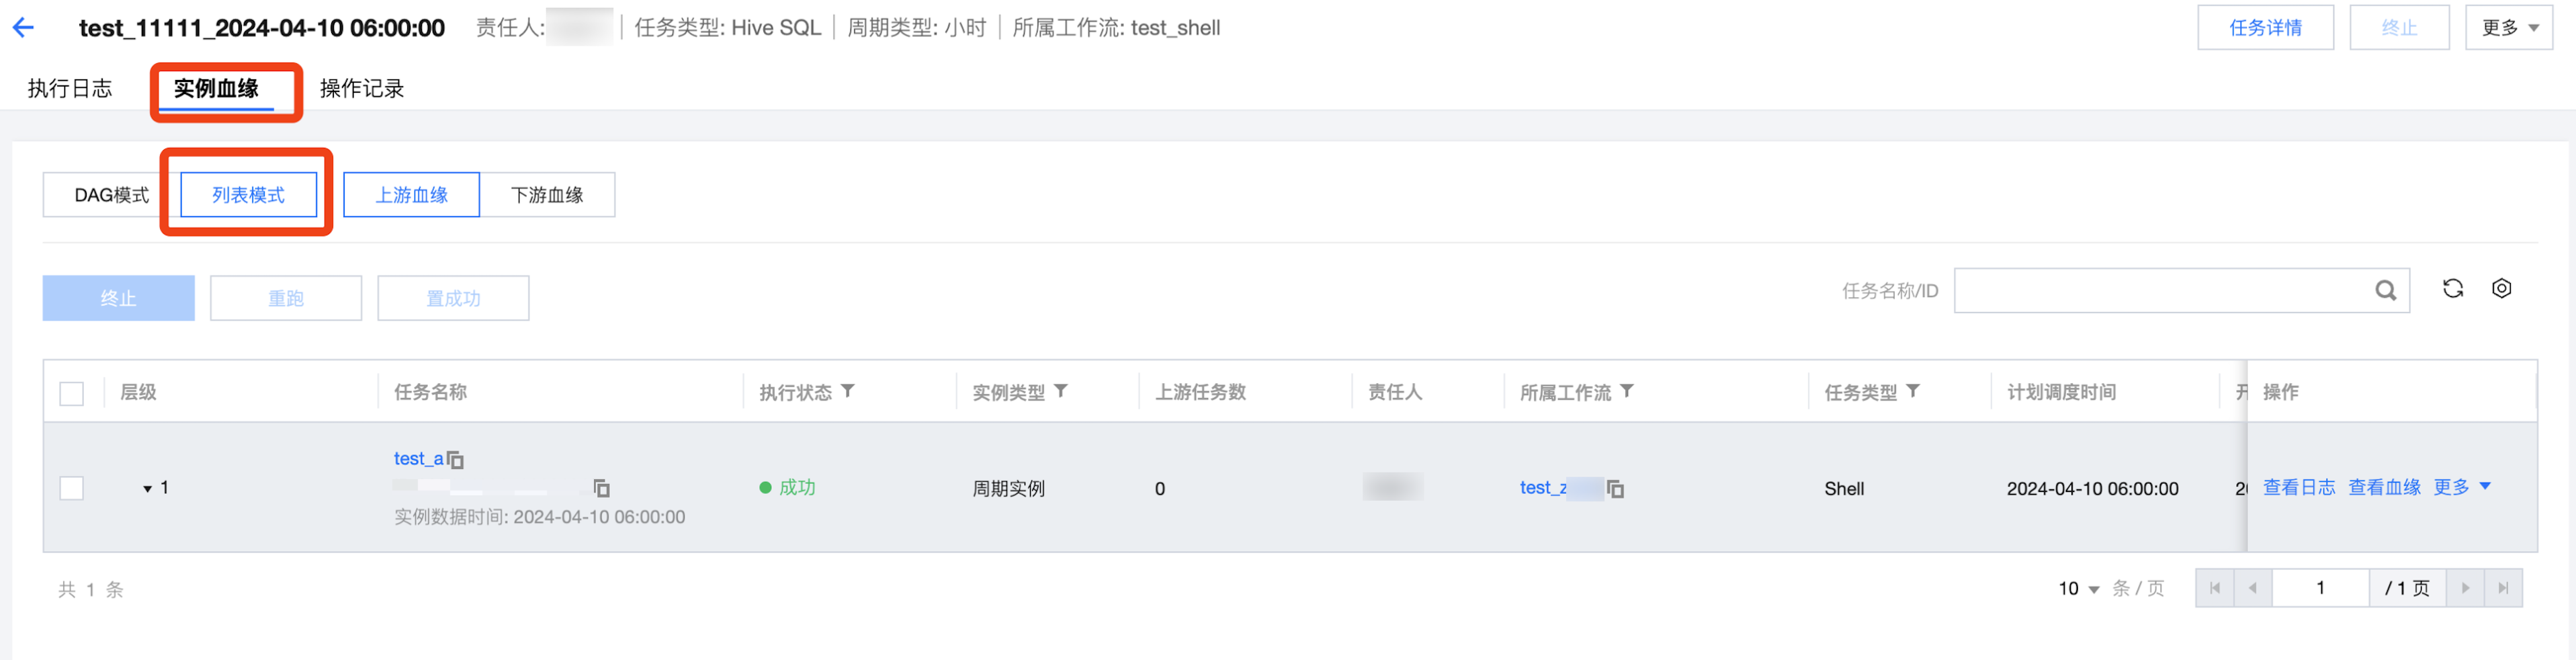 |
操作记录 | 查看对实例的操作记录,包含:置成功、终止、重跑等操作的操作人、操作时间等信息。 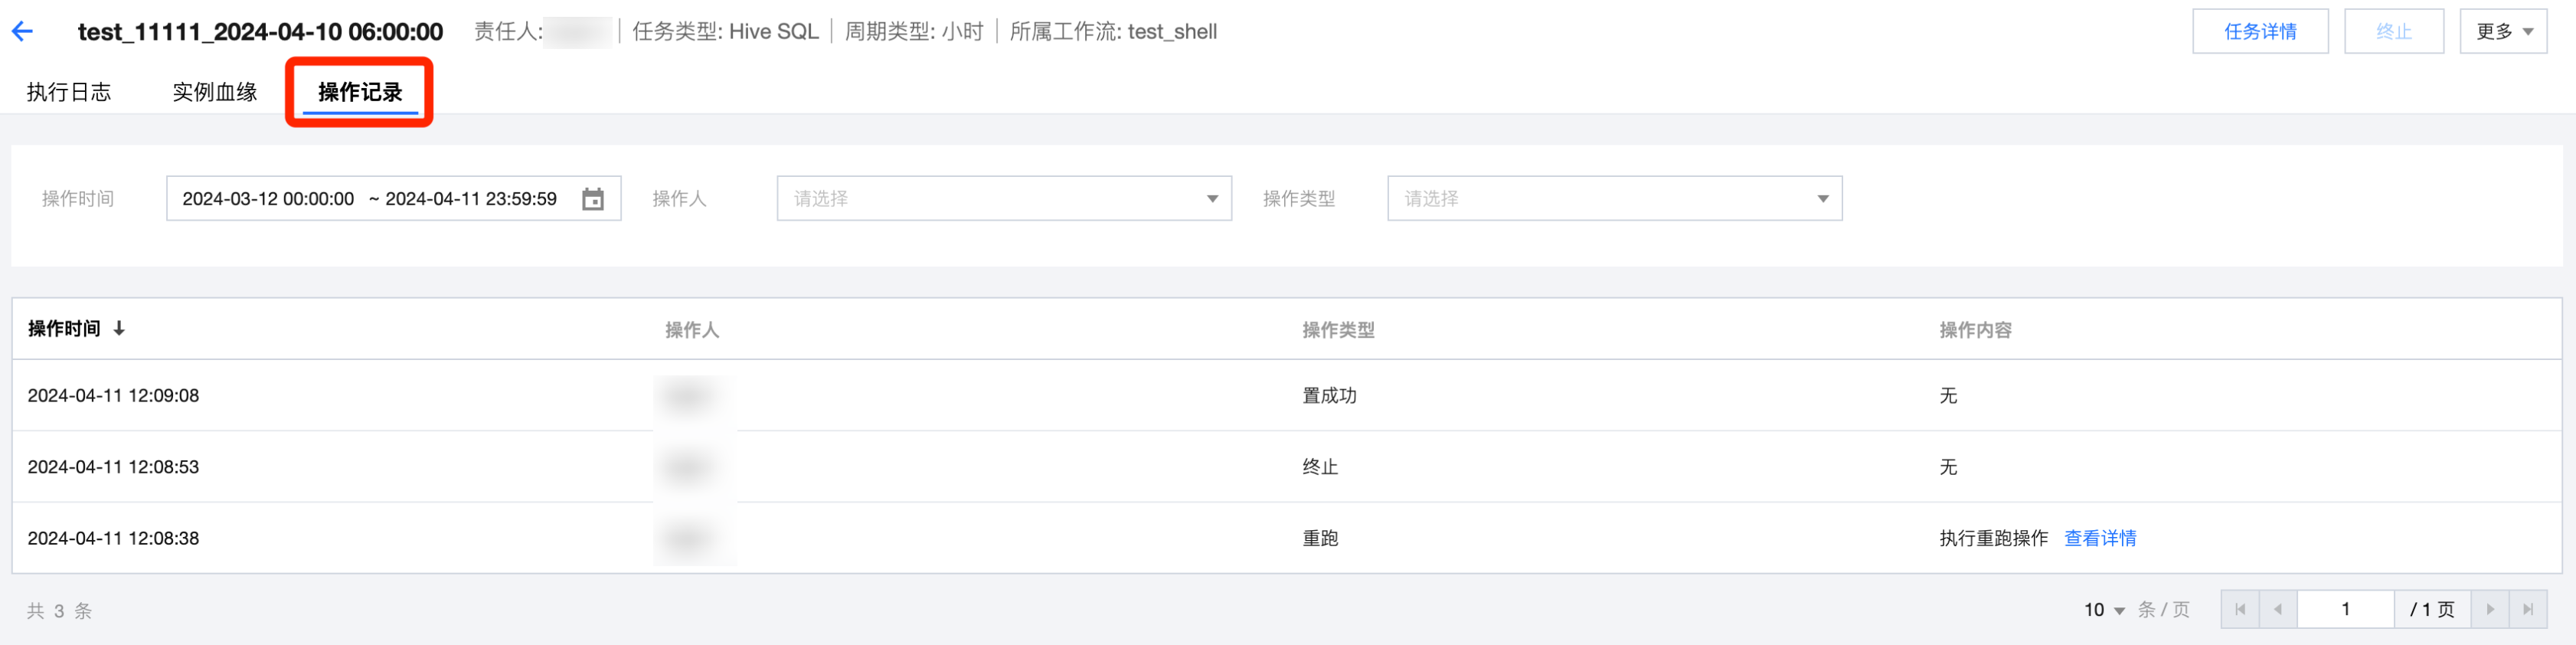 |
查看事件实例列表
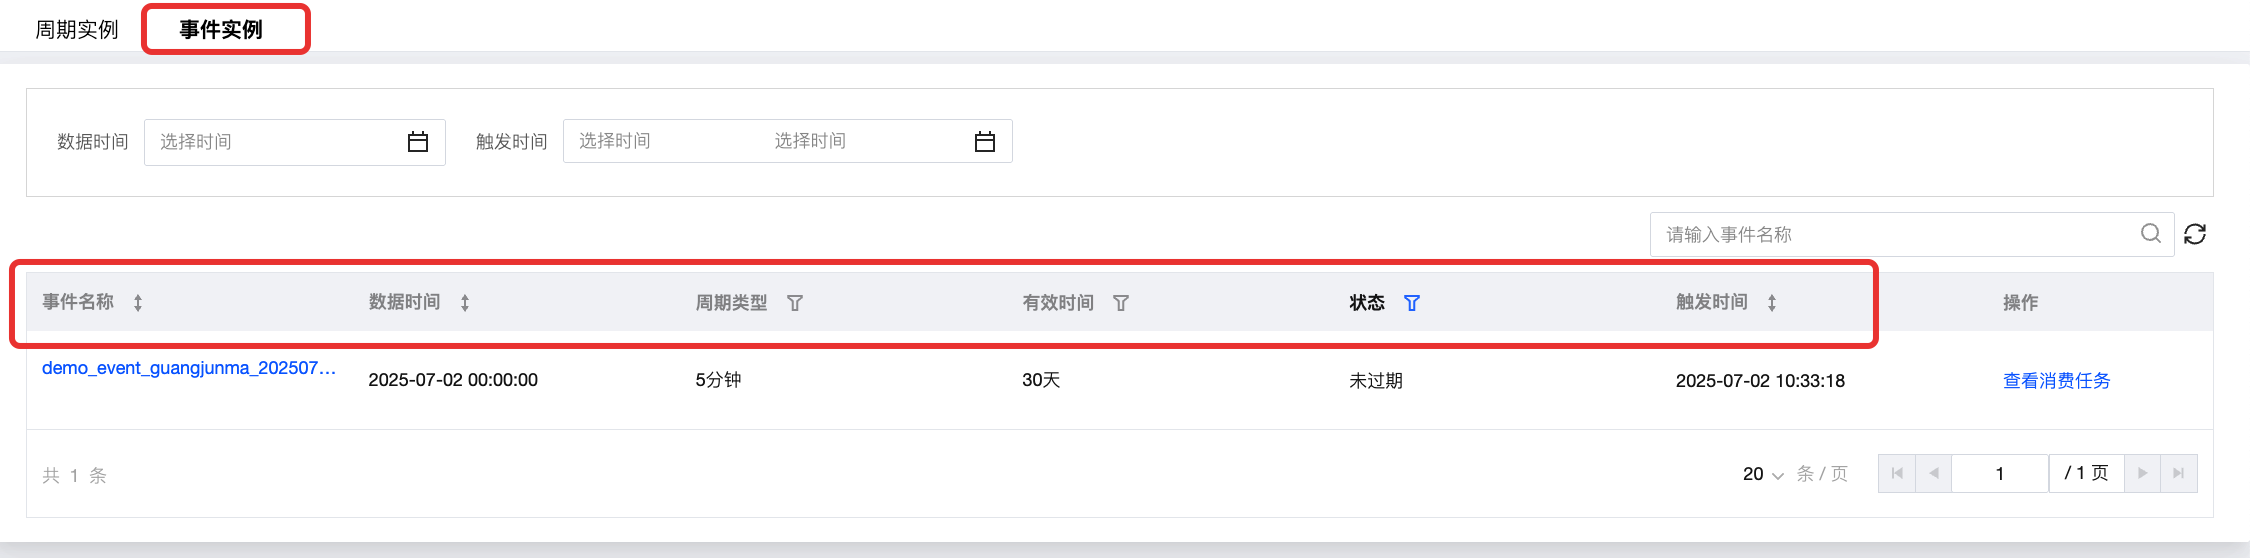
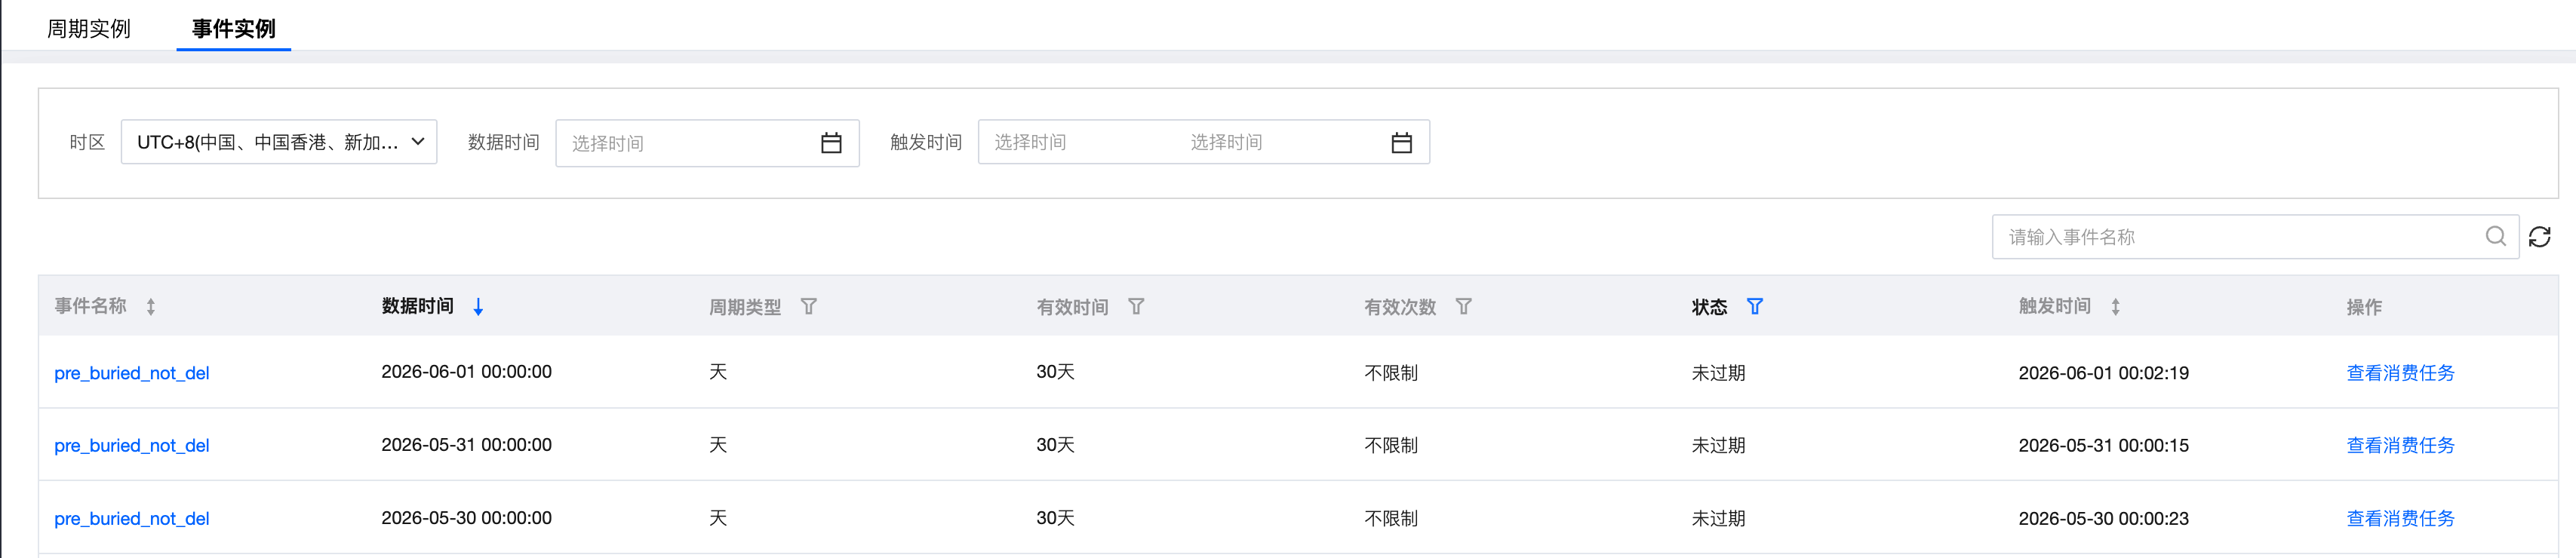
事件实例页面以列表形式展示了计算任务通过调度策略配置的监听事件触发后生成的事件实例信息与操作功能,可以查看事件的消费状态、触发时间、消费时间等信息,可以查看实例的详情信息与消费任务。
事件实例列表信息
功能说明:
信息 | 描述 |
事件名称 | 显示触发事件实例的监听事件名称。单击事件名称可以查看对应监听事件的详细信息,包括周期类型、时间格式、有效时间、描述信息。 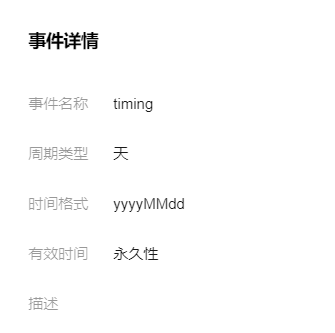 |
数据时间 | 显示触发该事件实例的任务实例计划调度时间。 |
周期类型 | 显示事件实例的触发周期类型,包括天、小时、分钟、秒。 |
有效时间 | 显示触发该事件实例的计算任务对应的调度配置中,预设的事件等待时间,超过该时间事件未触发,则任务实例自动终止。 |
状态 | 显示事件实例的被消费状态,包括未过期、已过期。 |
触发时间 | 显示触发事件实例的日期时间。 |
事件实例操作
操作 | 描述 |
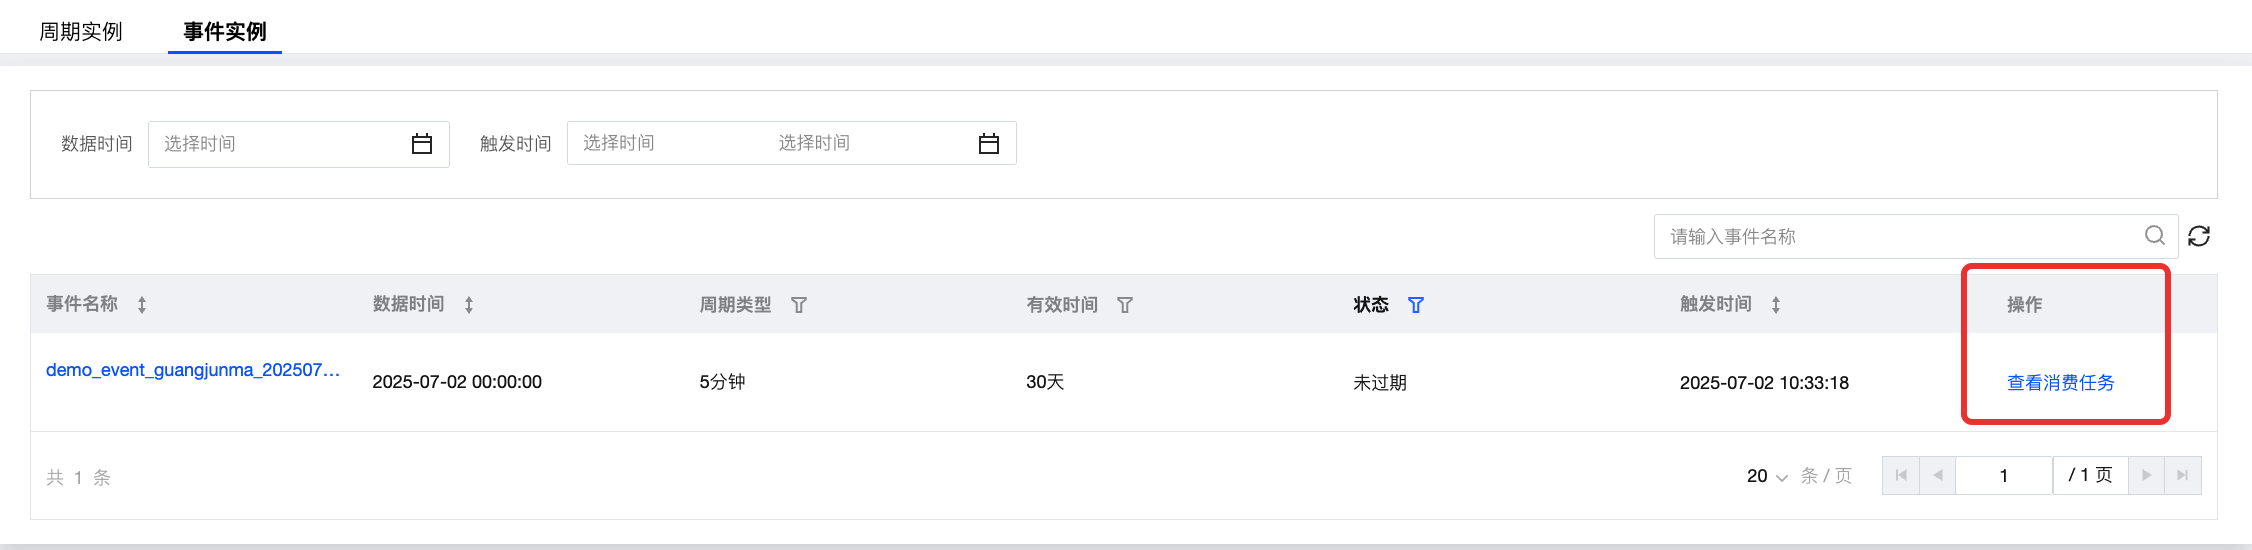
查看消费任务 | 单击事件实例列表下的查看消费任务,可以查看触发了事件实例的计算任务信息。 |
事件实例筛选
操作 | 描述 |
筛选项 - 列表上方 | 支持按照时区、数据时间、触发时间、事件名称进行筛选。 |
筛选项 - 列表内 | 支持按照周期类型、有效时间、有效次数、状态进行筛选。 |


