操作场景
微搭官方组件库已经提供了折线图、饼状图、柱状图图表组件,当这些图表组件不能满足实际业务需求时,可以用“更多图表”组件,这是一个通用的图表组件,可配置出多种复杂图表,使用该组件,可实现快速引入所有的 Echarts 图表。
操作步骤
更多图表组件引用复杂折线图
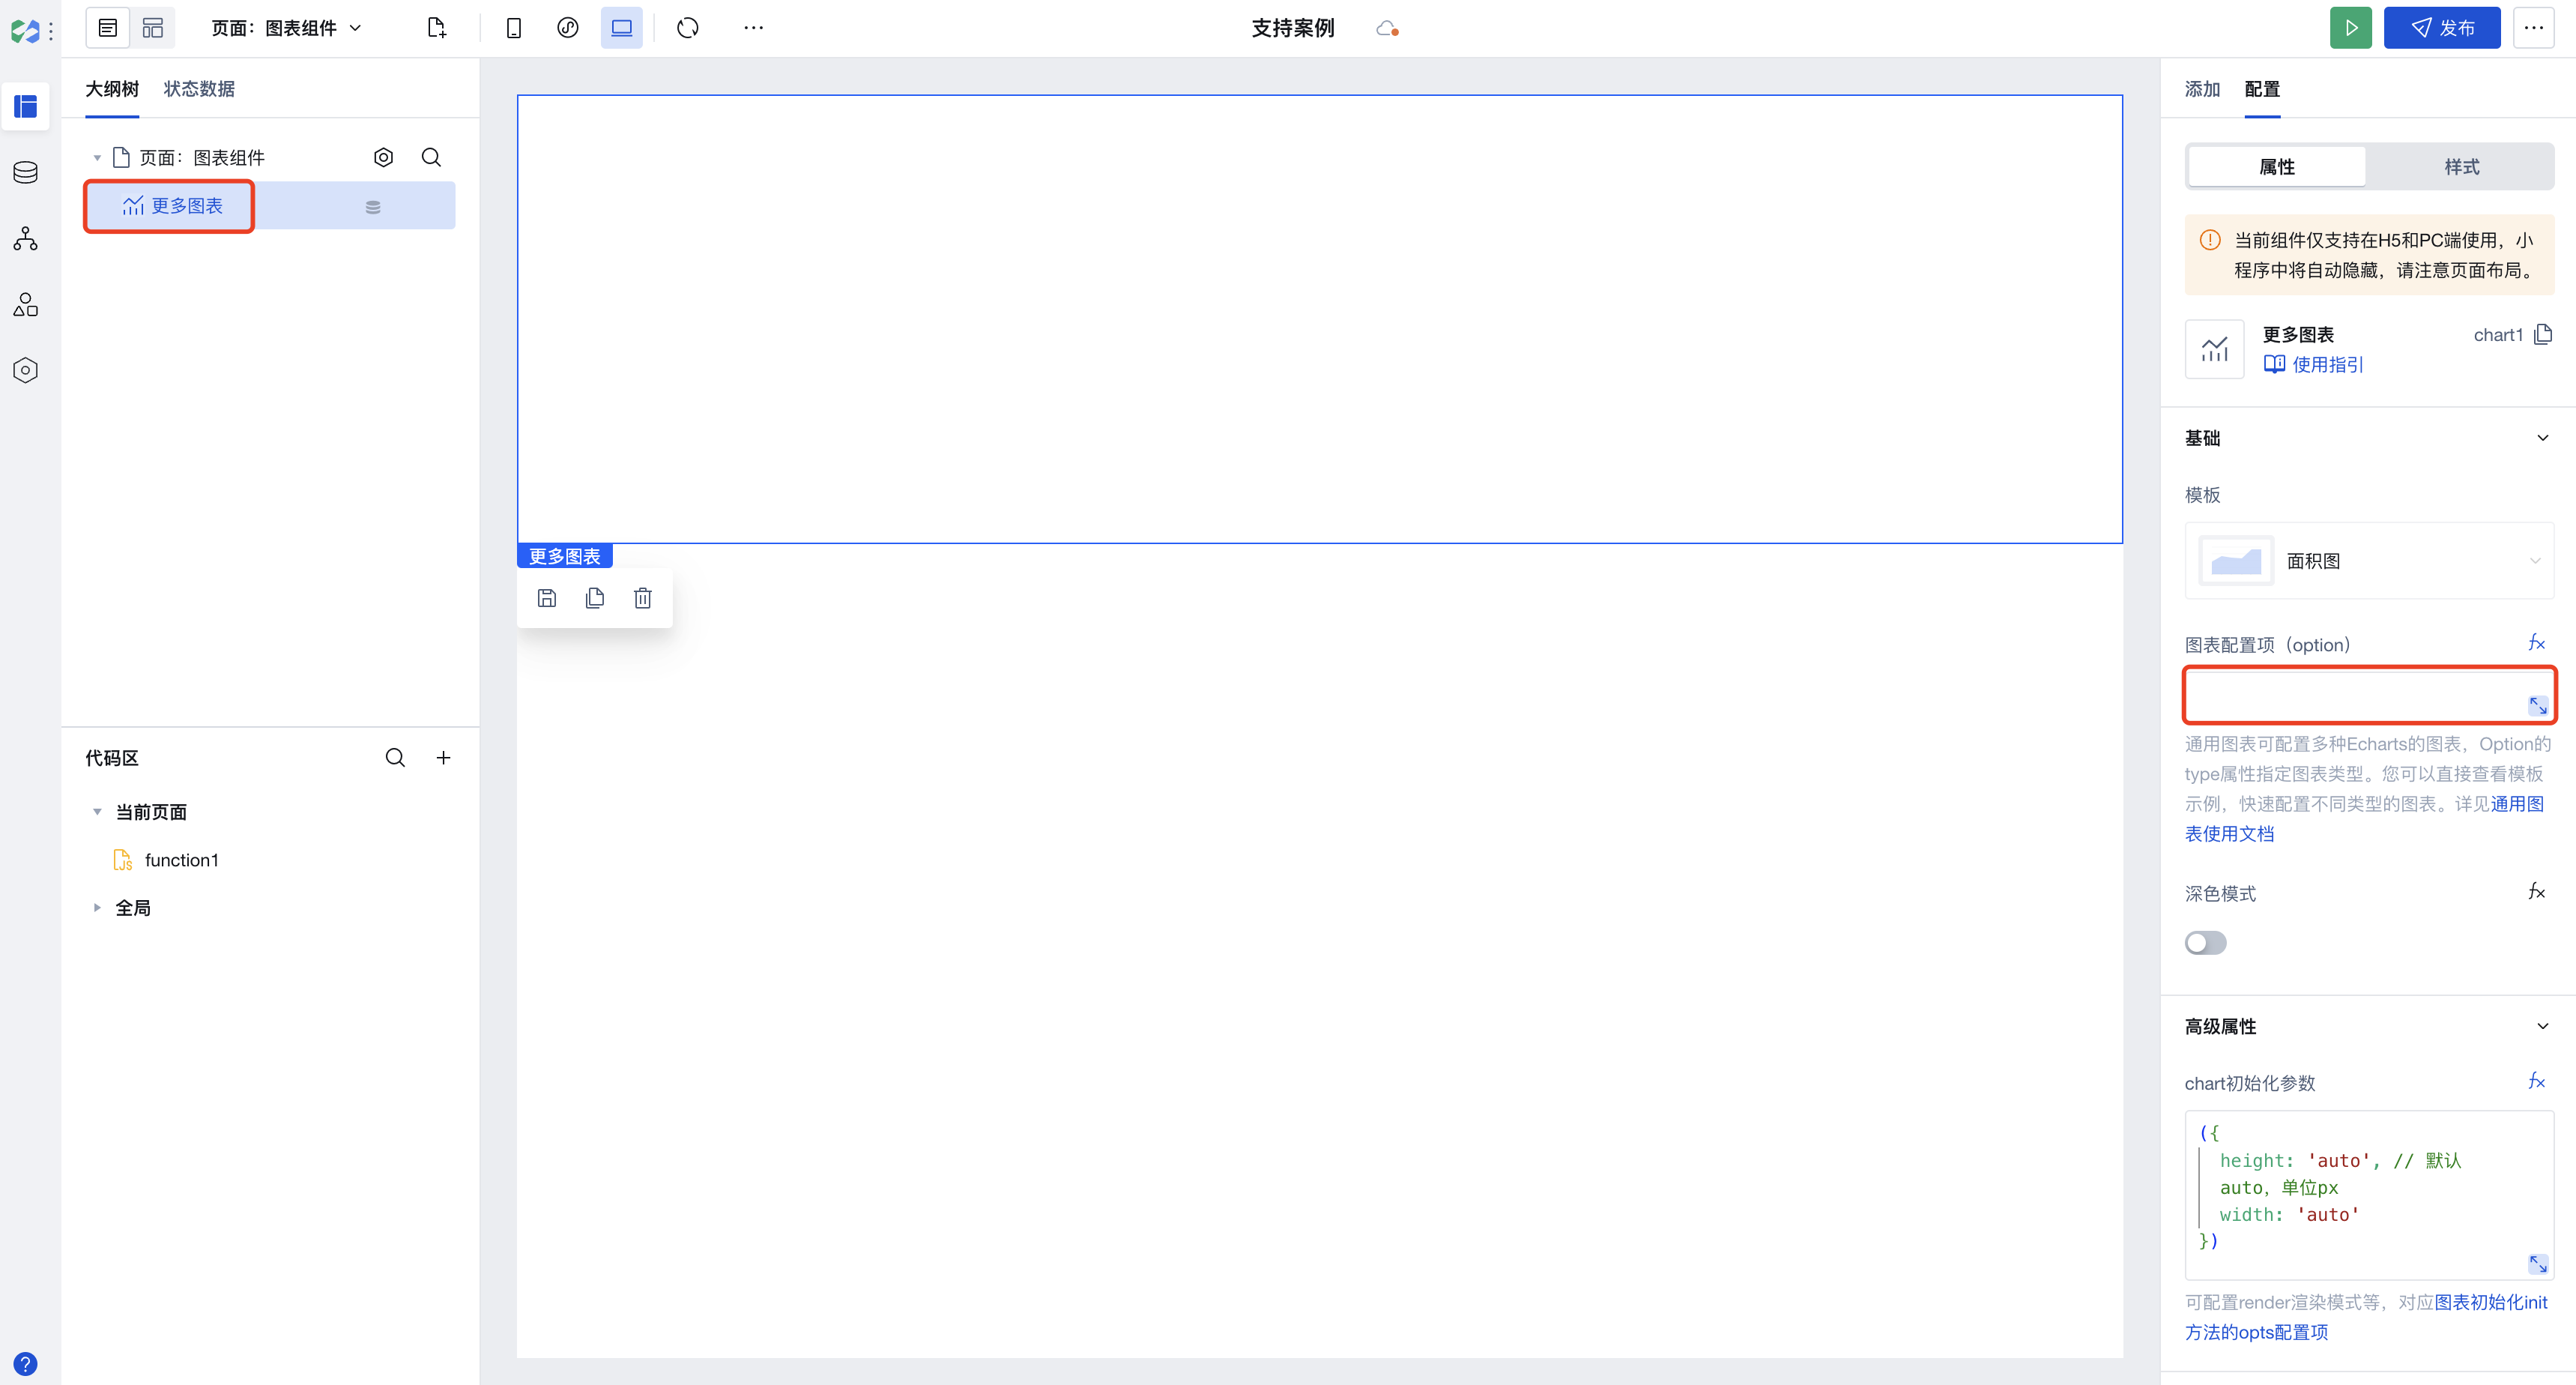
1. 请前往 微搭控制台,创建空白应用。在编辑器中使用更多图表组件,并将图表默认配置项清除。

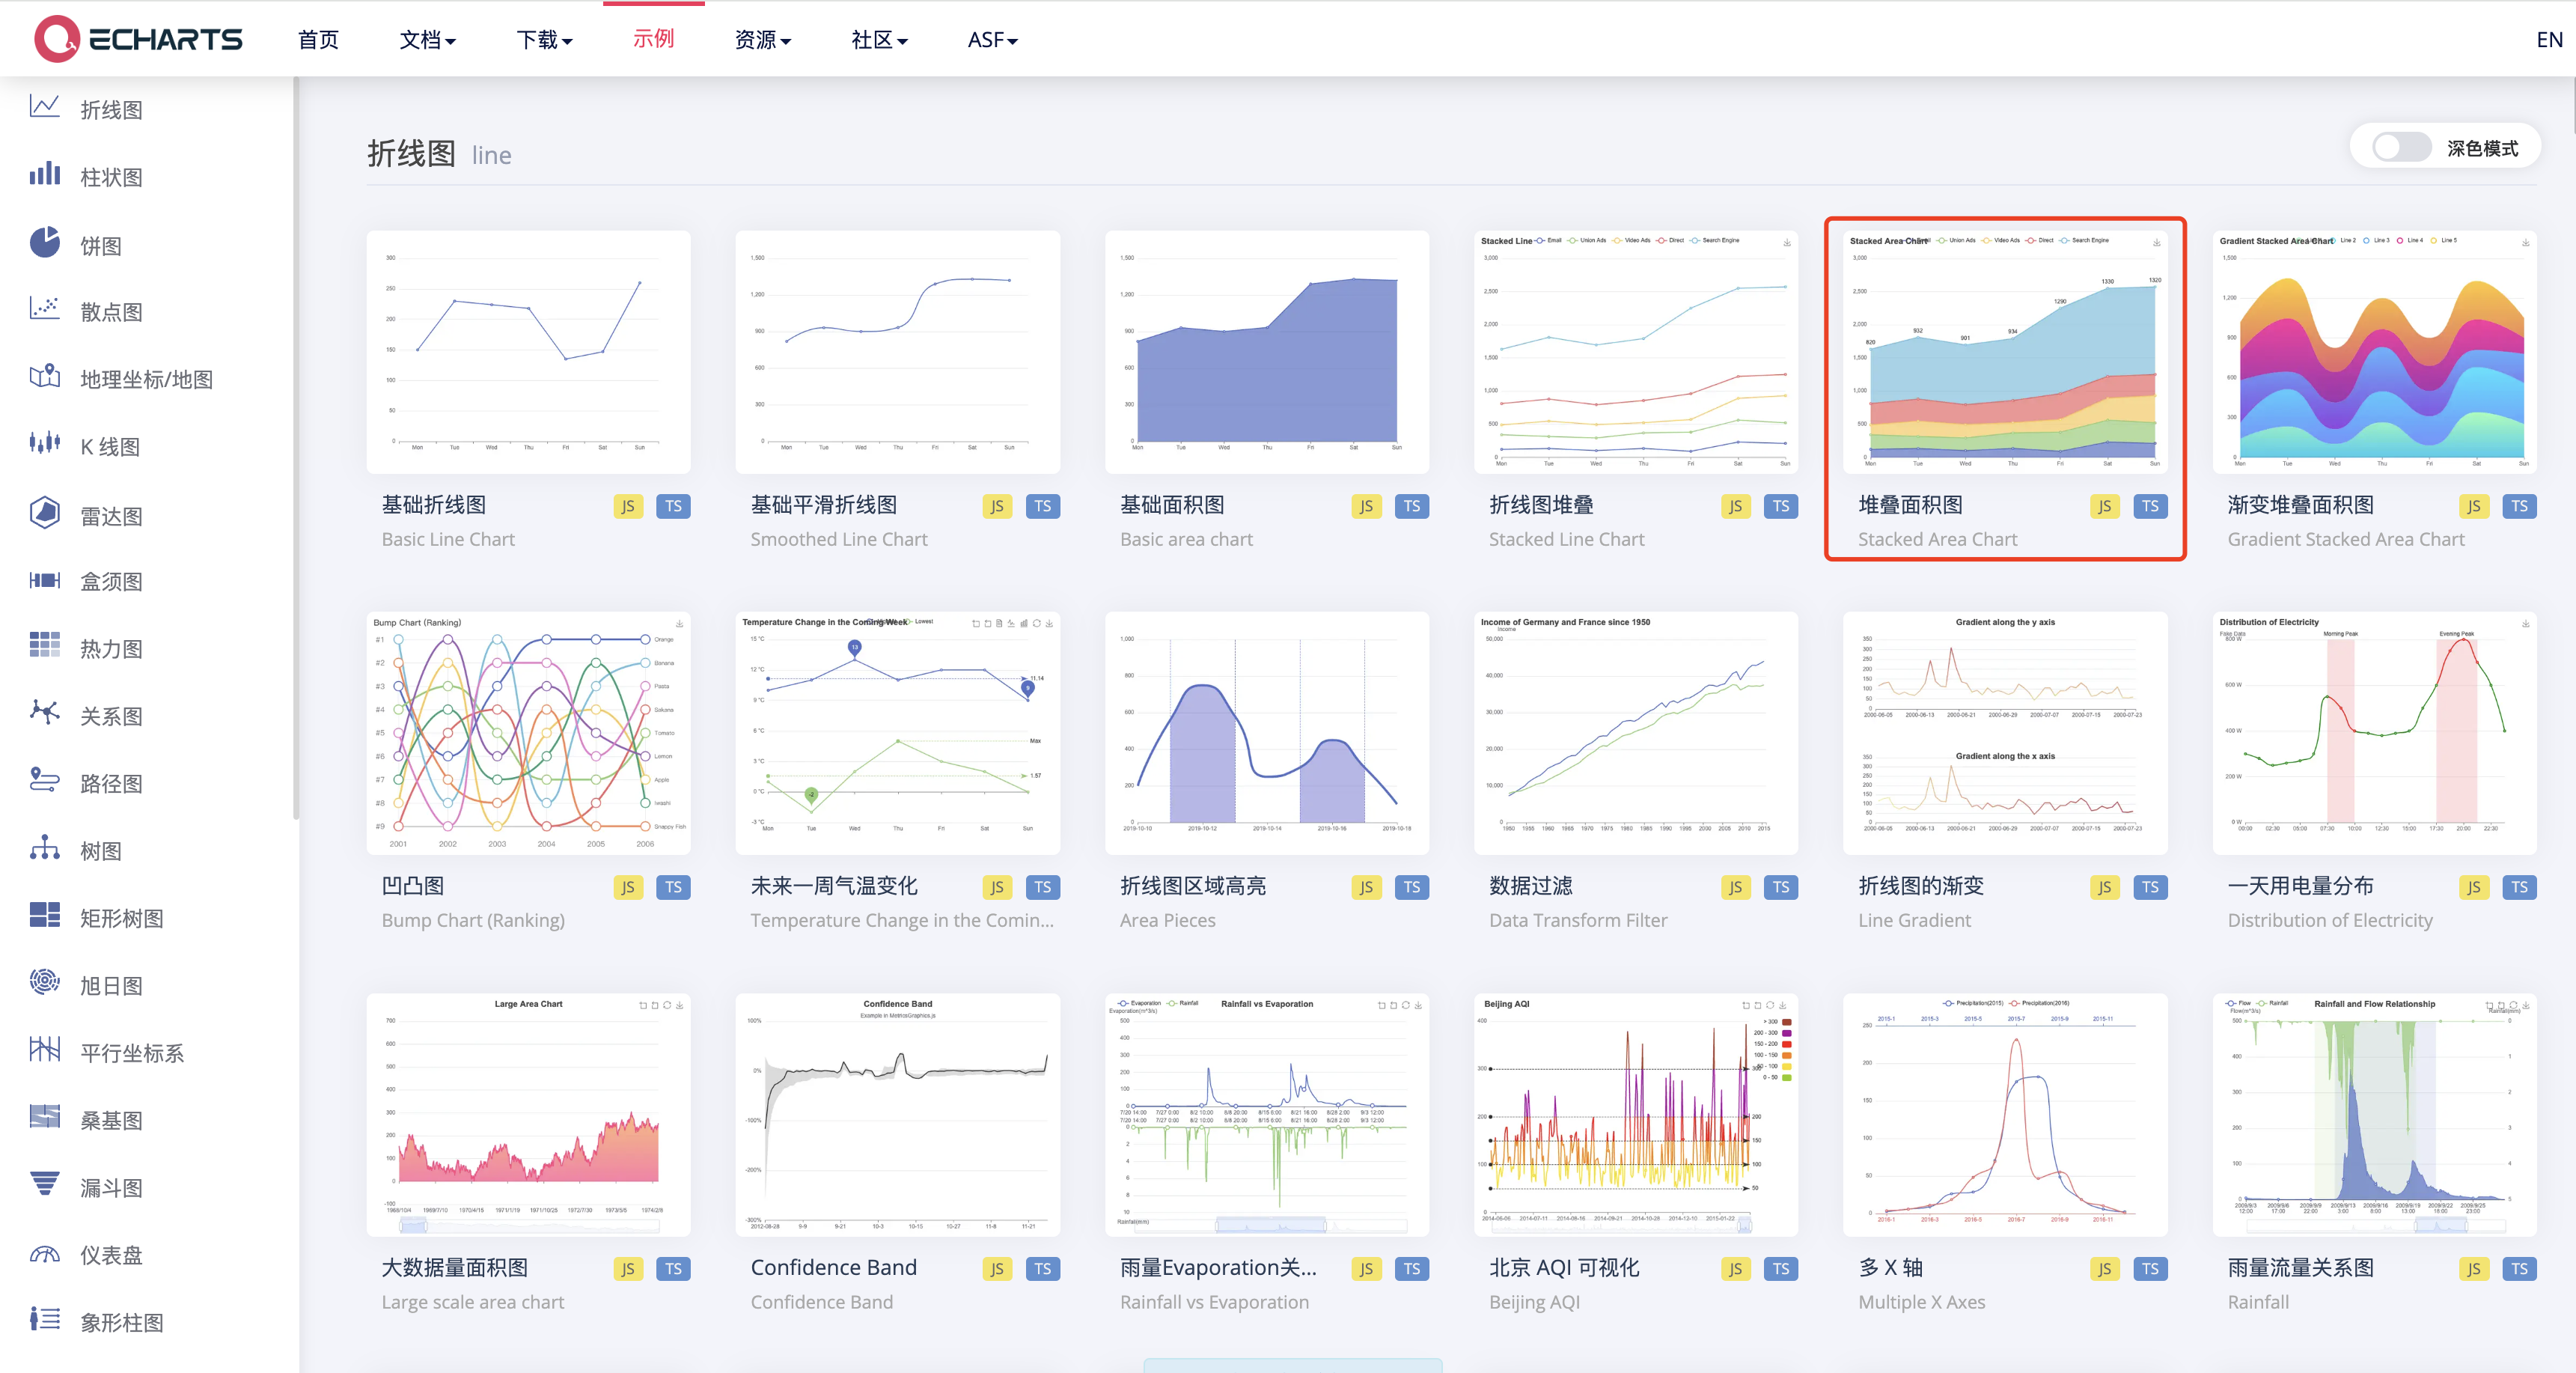
2. 前往 Echarts 官网 查看应用示例,选择堆叠面积图。

3. 复制堆叠面积图示例 option 配置。
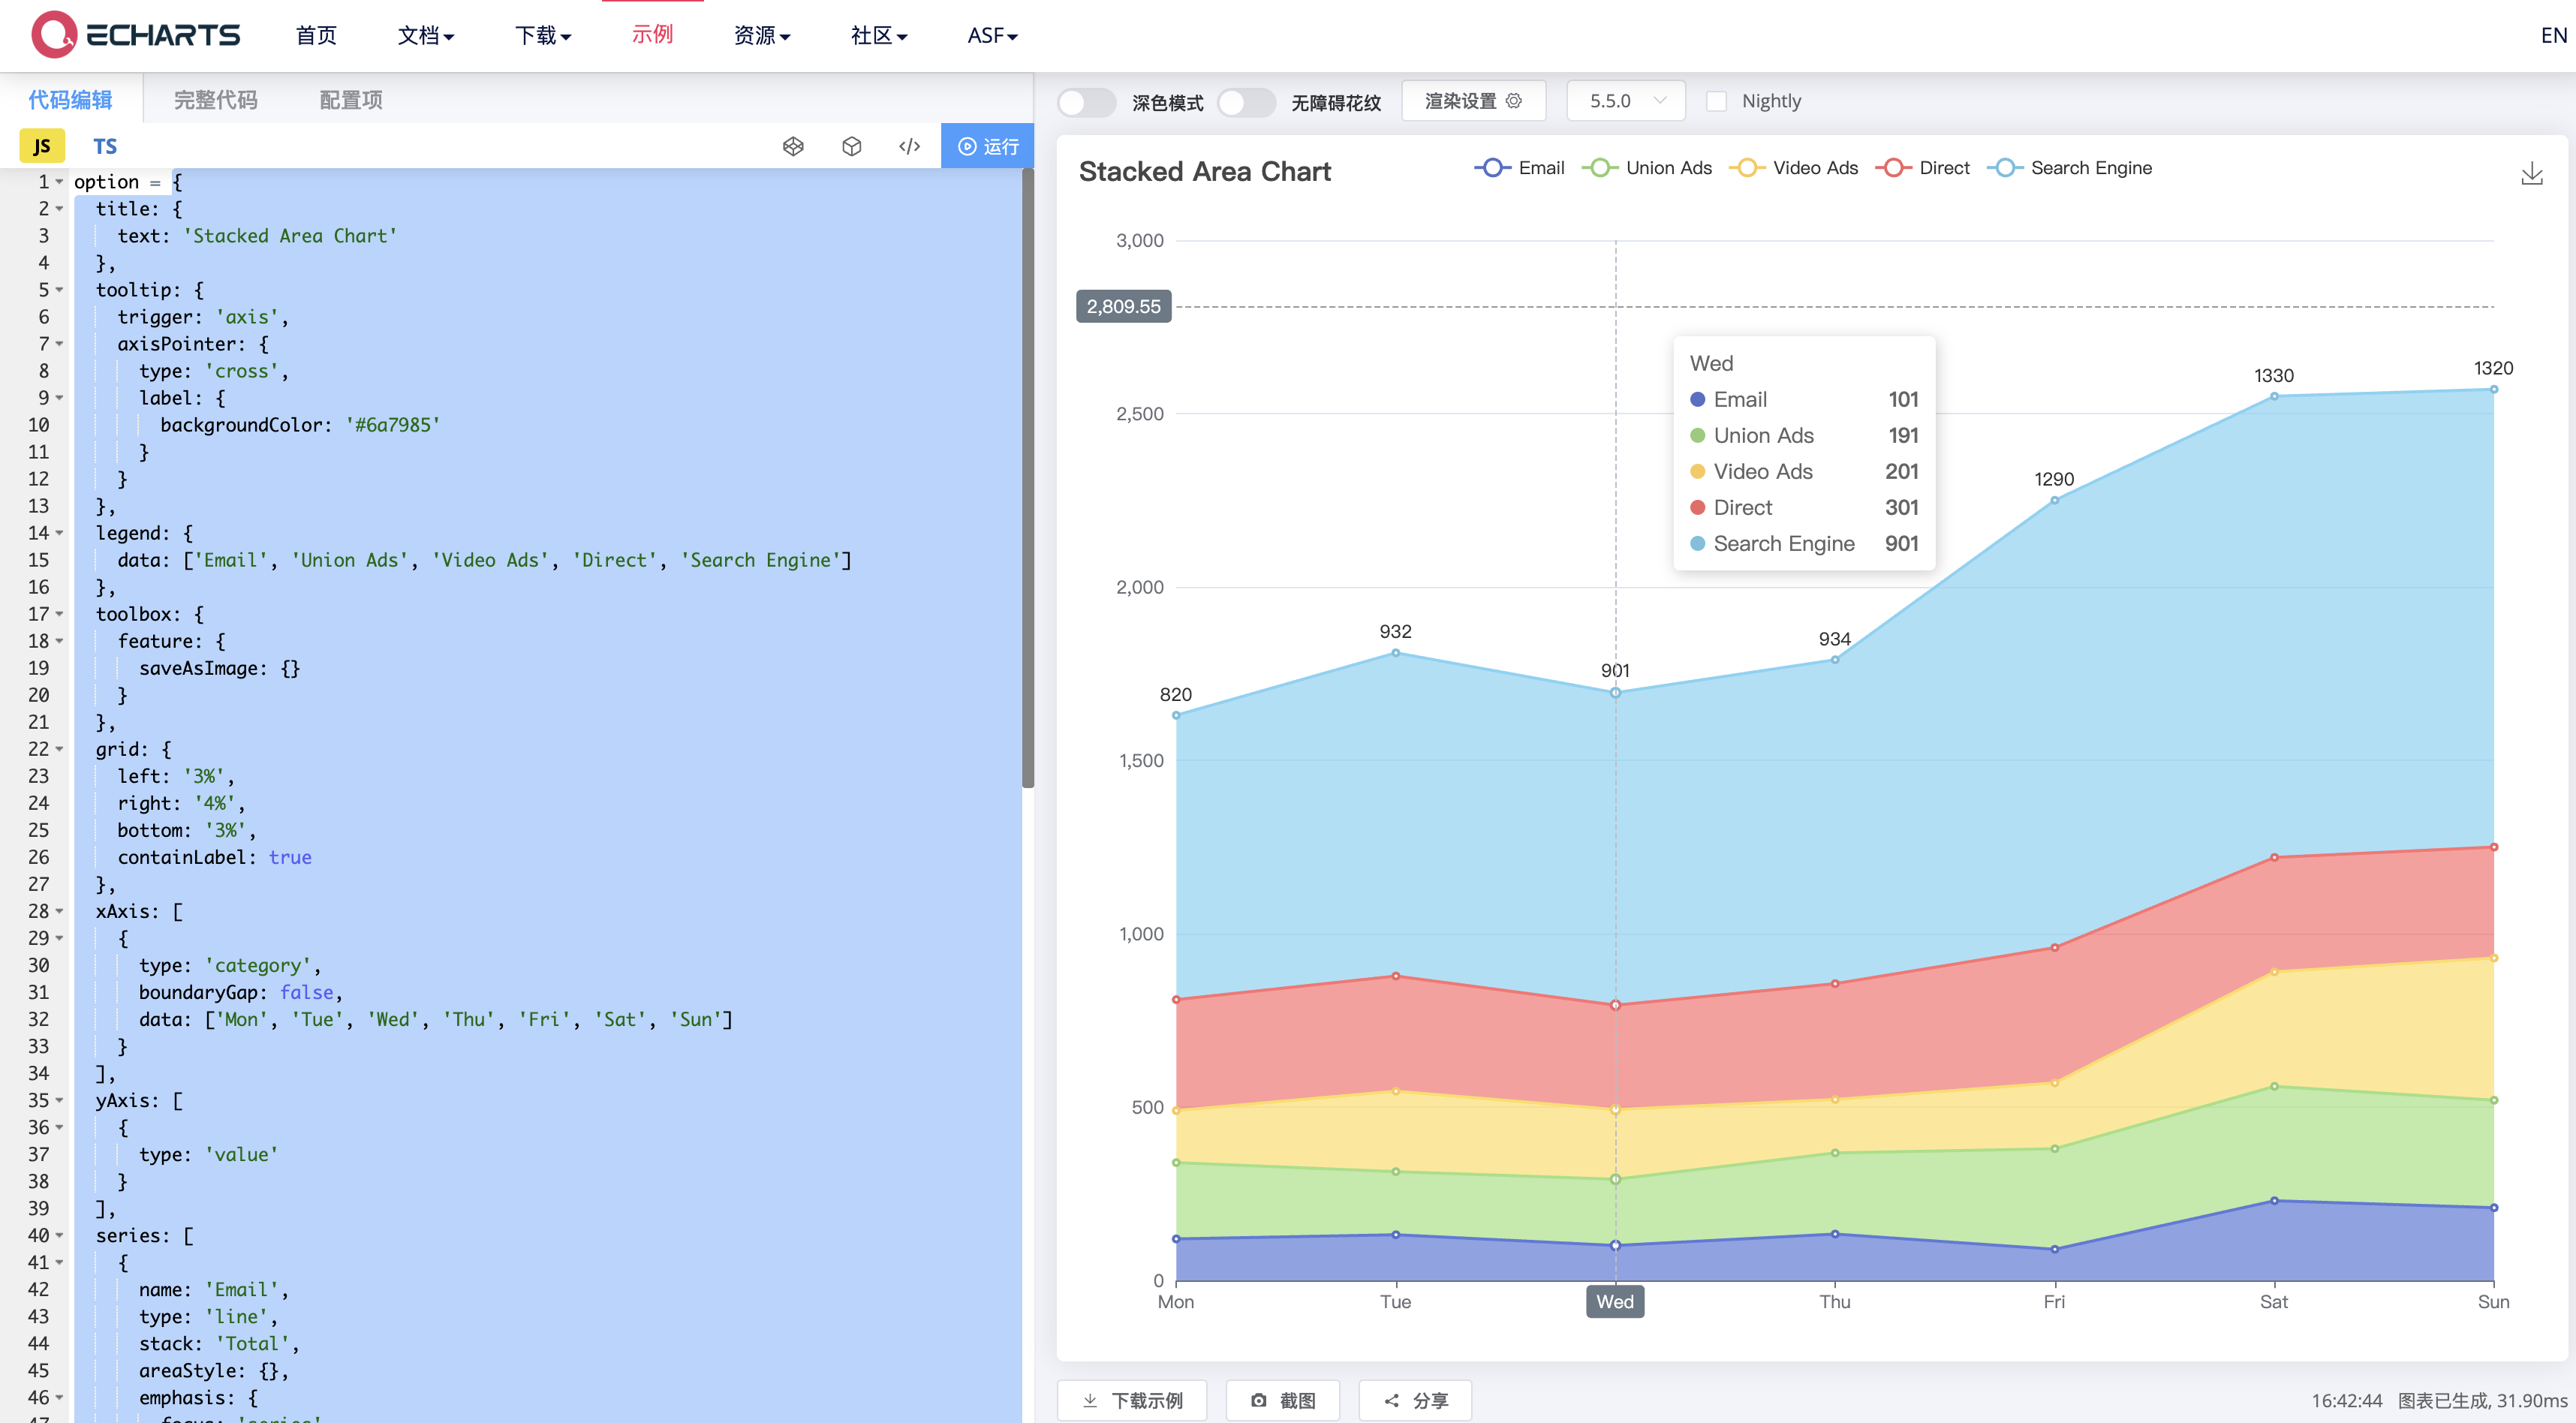

4. 返回微搭编辑器中,将上述步骤复制的 option 配置粘贴至图表配置项。
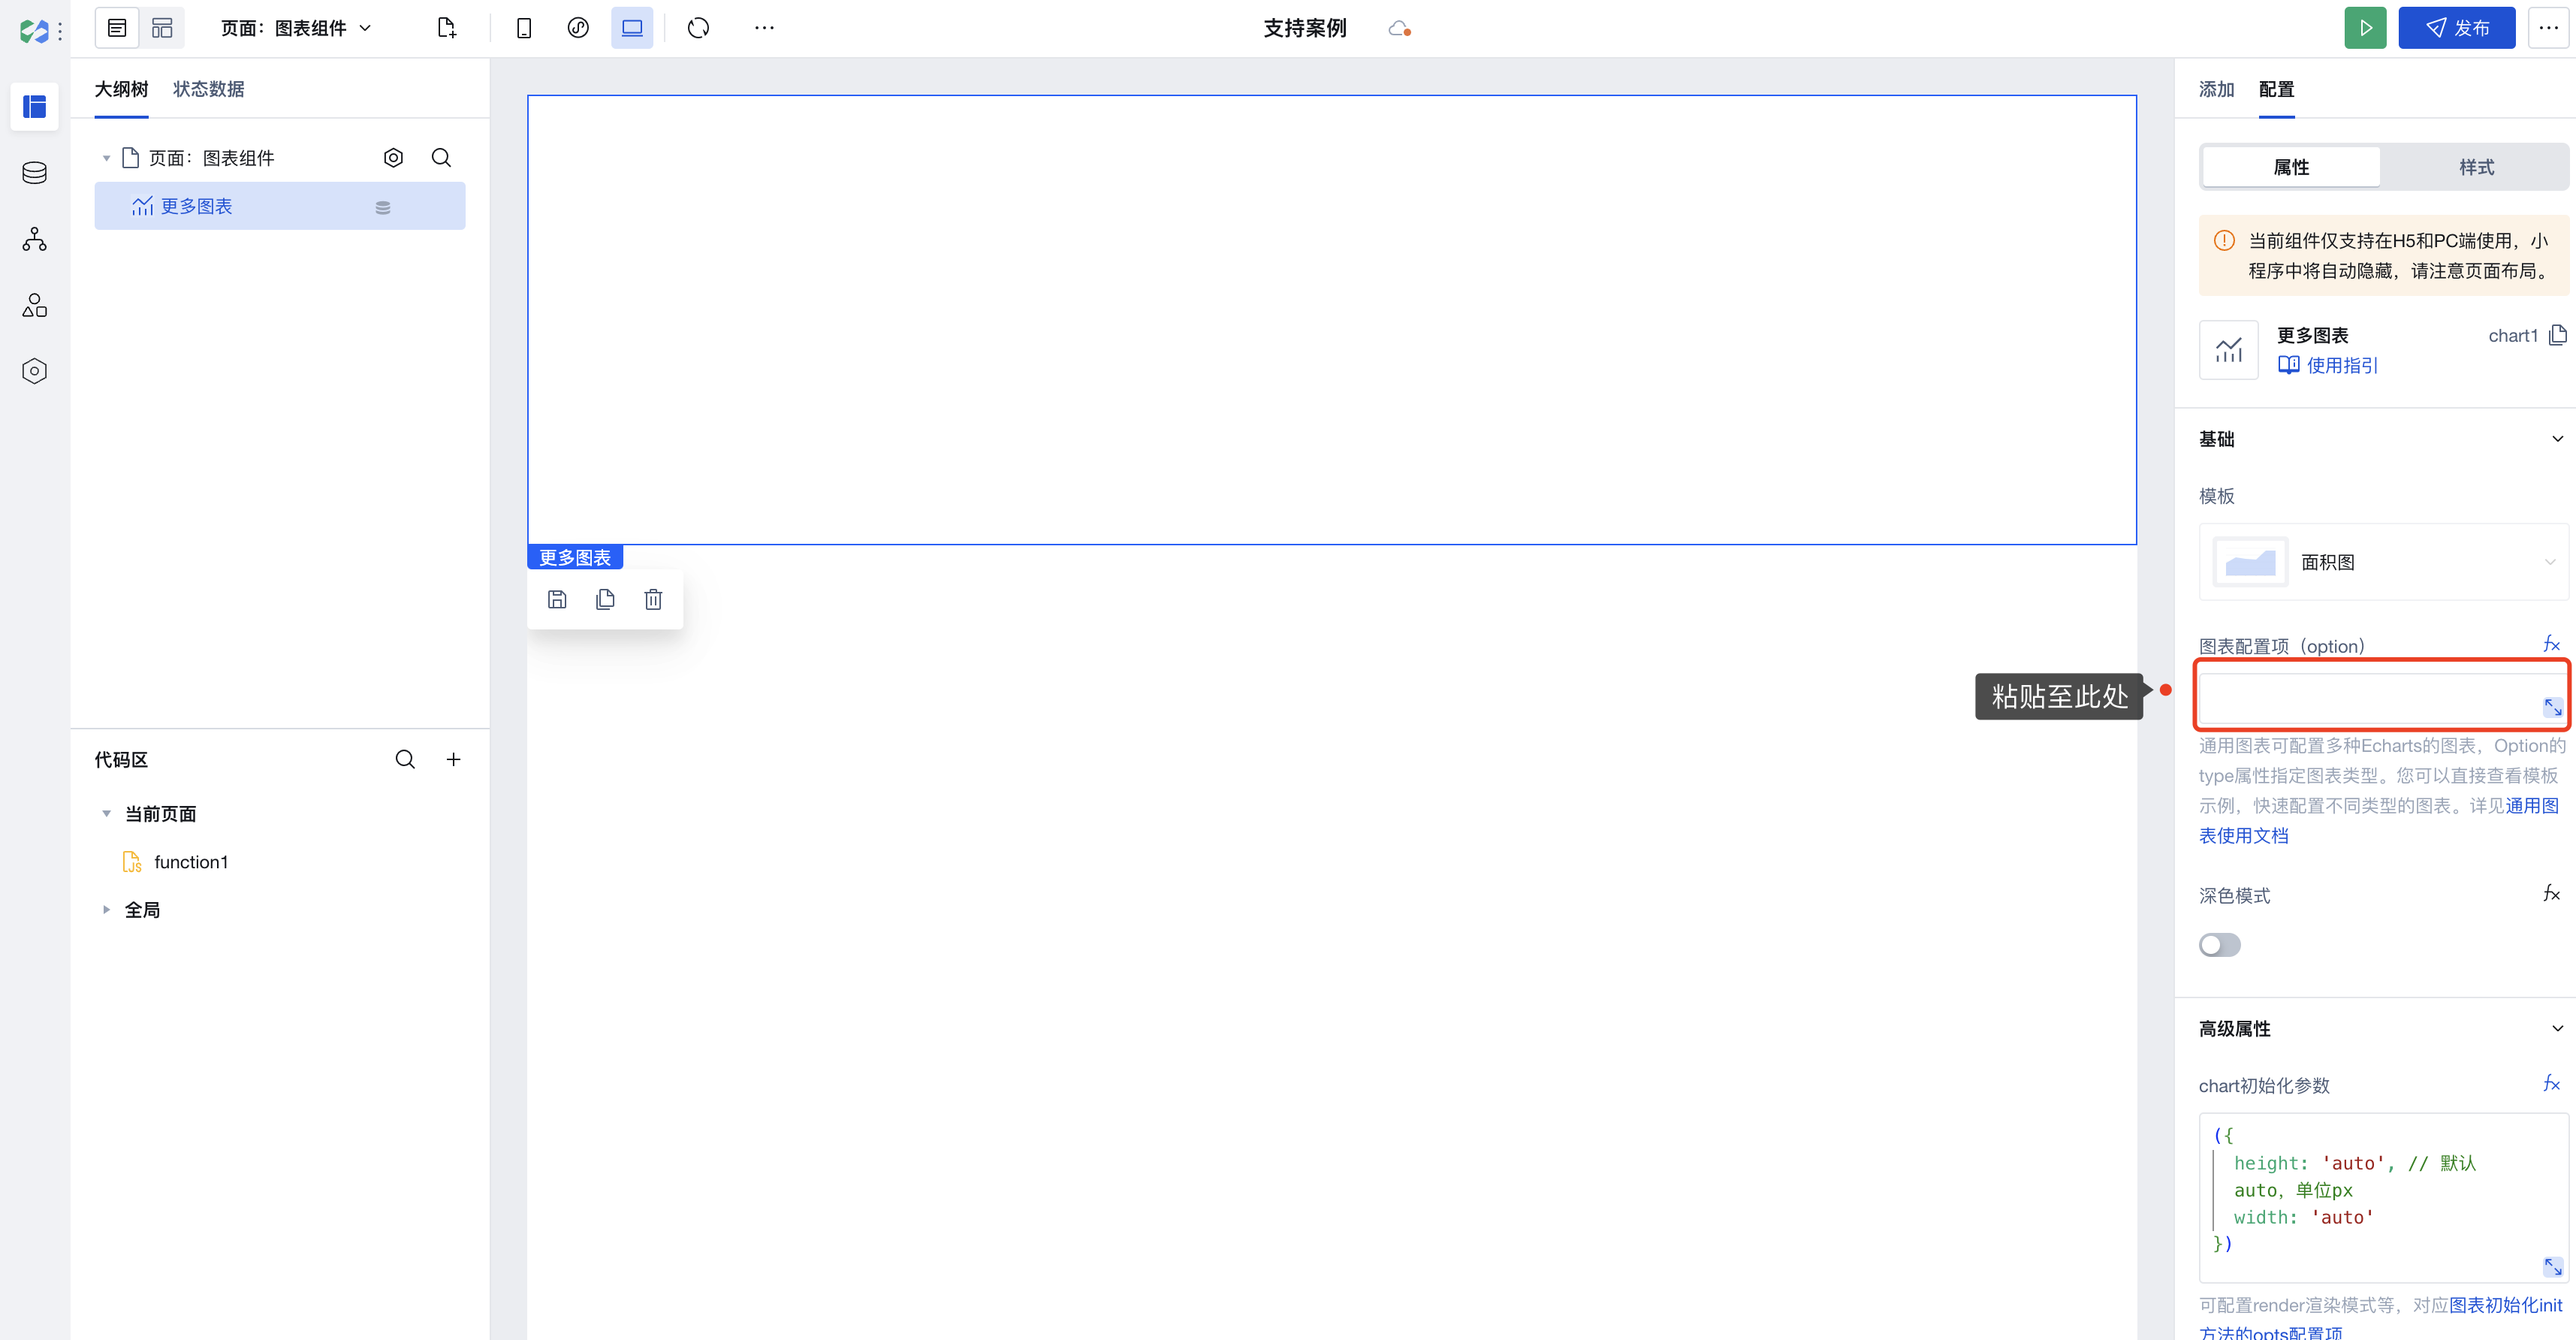

5. 图表配置项粘贴完成。
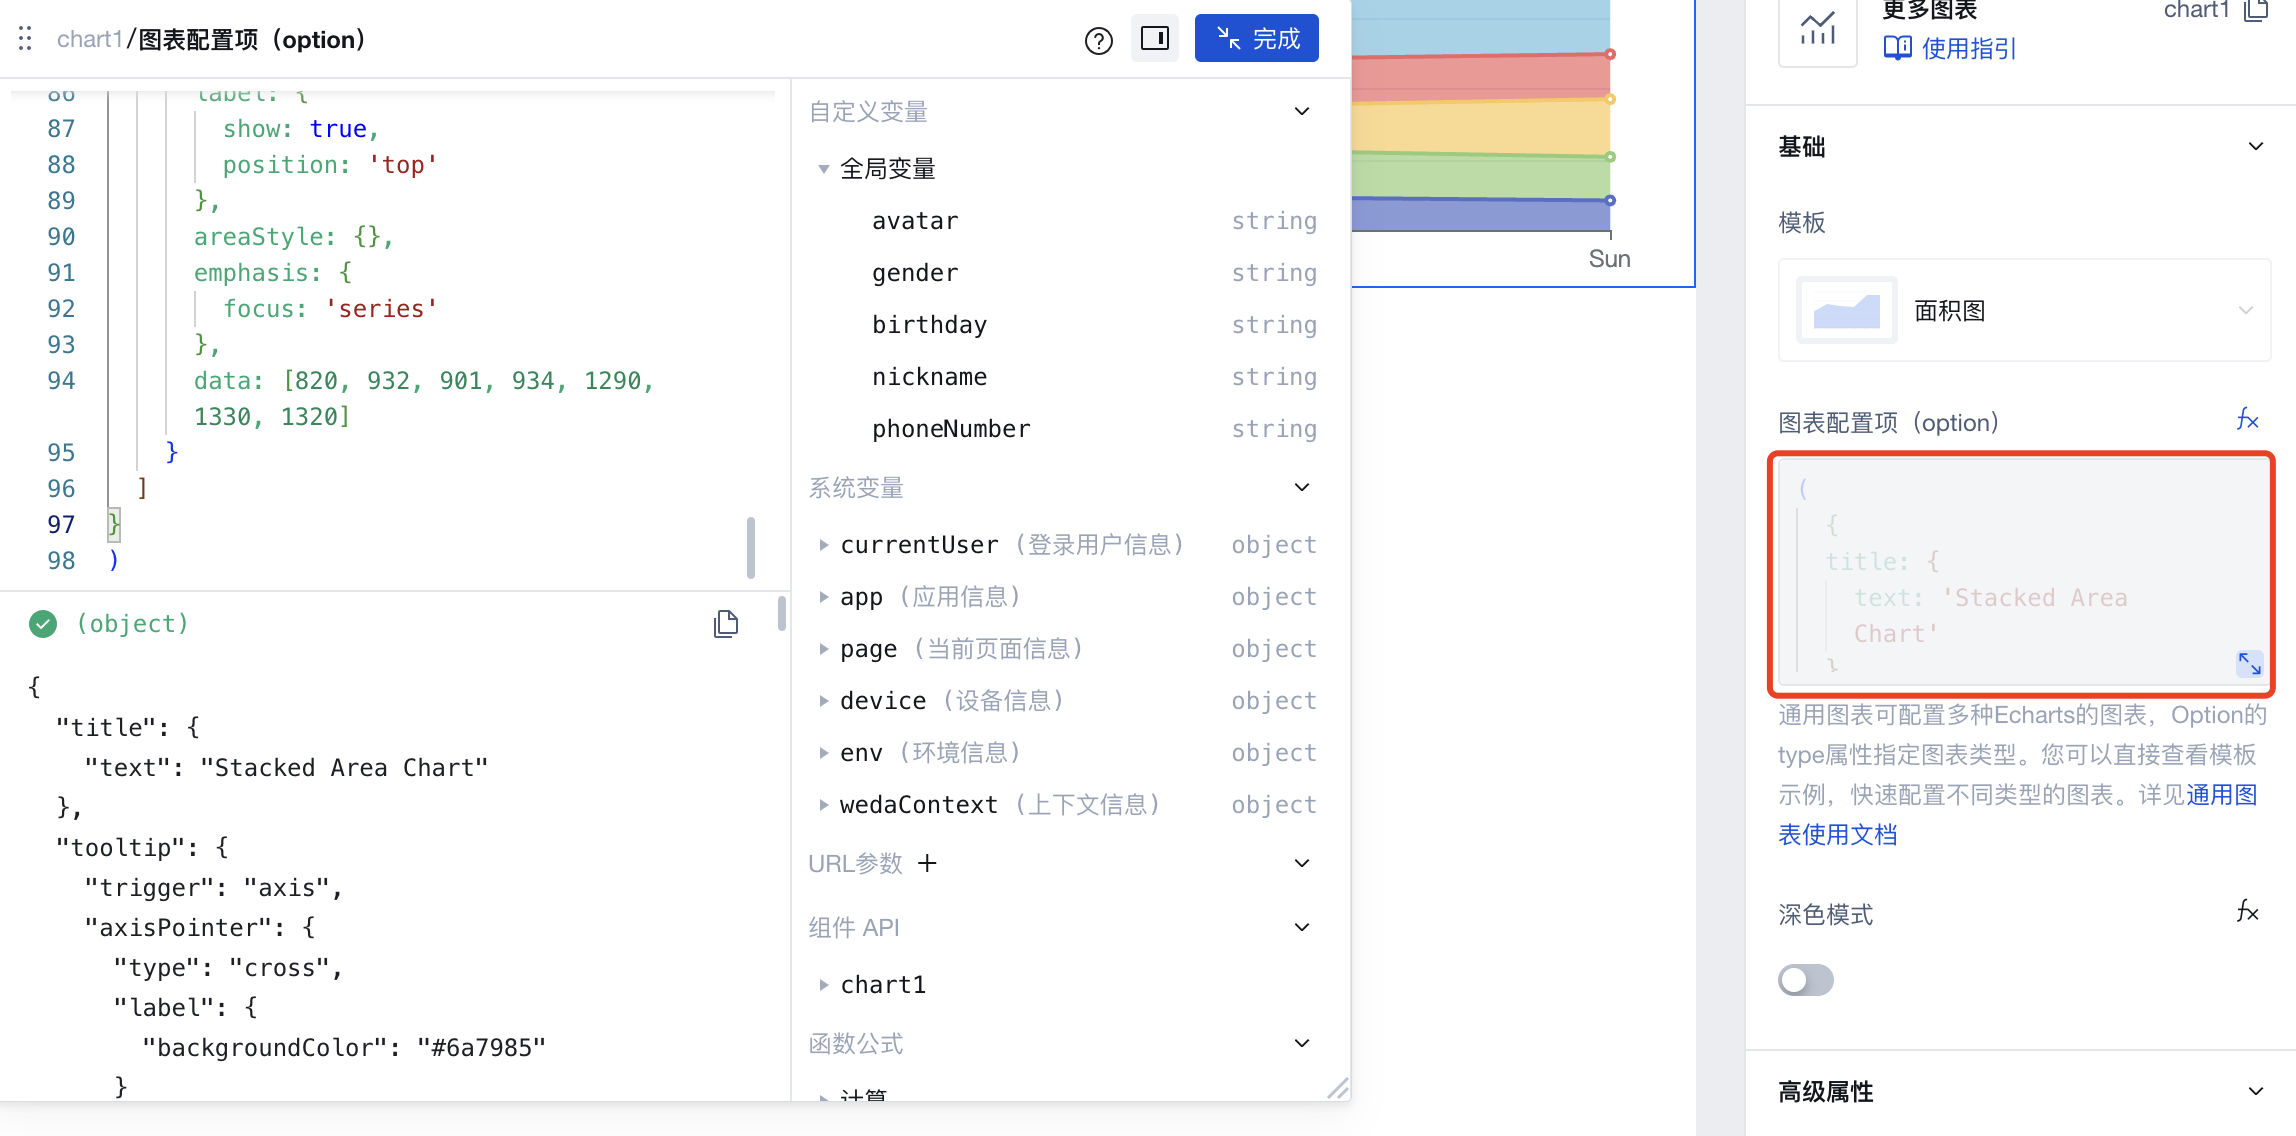

图表配置项示例:
({title: {text: 'Stacked Area Chart'},tooltip: {trigger: 'axis',axisPointer: {type: 'cross',label: {backgroundColor: '#6a7985'}}},legend: {data: ['Email', 'Union Ads', 'Video Ads', 'Direct', 'Search Engine']},toolbox: {feature: {saveAsImage: {}}},grid: {left: '3%',right: '4%',bottom: '3%',containLabel: true},xAxis: [{type: 'category',boundaryGap: false,data: ['Mon', 'Tue', 'Wed', 'Thu', 'Fri', 'Sat', 'Sun']}],yAxis: [{type: 'value'}],series: [{name: 'Email',type: 'line',stack: 'Total',areaStyle: {},emphasis: {focus: 'series'},data: [120, 132, 101, 134, 90, 230, 210]},{name: 'Union Ads',type: 'line',stack: 'Total',areaStyle: {},emphasis: {focus: 'series'},data: [220, 182, 191, 234, 290, 330, 310]},{name: 'Video Ads',type: 'line',stack: 'Total',areaStyle: {},emphasis: {focus: 'series'},data: [150, 232, 201, 154, 190, 330, 410]},{name: 'Direct',type: 'line',stack: 'Total',areaStyle: {},emphasis: {focus: 'series'},data: [320, 332, 301, 334, 390, 330, 320]},{name: 'Search Engine',type: 'line',stack: 'Total',label: {show: true,position: 'top'},areaStyle: {},emphasis: {focus: 'series'},data: [820, 932, 901, 934, 1290, 1330, 1320]}]})
6. 图表配置完成,效果展示。
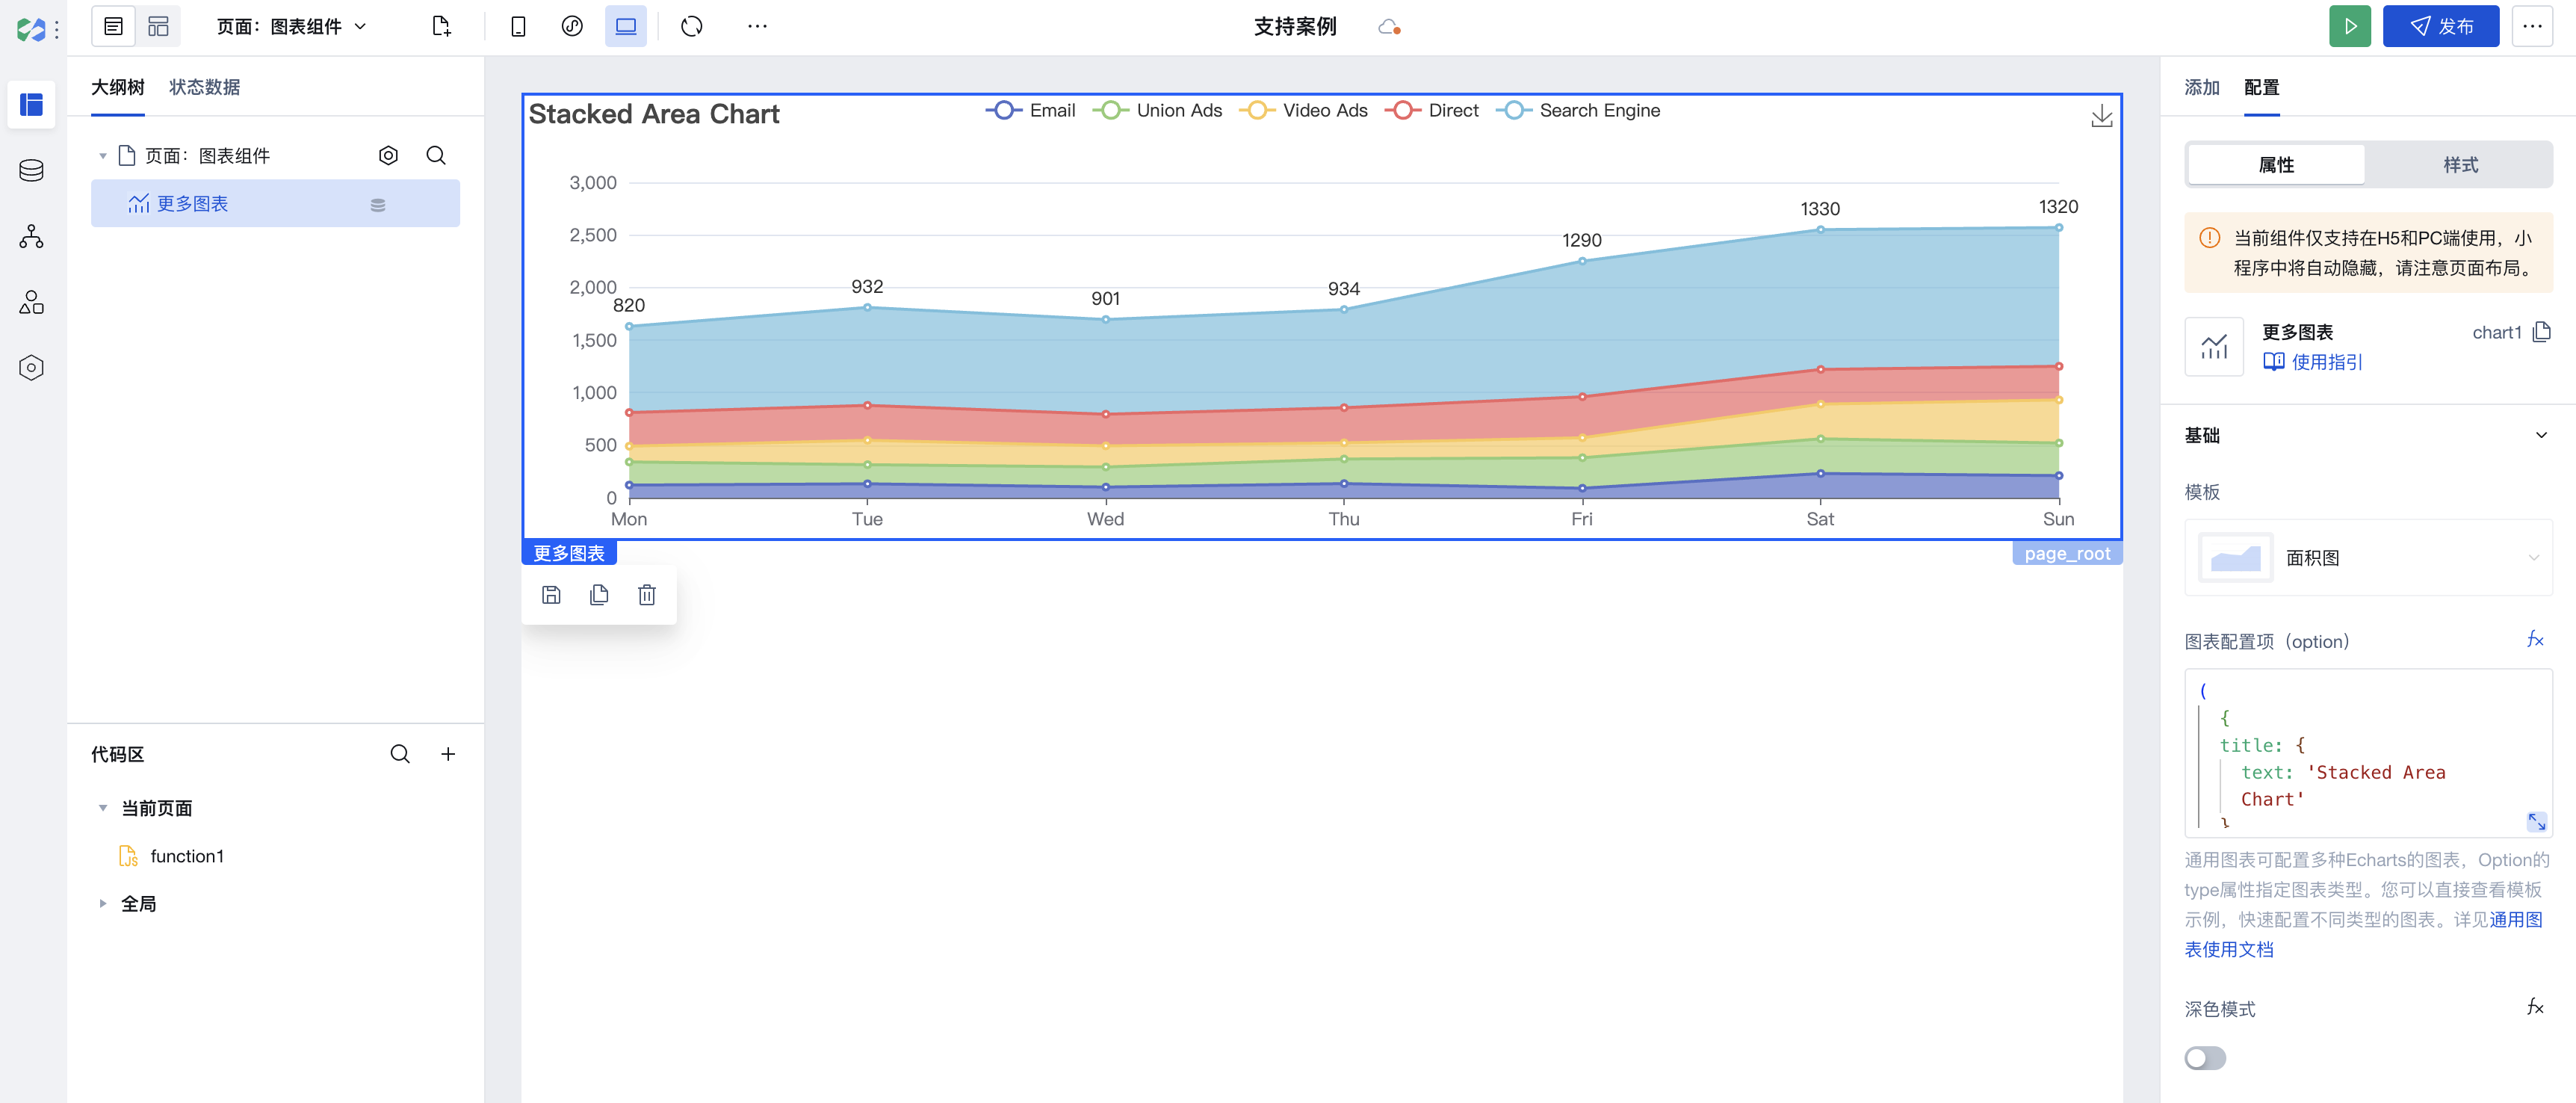

更多图表组件引用柱状图
1. 在编辑器中使用更多图表组件,模板选择不使用模板,并将图表默认配置项清除。
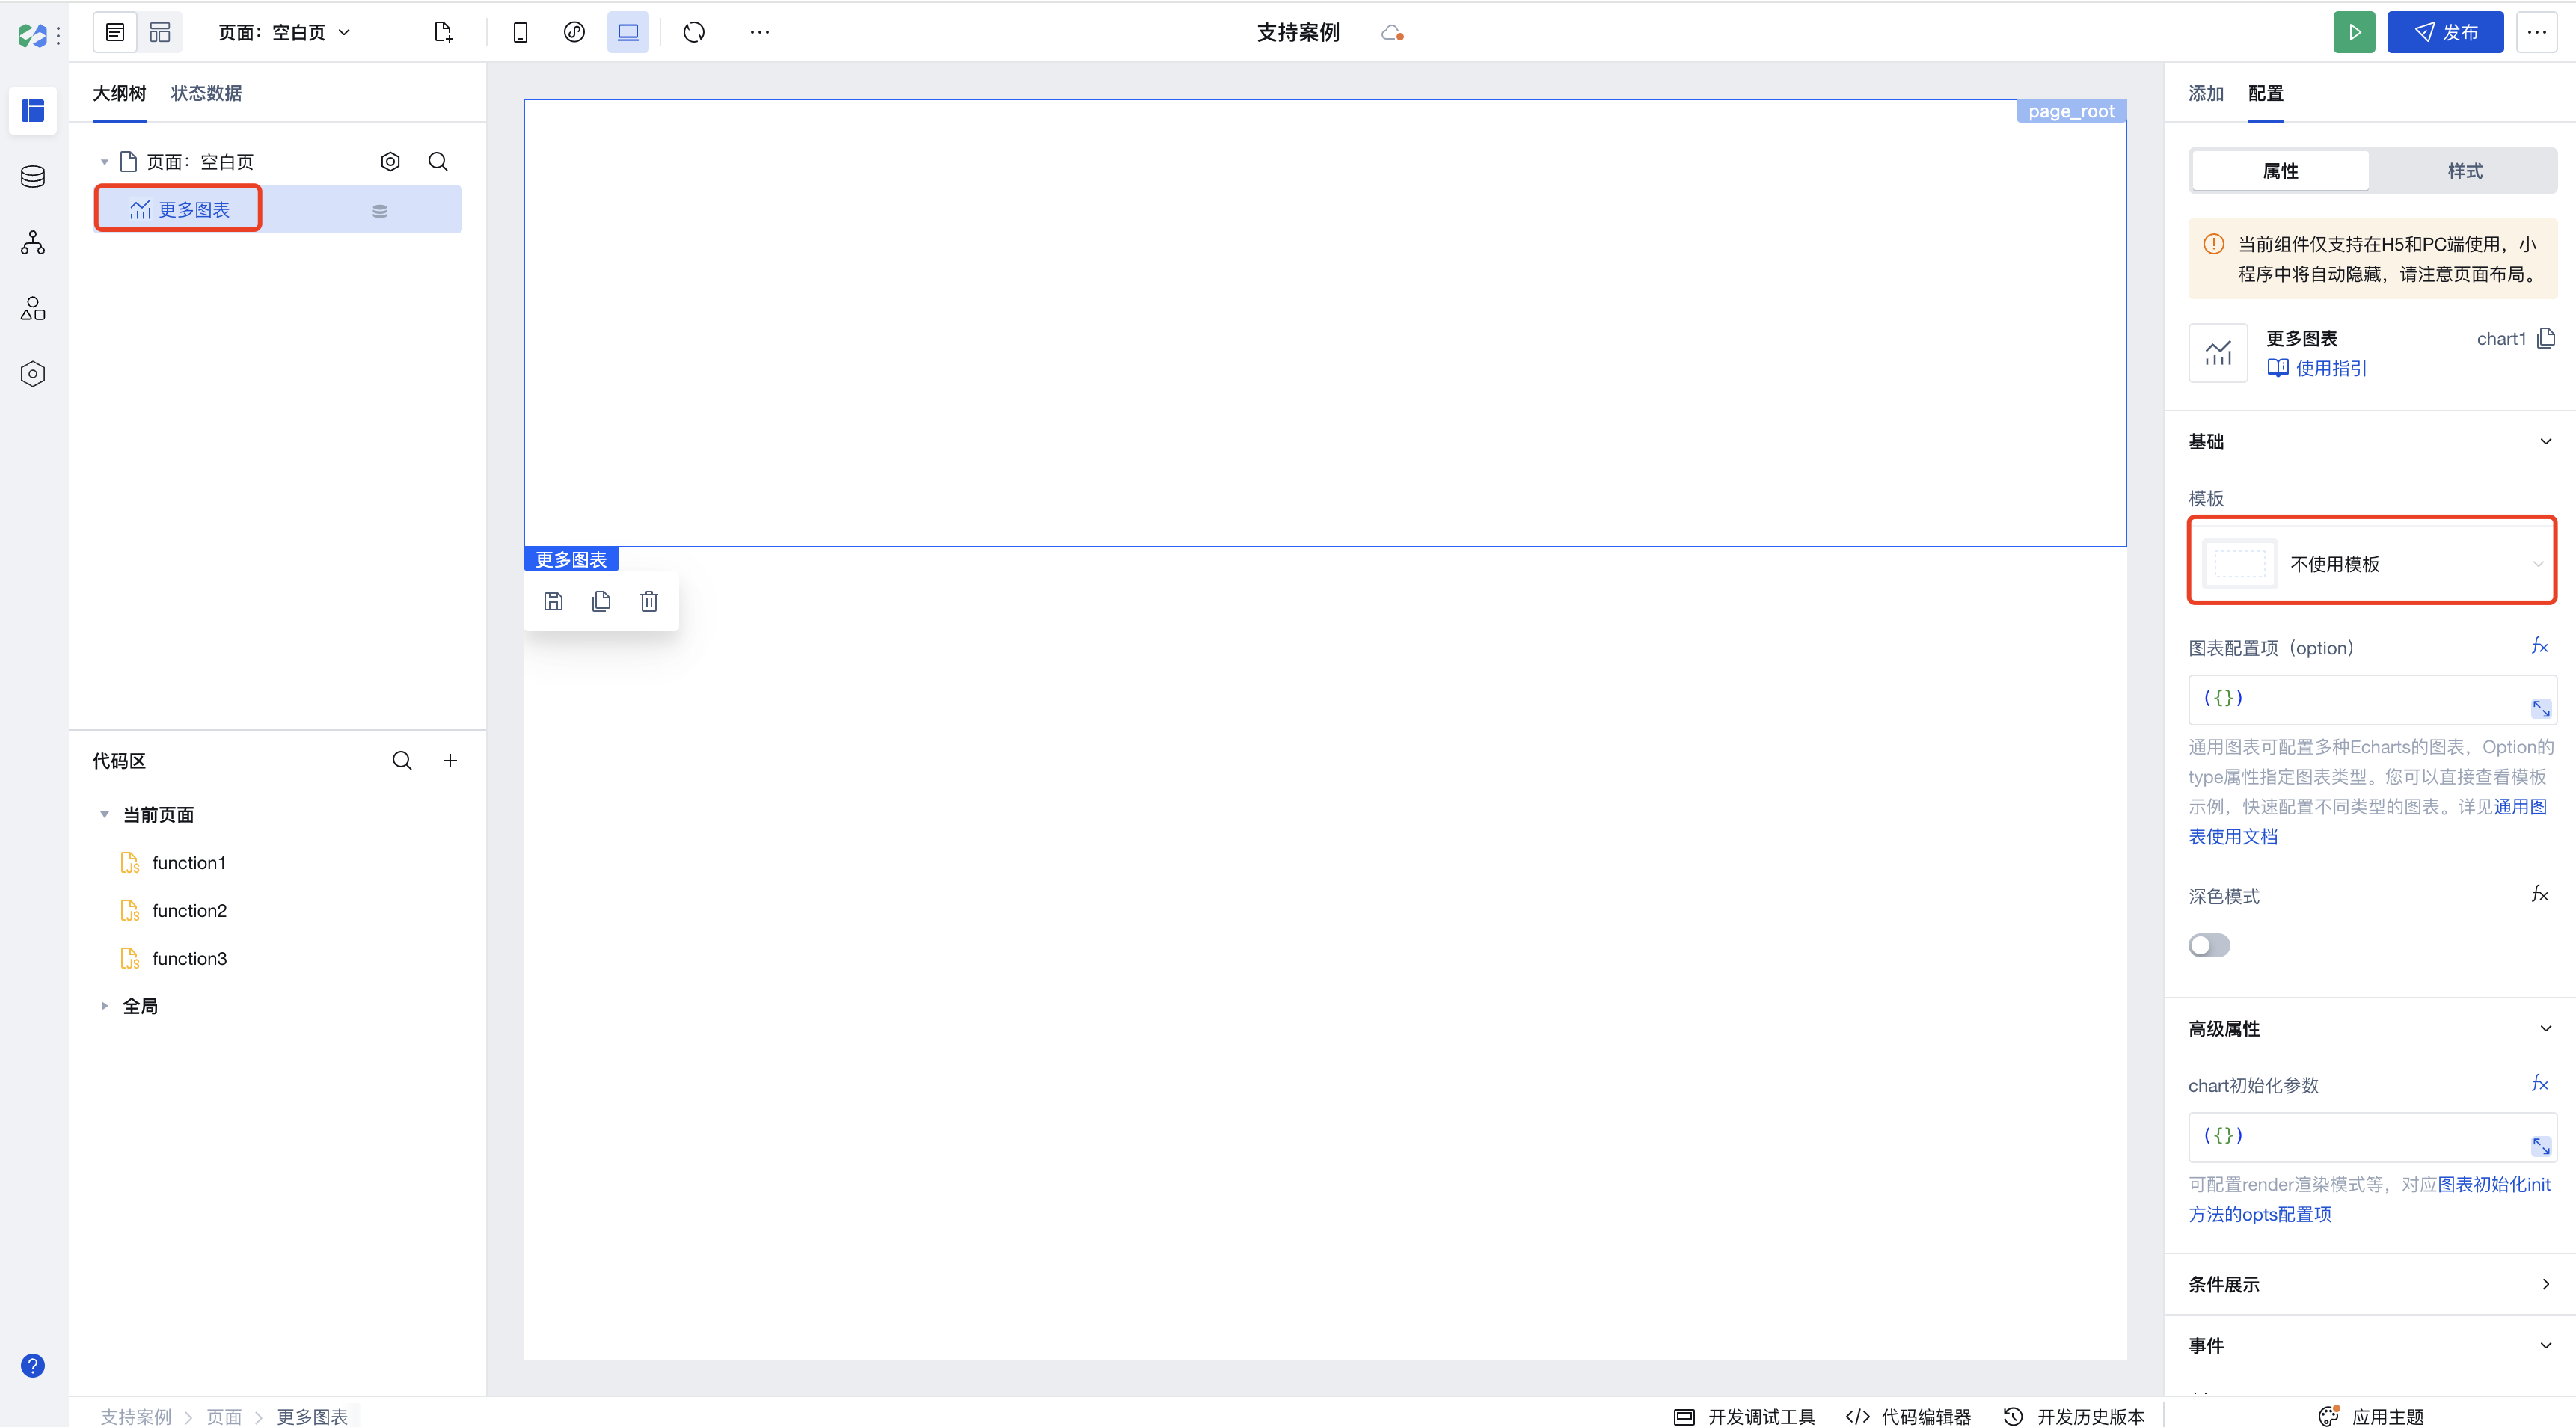

2. 前往 Echarts 官网 查看应用示例,选择堆叠柱状图。
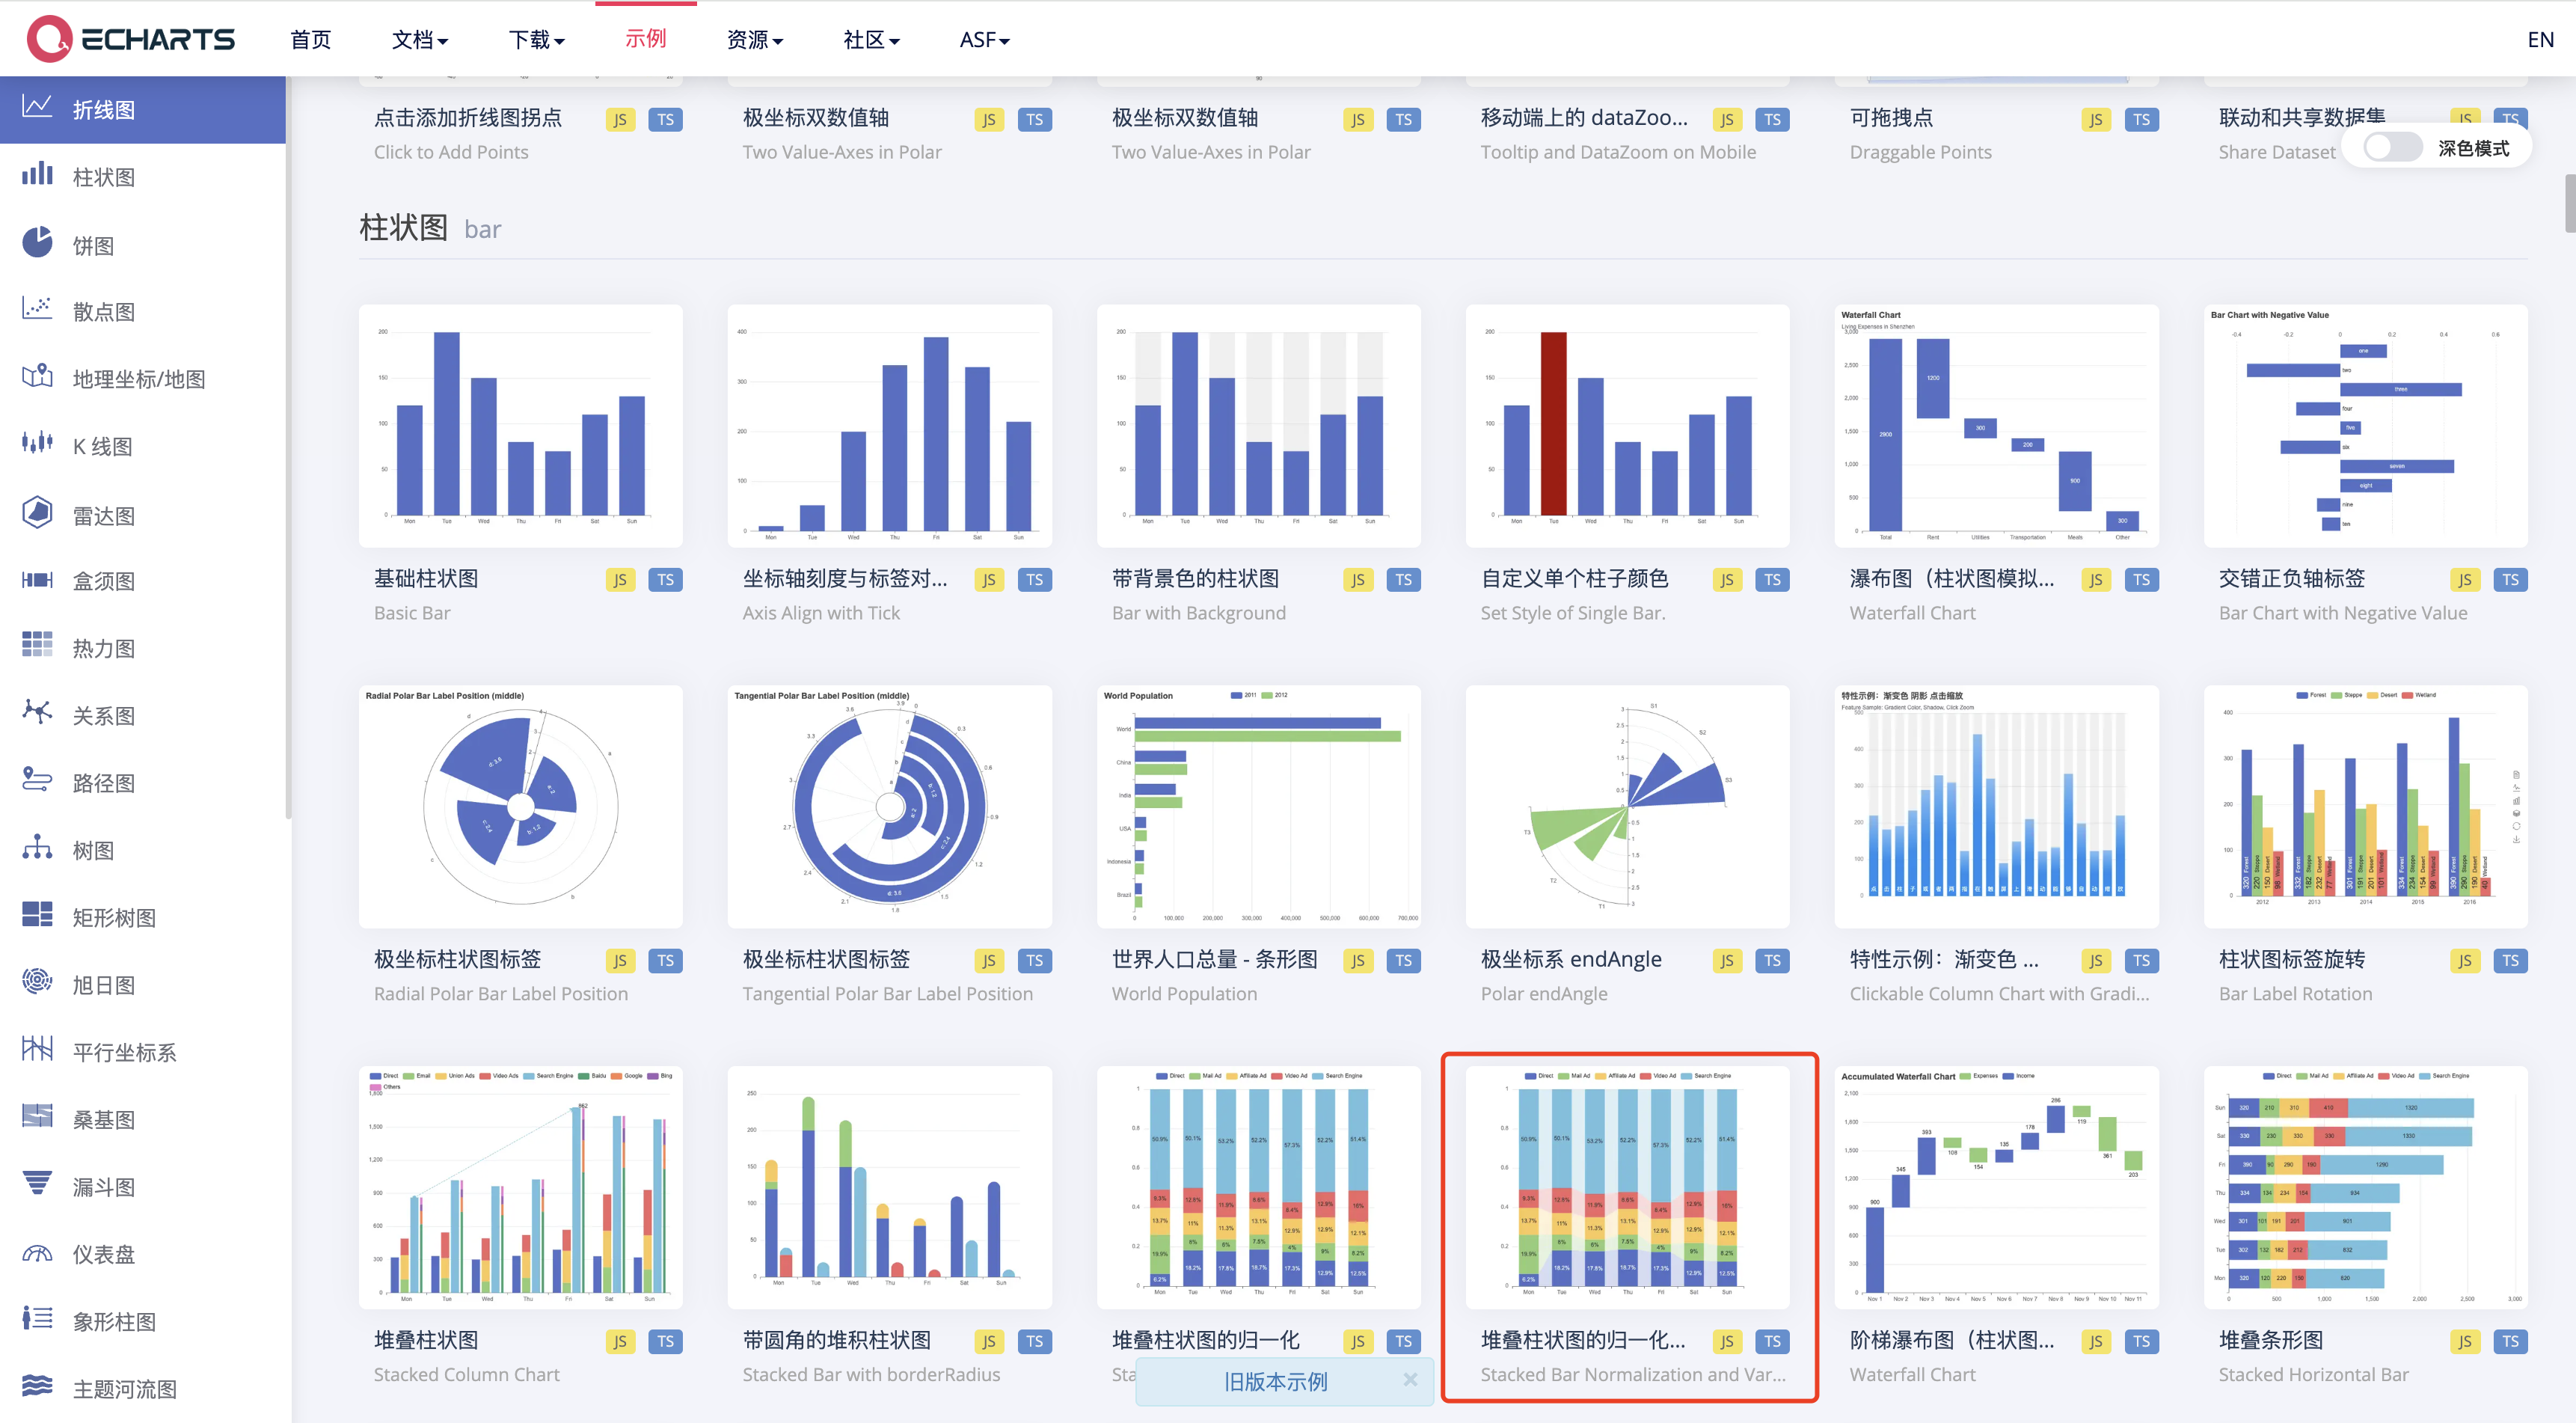

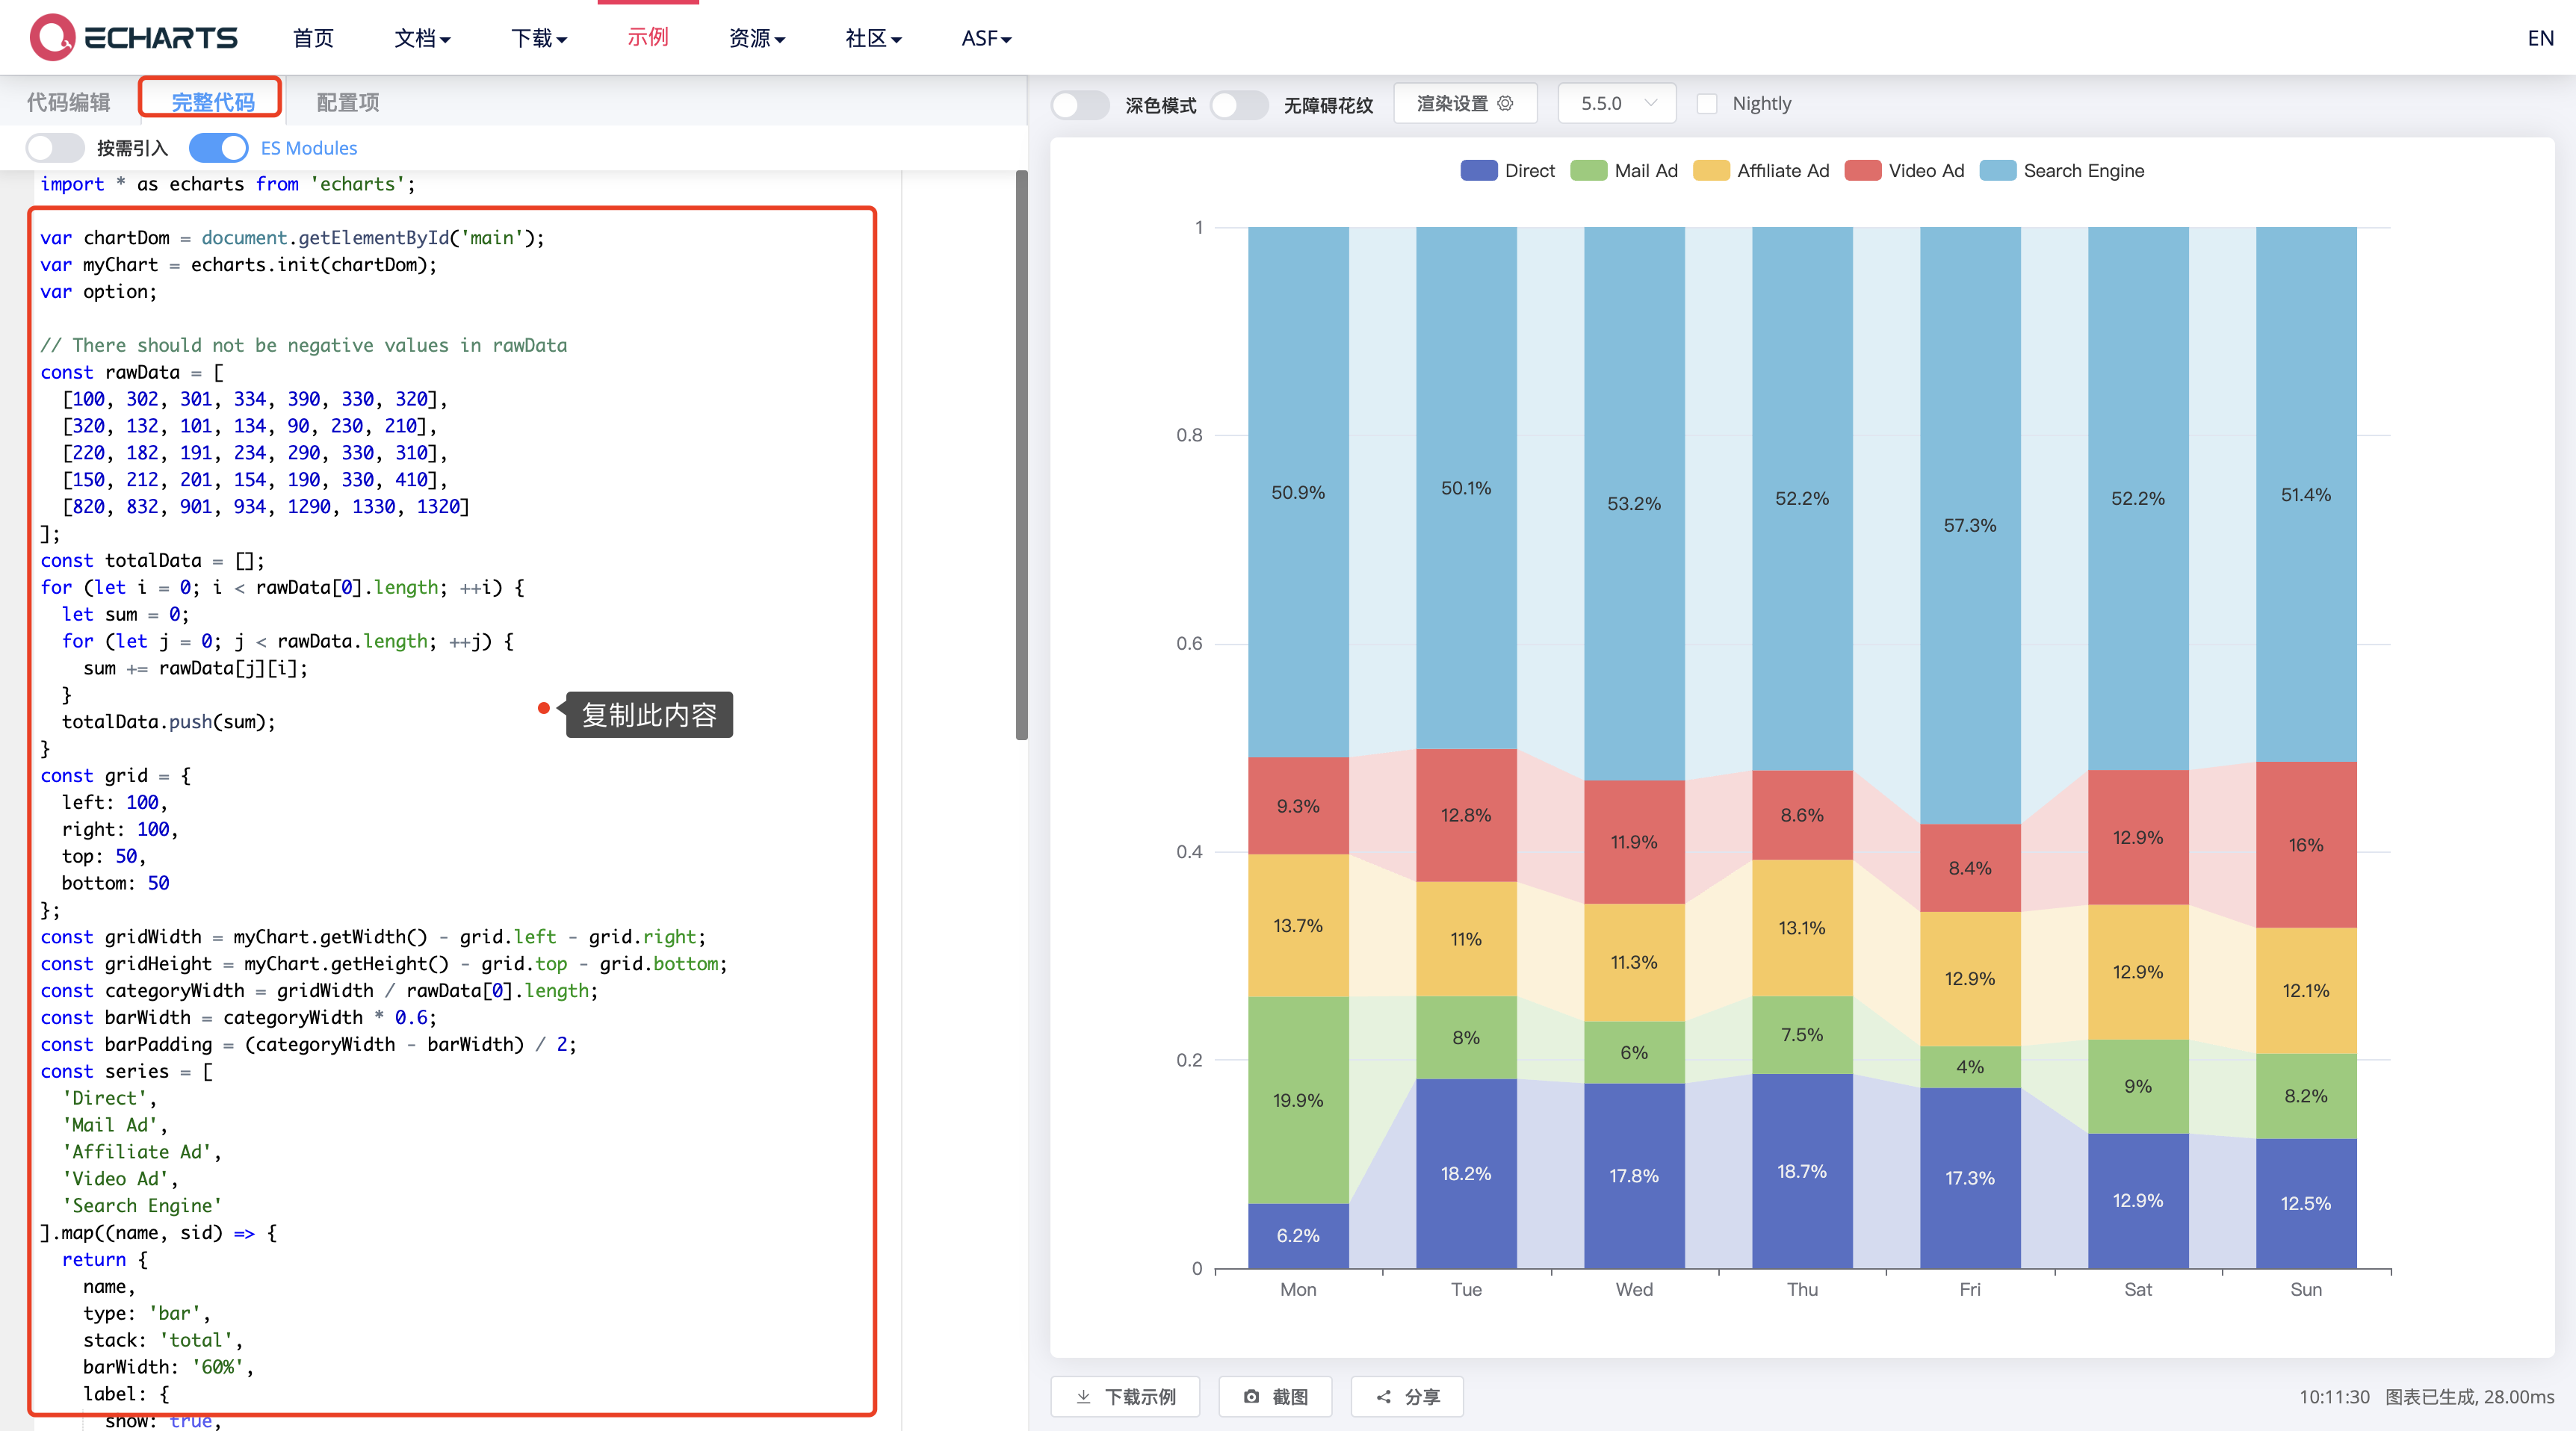
3. 复制堆叠柱状图示例完整代码下的配置内容。

4. 返回微搭编辑器,新建自定义
javascript 方法 setOption。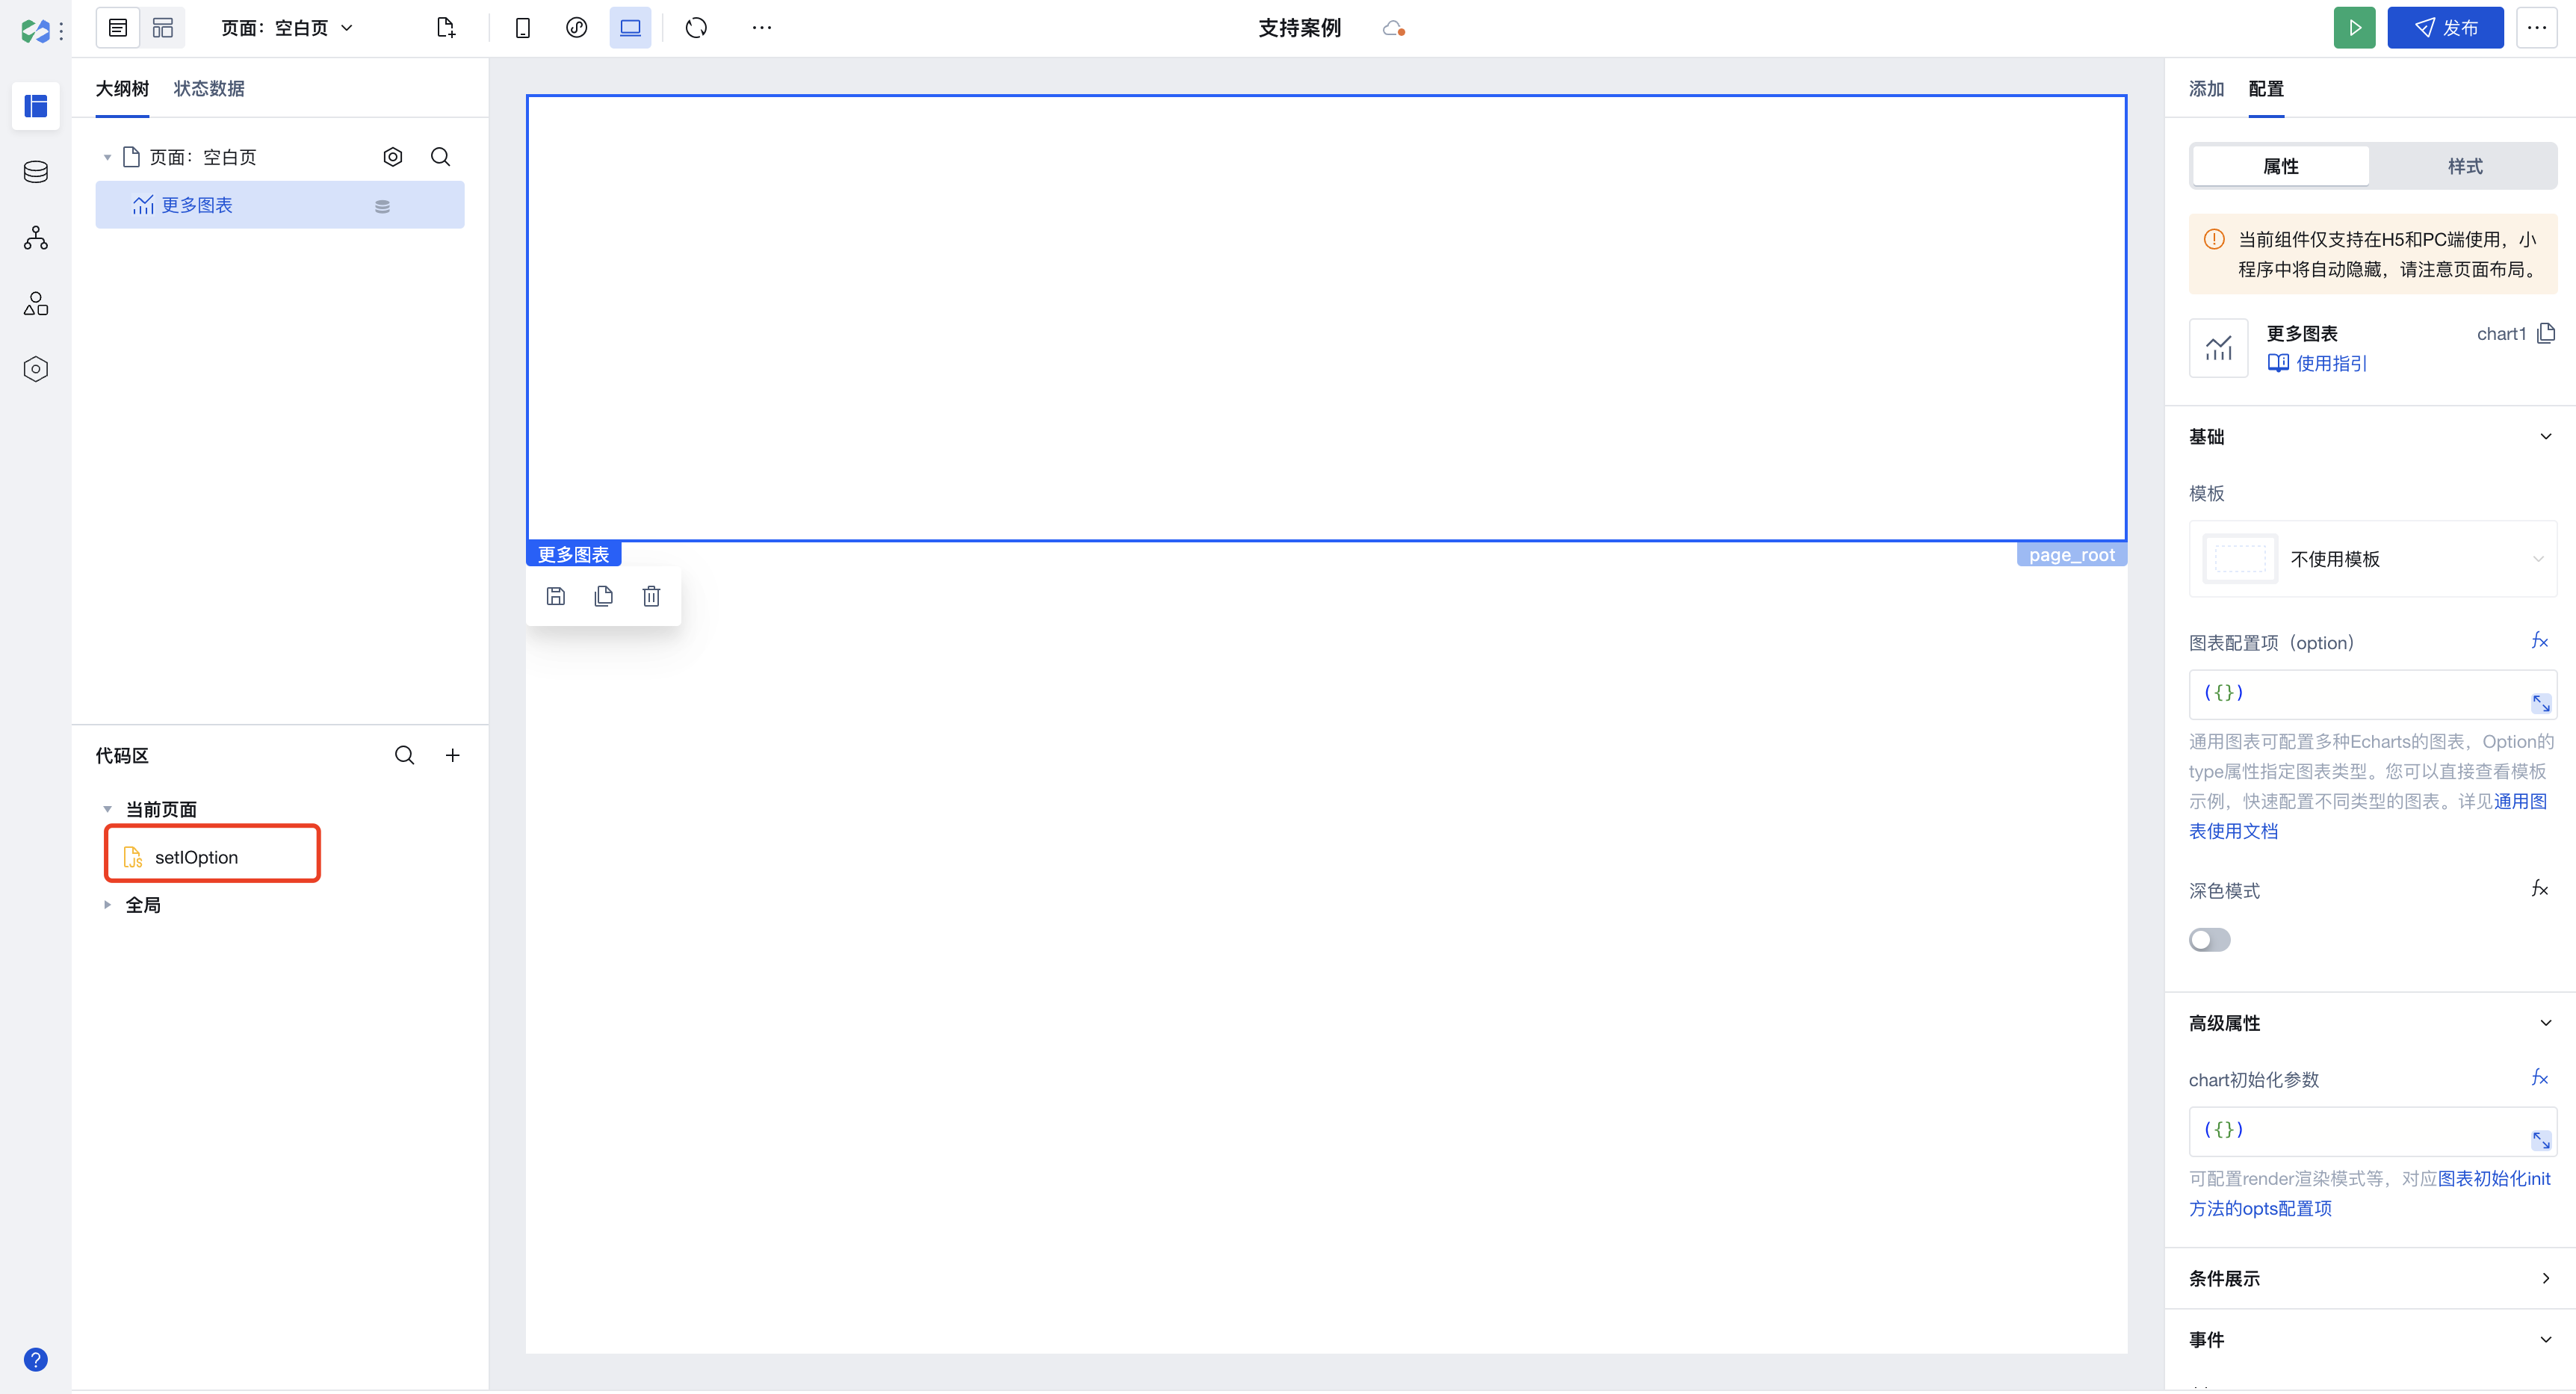

5. 将在步骤3复制的内容粘贴到
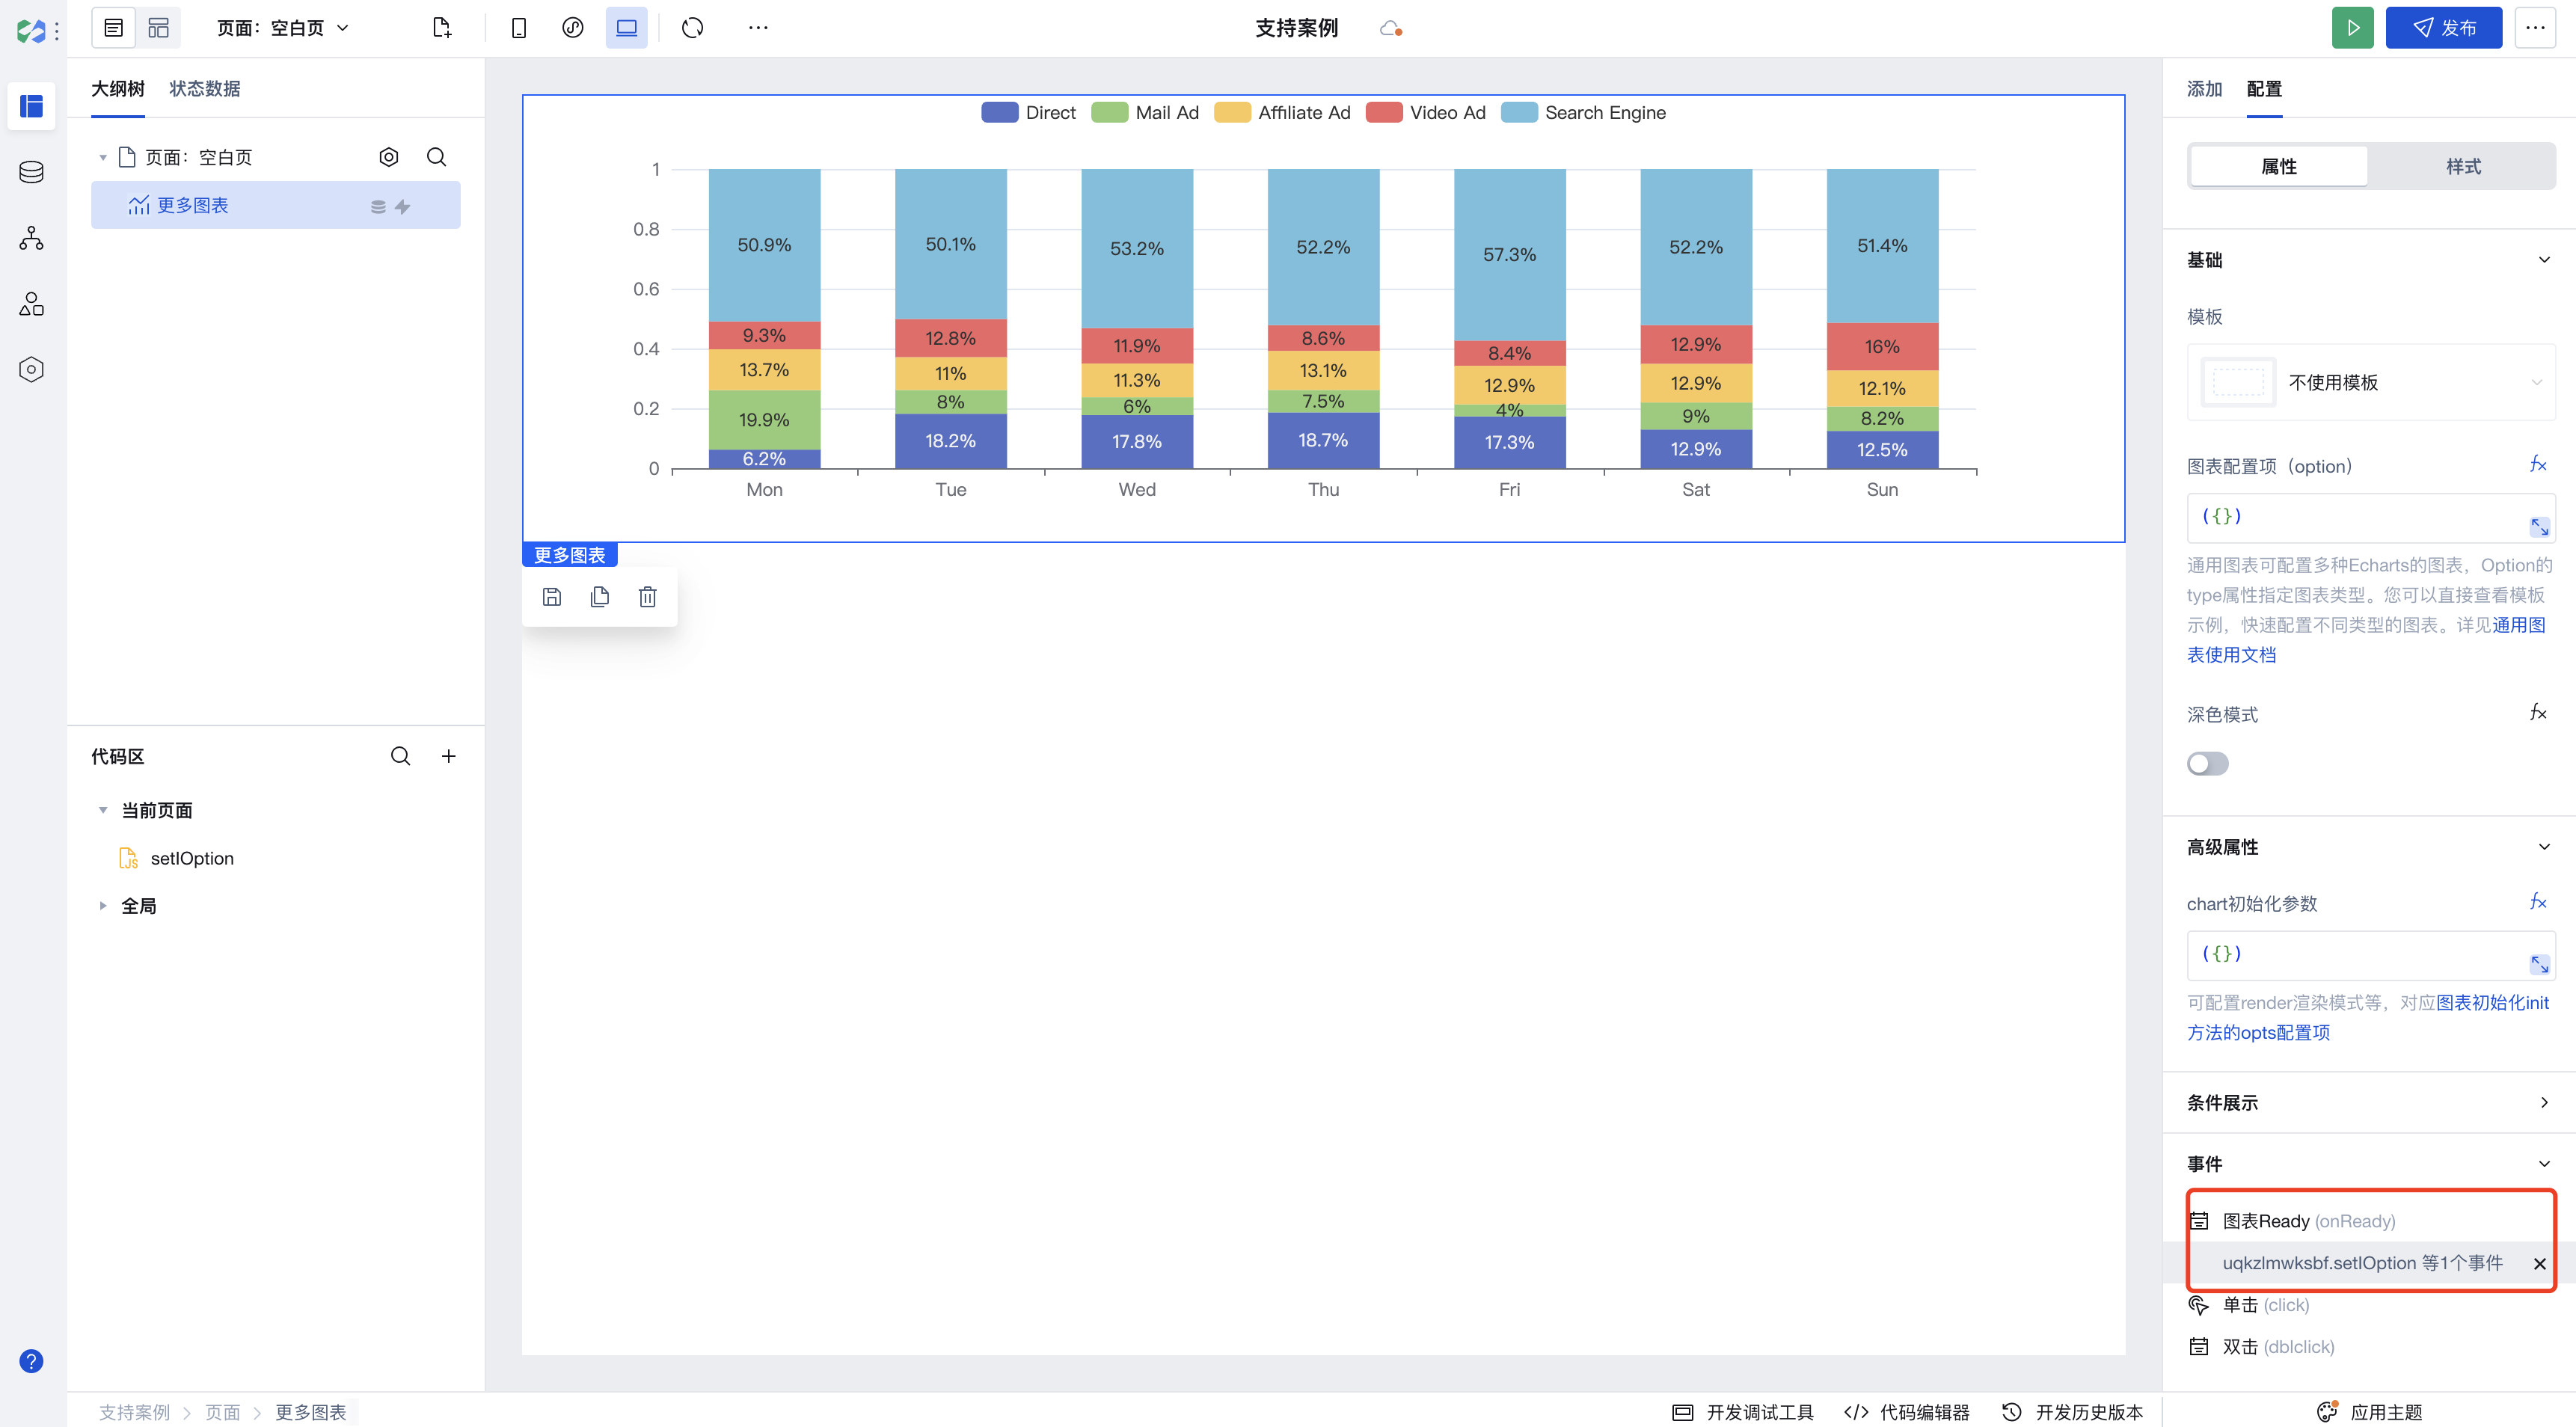
setOption方法中。export default function ({ event, data }) {let myChart = $w.chart1.echartsInstance;// There should not be negative values in rawDataconst rawData = [[100, 302, 301, 334, 390, 330, 320],[320, 132, 101, 134, 90, 230, 210],[220, 182, 191, 234, 290, 330, 310],[150, 212, 201, 154, 190, 330, 410],[820, 832, 901, 934, 1290, 1330, 1320]];const totalData = [];for (let i = 0; i < rawData[0].length; ++i) {let sum = 0;for (let j = 0; j < rawData.length; ++j) {sum += rawData[j][i];}totalData.push(sum);}const grid = {left: 100,right: 100,top: 50,bottom: 50};const series = ['Direct','Mail Ad','Affiliate Ad','Video Ad','Search Engine'].map((name, sid) => {return {name,type: 'bar',stack: 'total',barWidth: '60%',label: {show: true,formatter: (params) => Math.round(params.value * 1000) / 10 + '%'},data: rawData[sid].map((d, did) =>totalData[did] <= 0 ? 0 : d / totalData[did])};});const option = {legend: {selectedMode: false},grid,yAxis: {type: 'value'},xAxis: {type: 'category',data: ['Mon', 'Tue', 'Wed', 'Thu', 'Fri', 'Sat', 'Sun']},series}option && myChart.setOption(option)}
说明:
模仿 Echarts 的示例改造,替换对应组件属性,
echarts 对应 $w.chart1.echarts, myChart 对应 $w.chart1.echartsInstance。6. 更多图表组件图表 Ready 事件绑定
setOption 方法。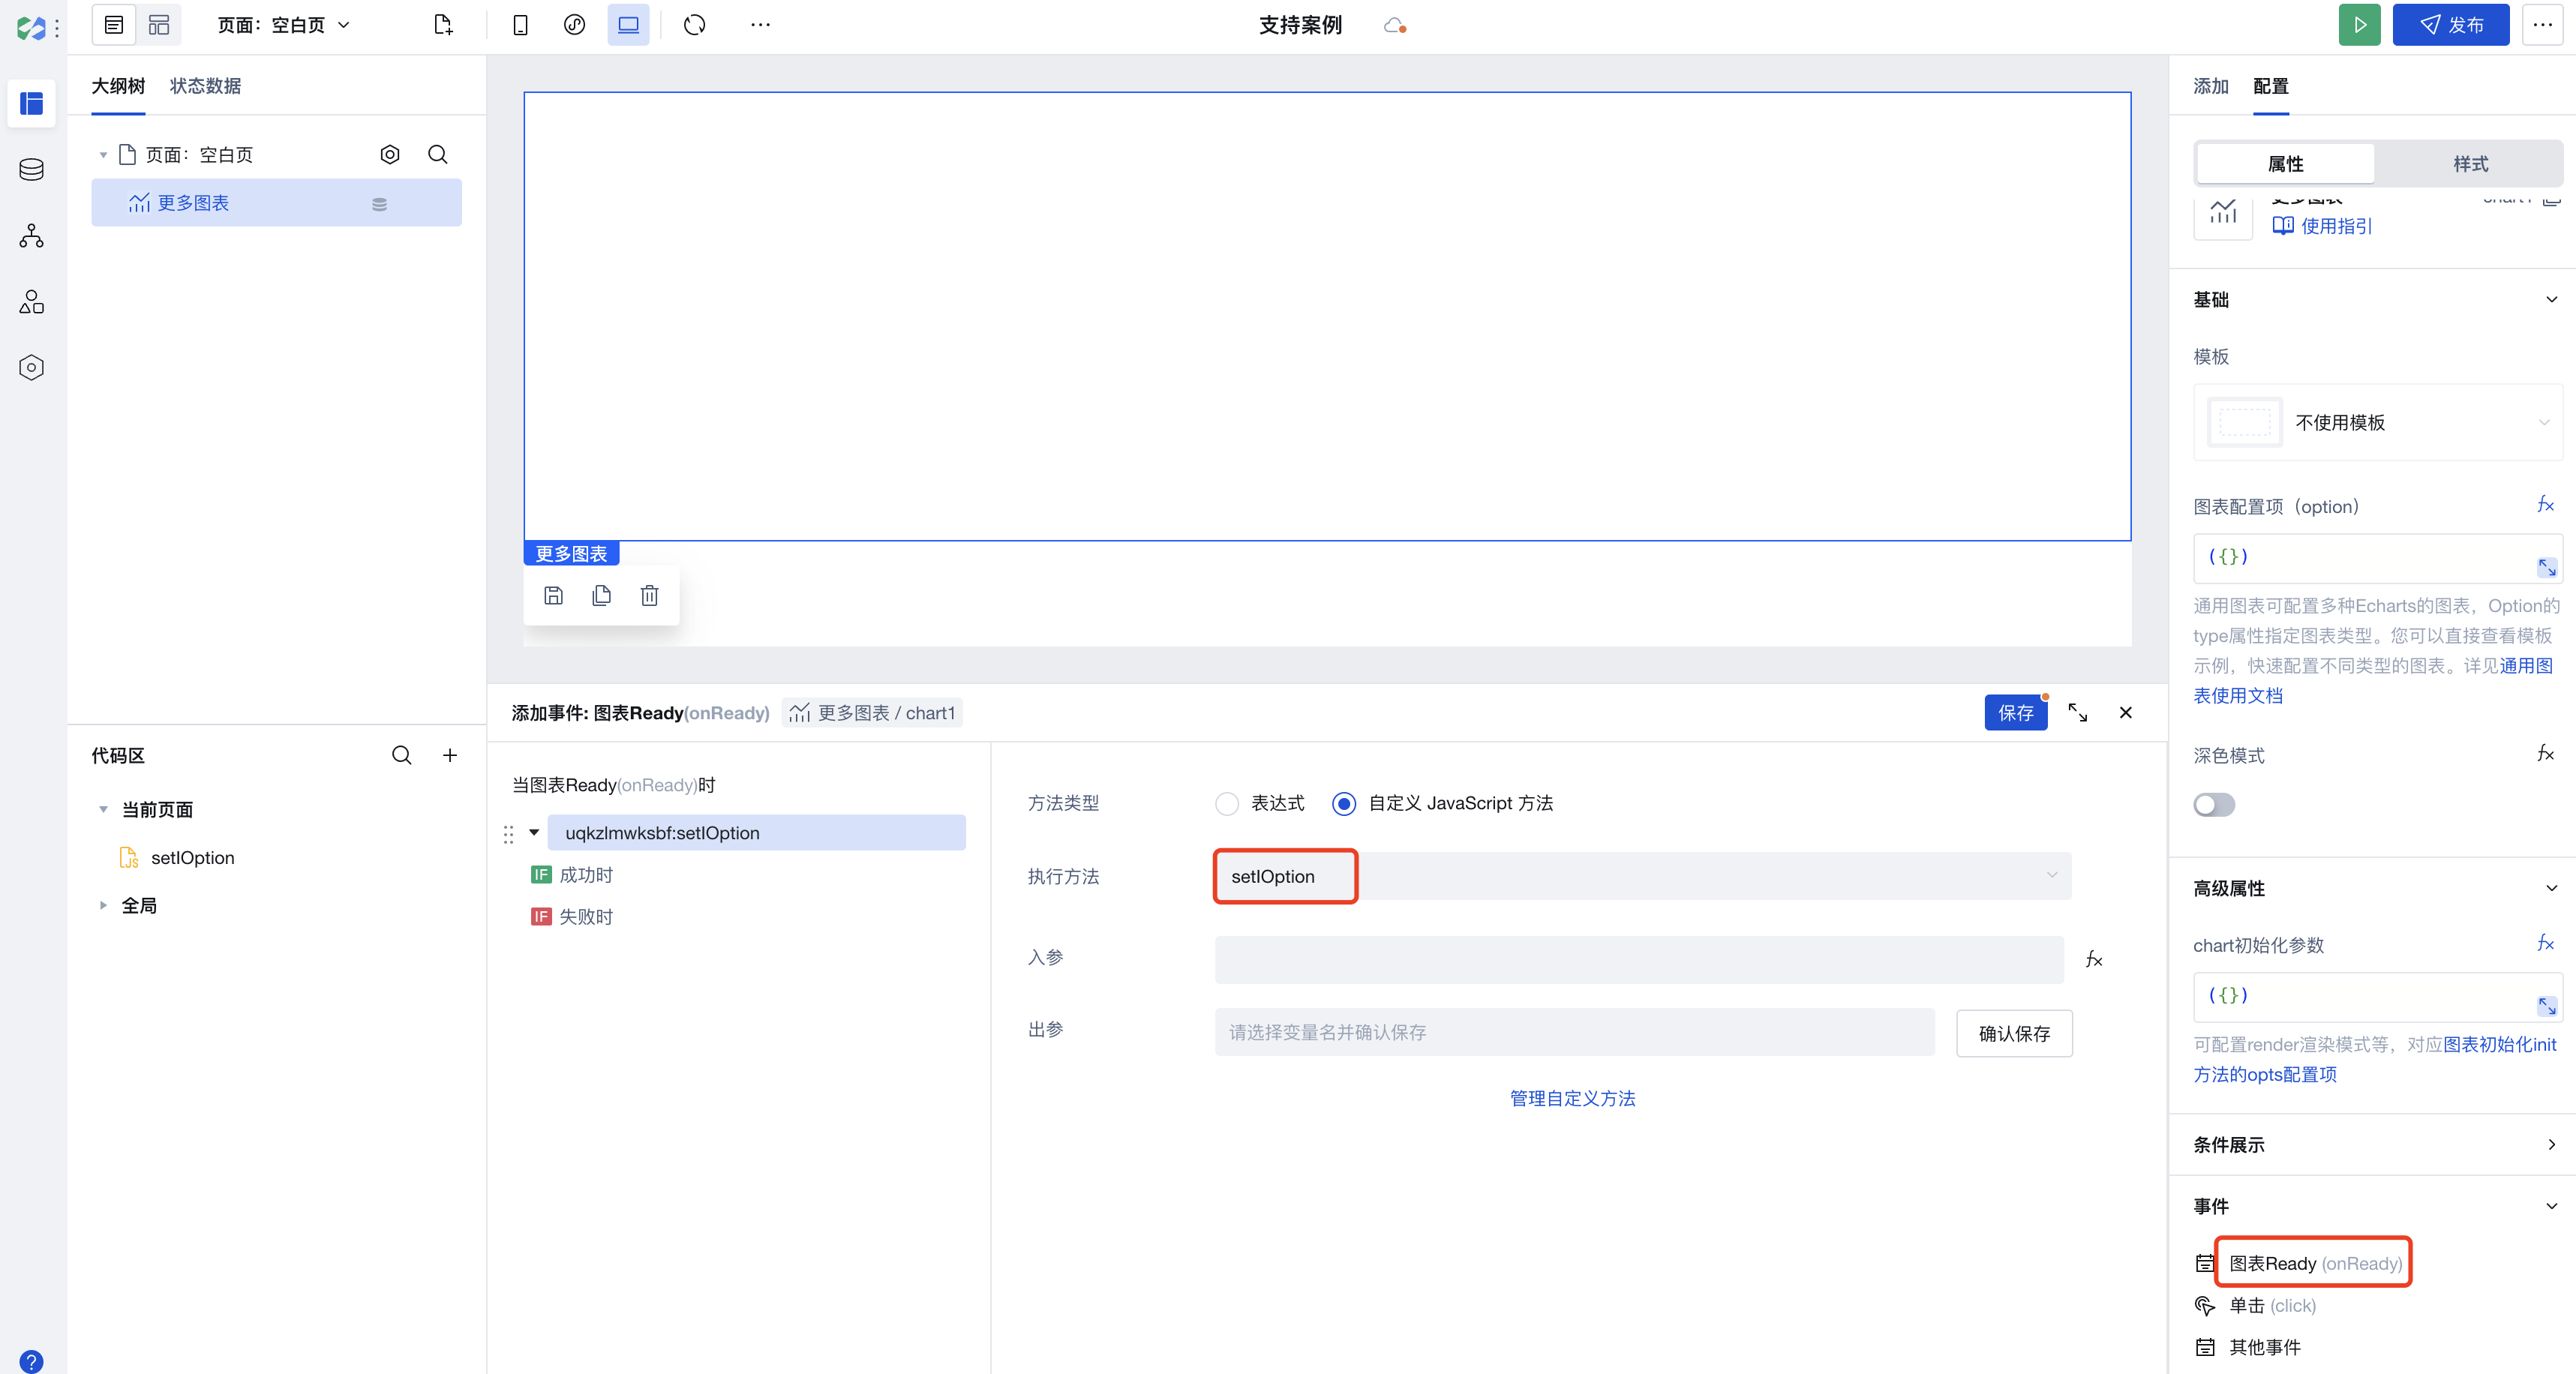

7. 图表配置完成,效果展示。

更多图表组件引用航班座位图
1. 在编辑器中使用更多图表组件,并将图表默认配置项清除,并新建自定义
javascript 方法 function1。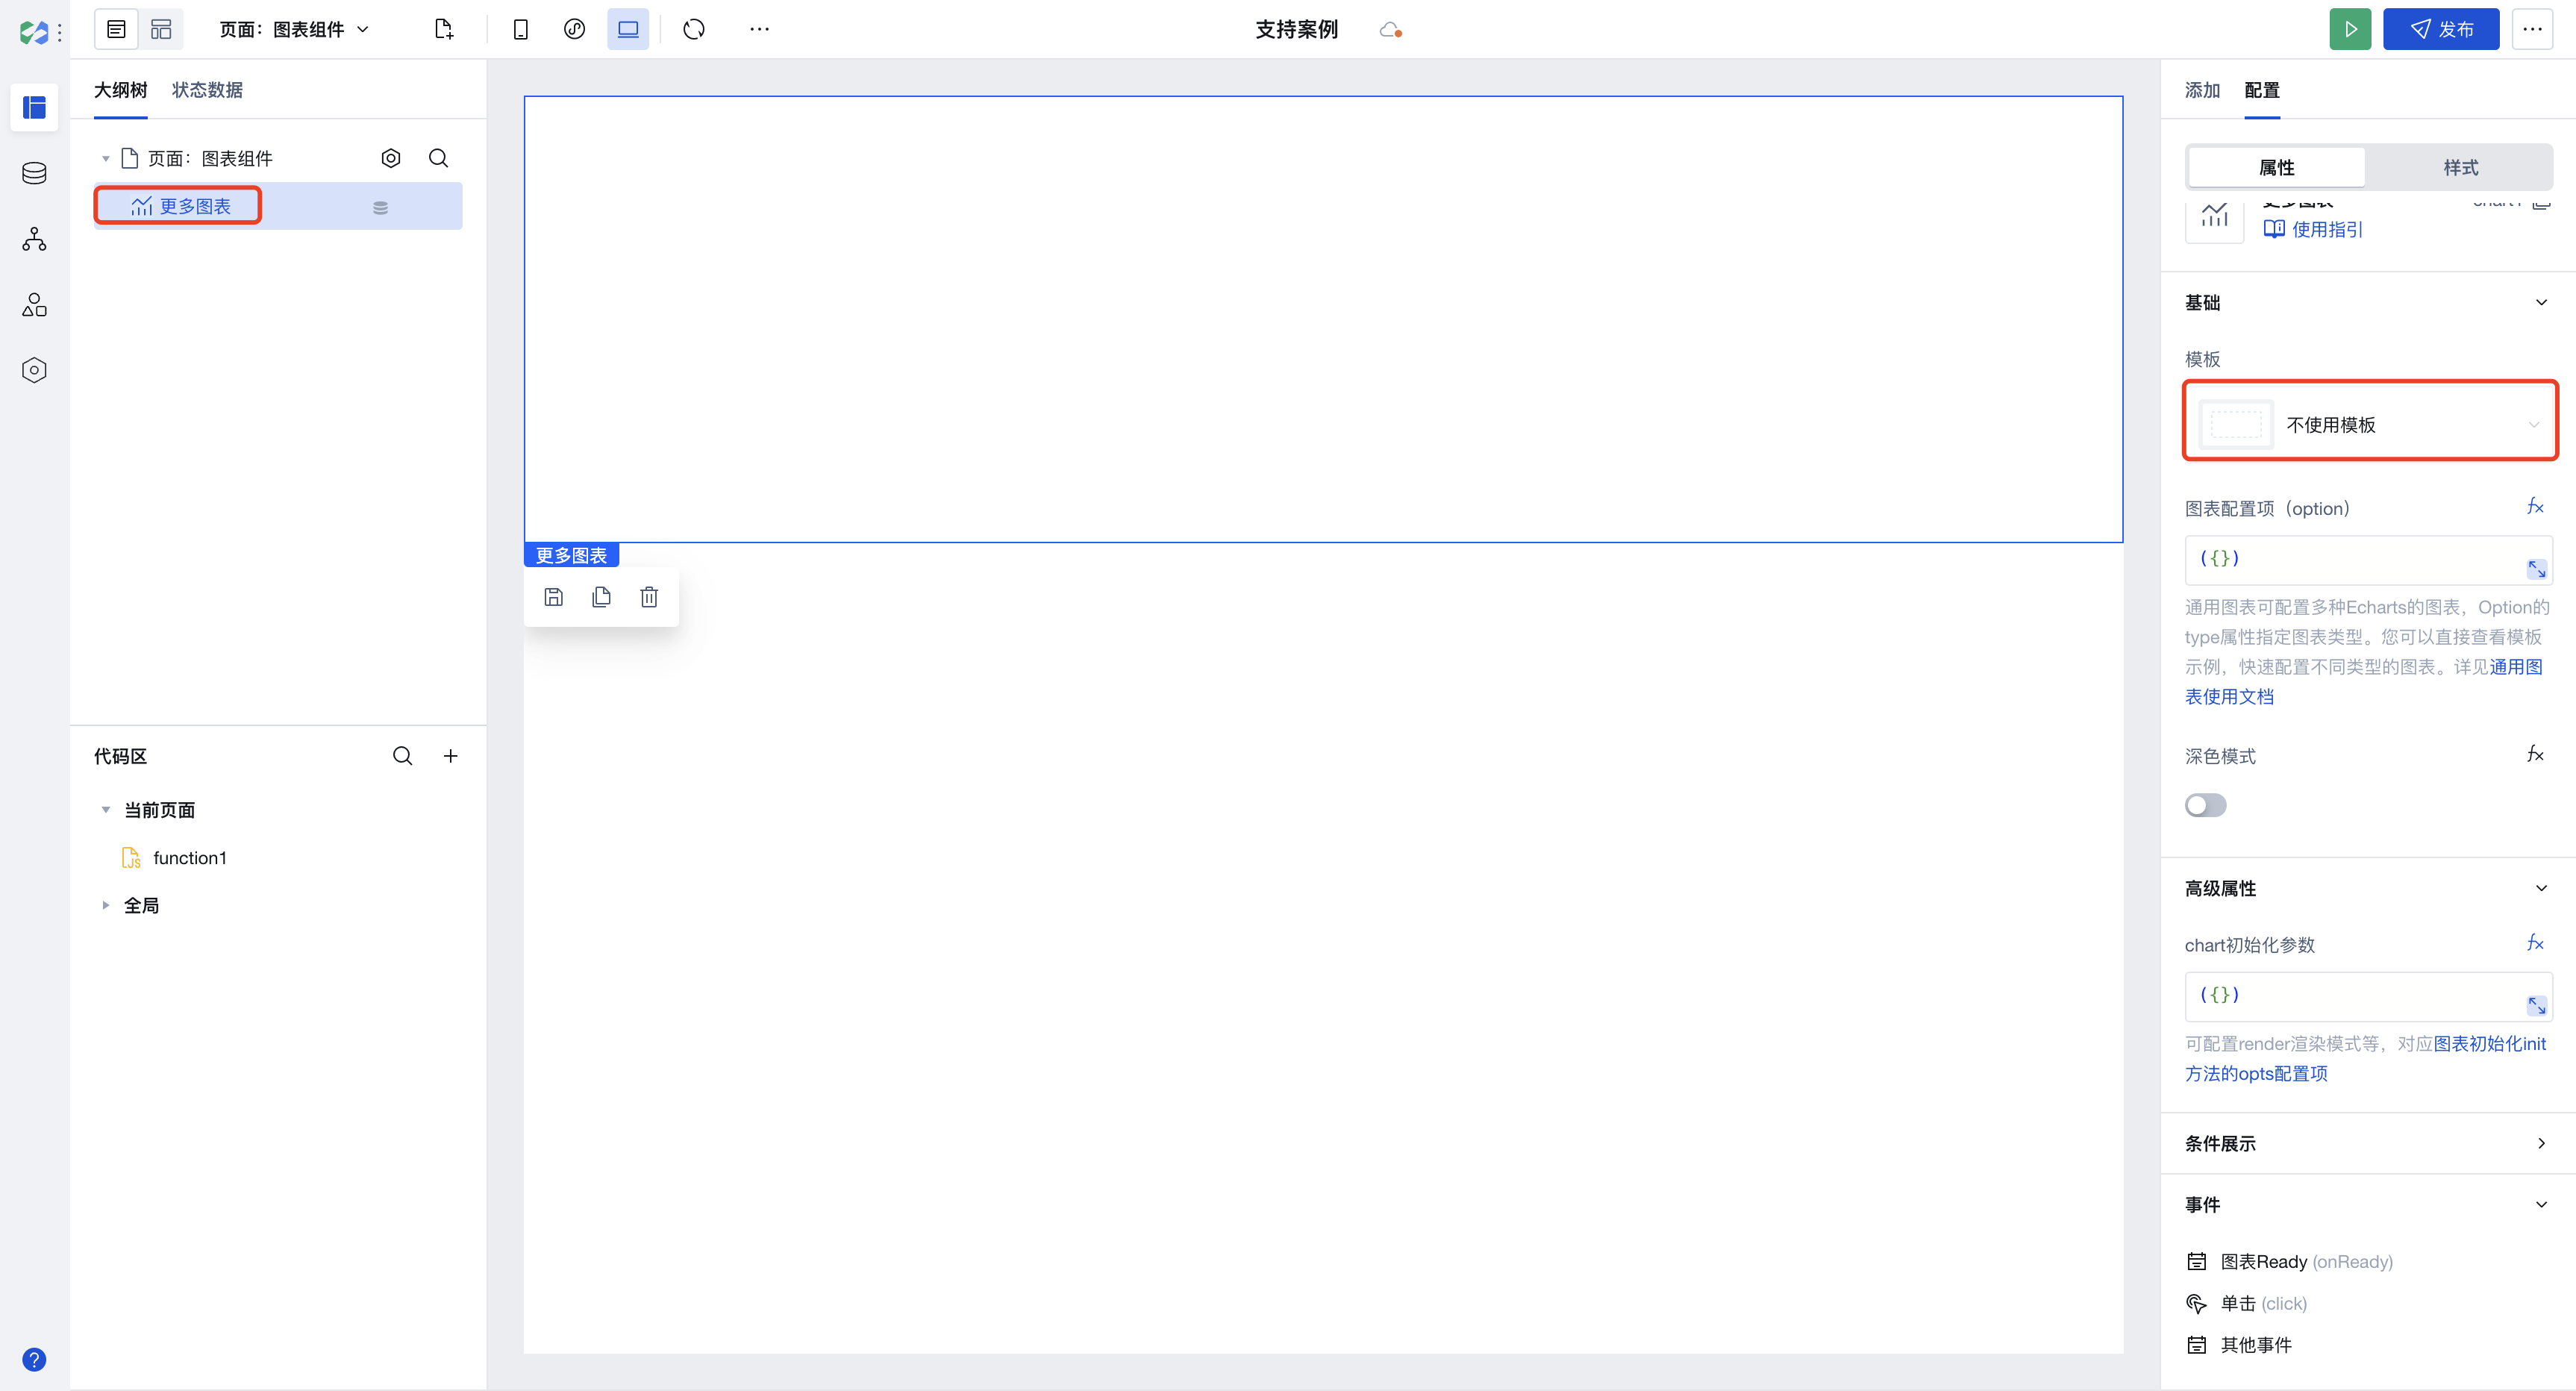

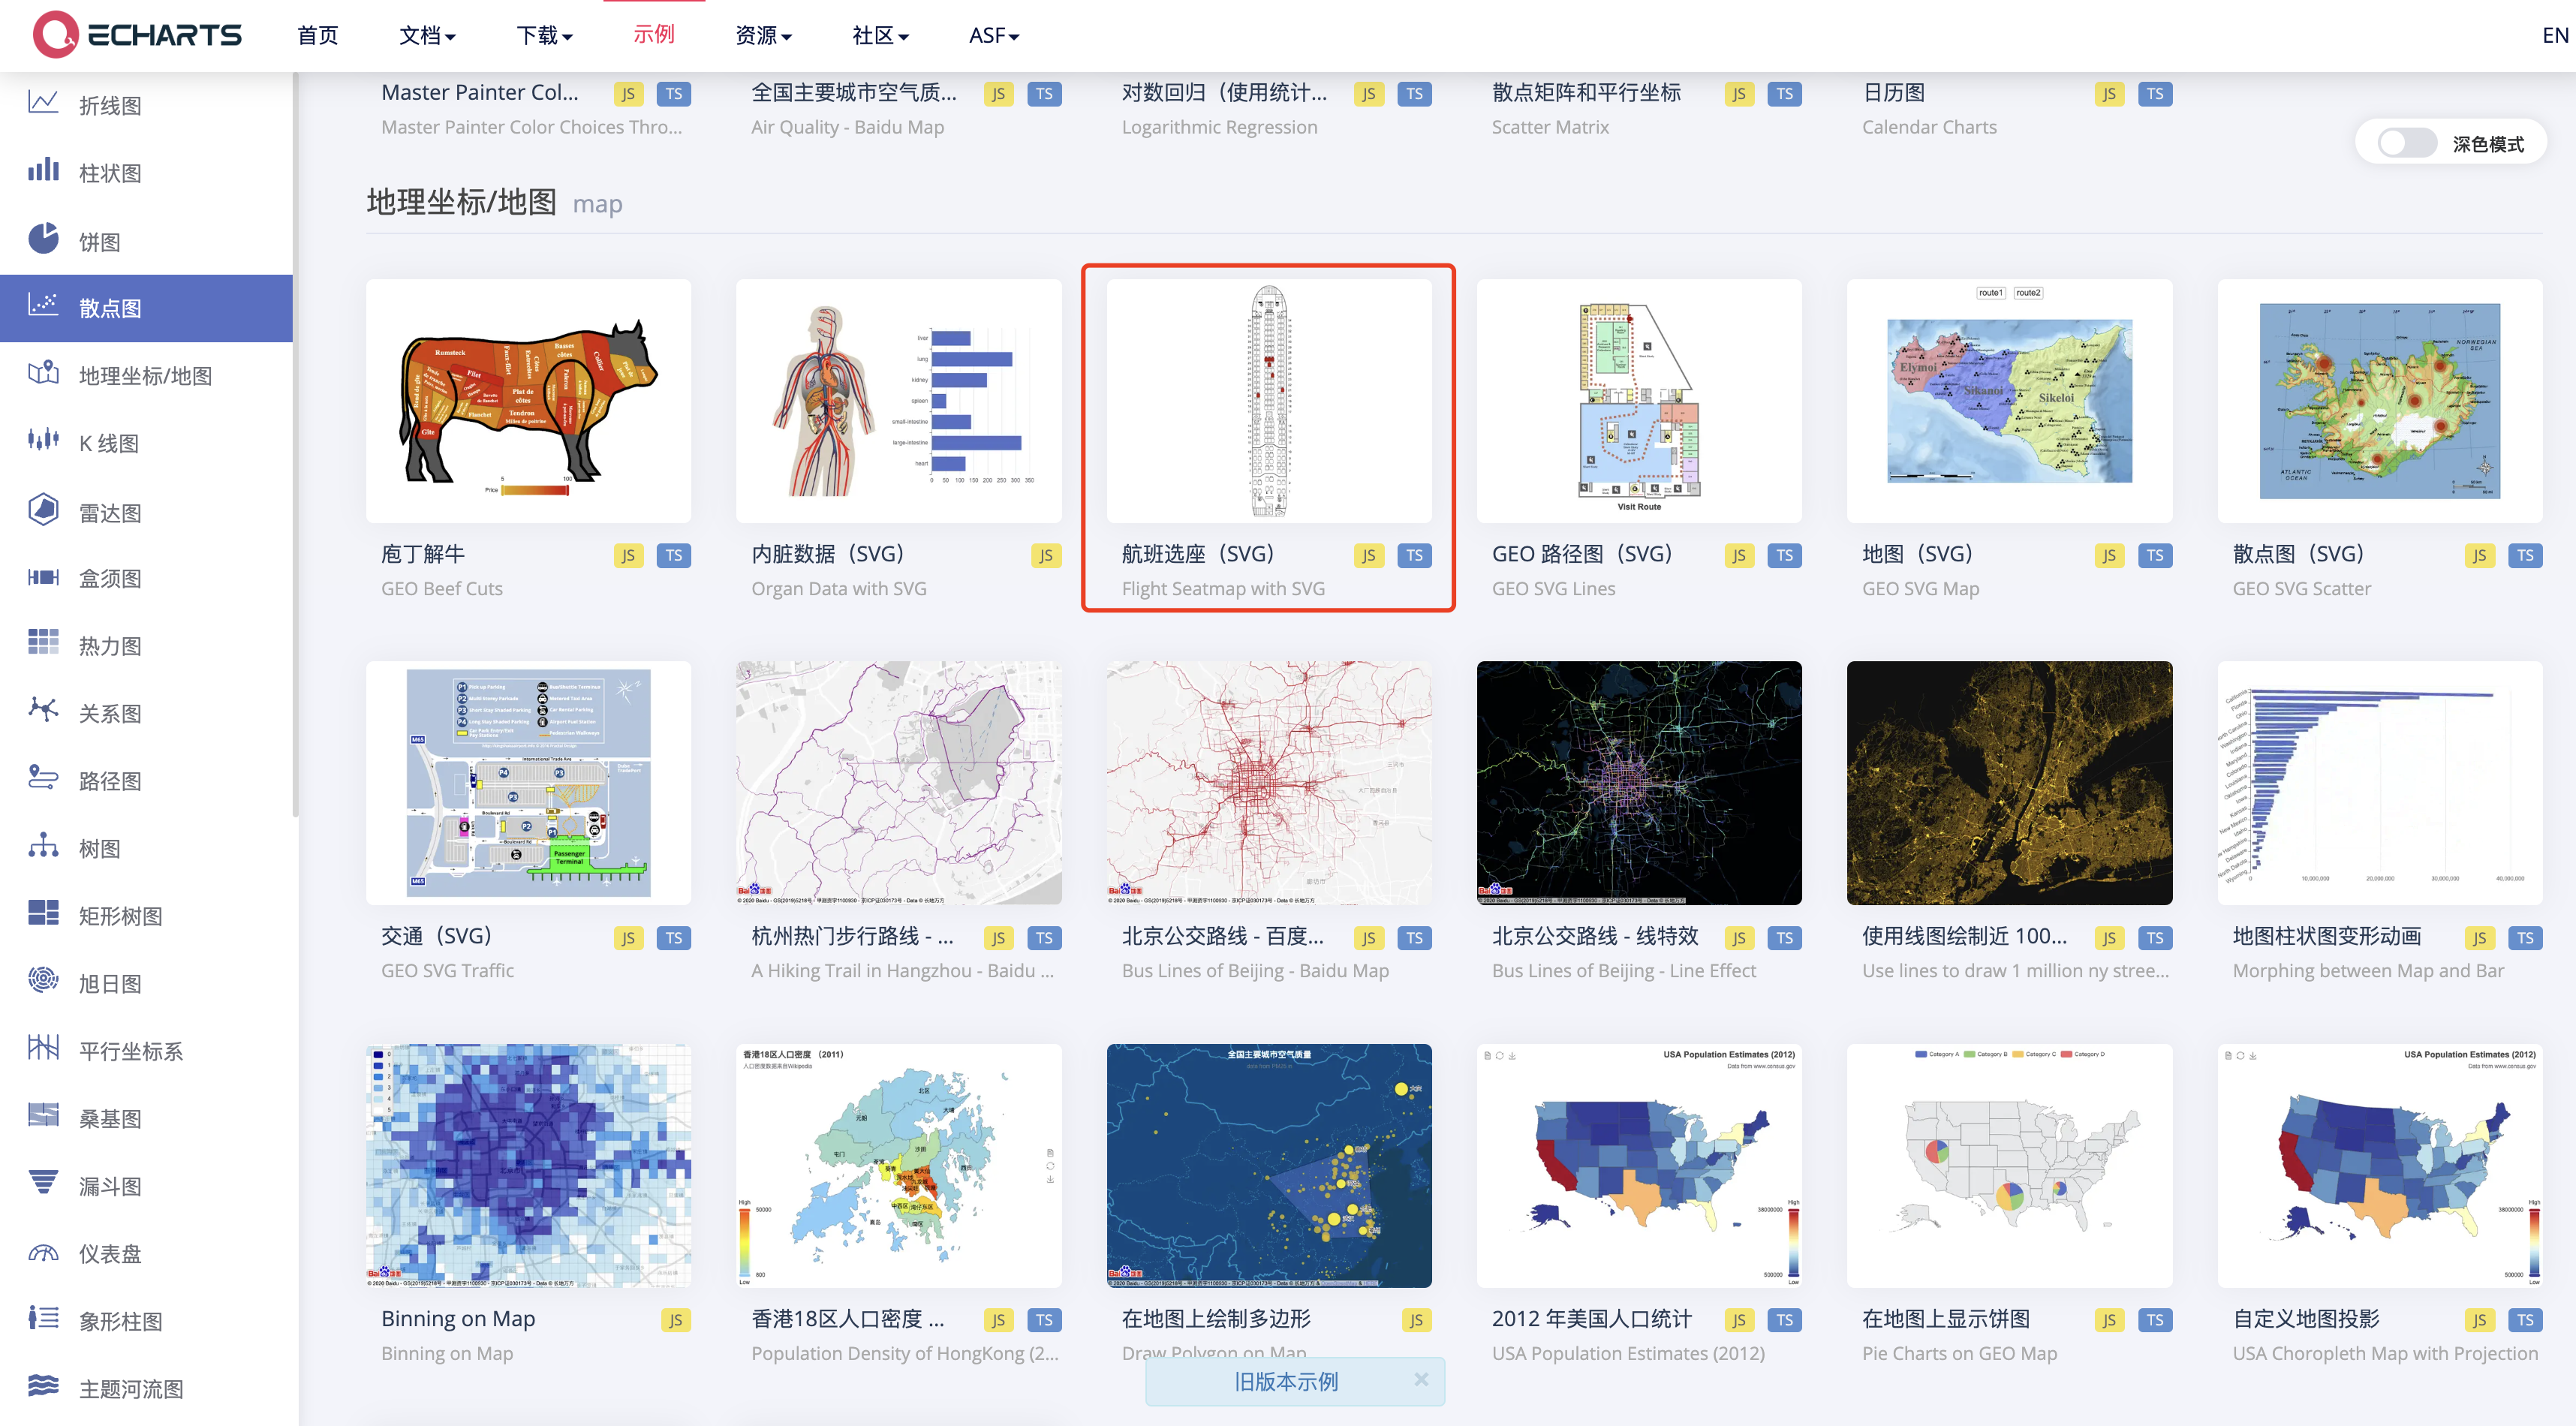
2. 前往 Echarts 官网 查看应用示例,选择航班选座(SVG)。

3. 复制航班选座(SVG)示例完整代码下的配置内容。
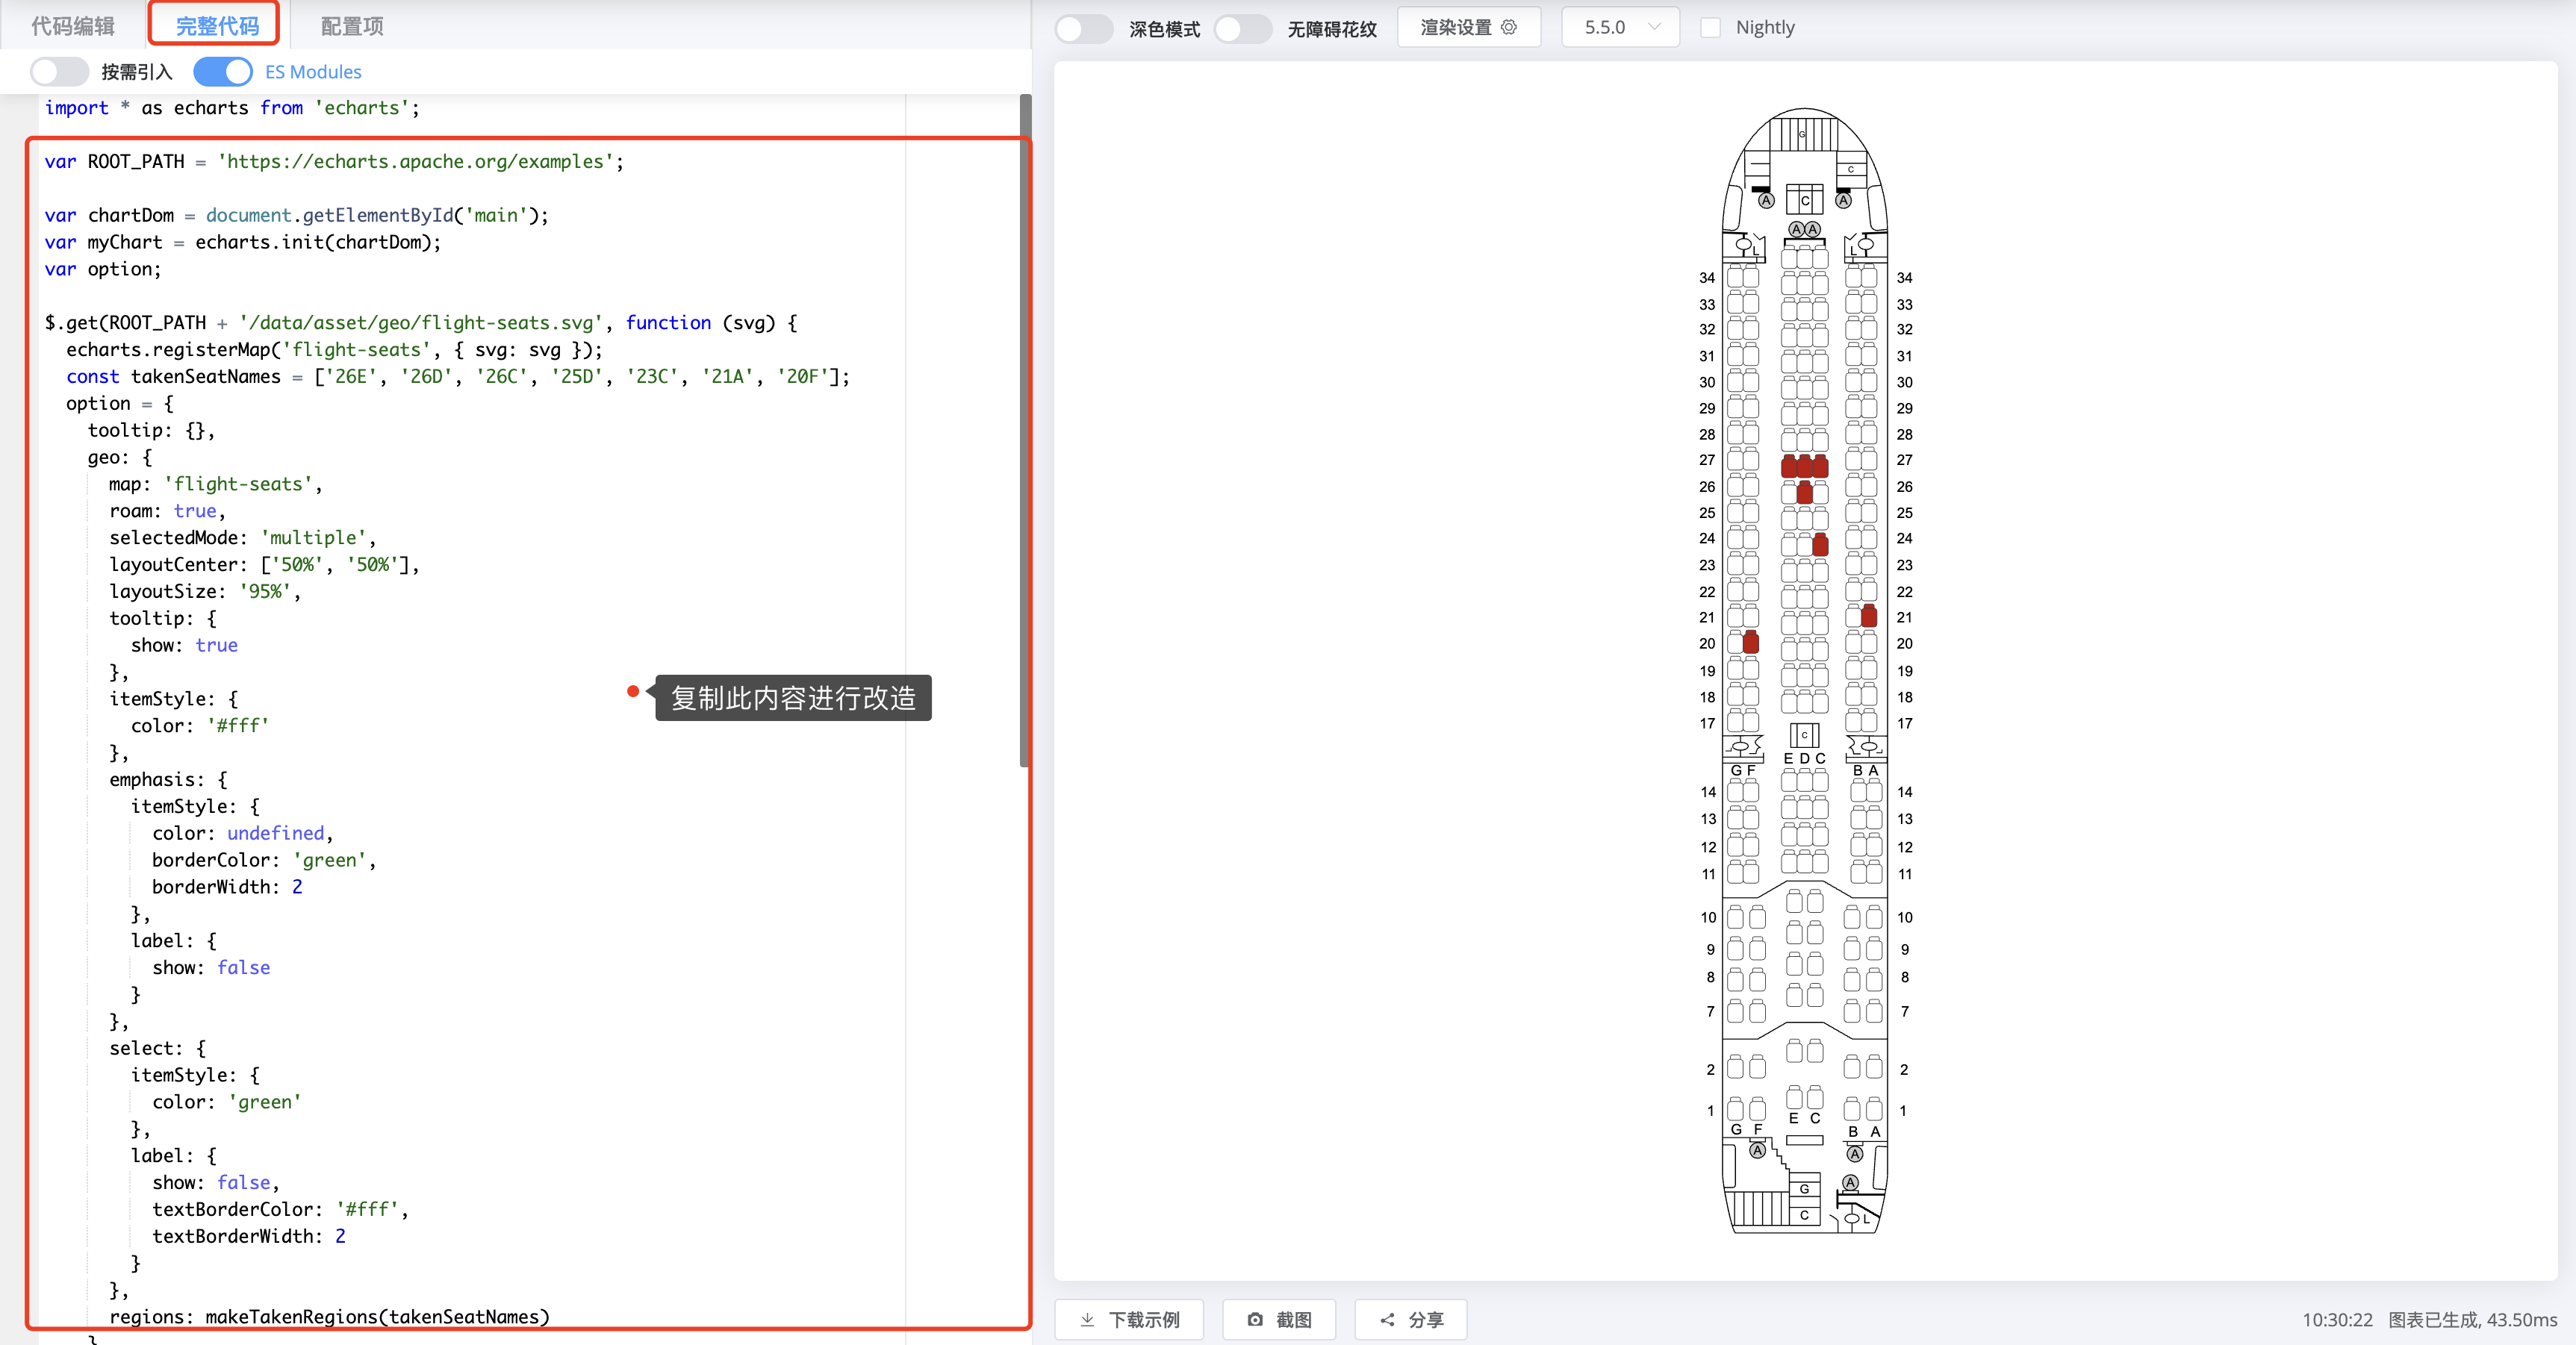

4. 将在上述复制的内容粘贴到
function1 方法中。export default async function ({ event }) {let res = await fetch('https://lowcode-0ghsfkoo8e3f415d-1258057692.tcloudbaseapp.com/resources/2024-06/lowcode-1834792', {headers: {'Content-Type': 'image/svg+xml'},method: 'GET'})const svg = await res.text()$w.chart1.echarts.registerMap('flight-seats', { svg: svg });const takenSeatNames = ['26E', '26D', '26C', '25D', '23C', '21A', '20F'];const option = {tooltip: {},geo: {map: 'flight-seats',roam: true,selectedMode: 'multiple',layoutCenter: ['50%', '50%'],layoutSize: '95%',tooltip: {show: true},itemStyle: {color: '#fff'},emphasis: {itemStyle: {color: undefined,borderColor: 'green',borderWidth: 2},label: {show: false}},select: {itemStyle: {color: 'green'},label: {show: false,textBorderColor: '#fff',textBorderWidth: 2}},regions: makeTakenRegions(takenSeatNames)}};function makeTakenRegions(takenSeatNames) {var regions = [];for (var i = 0; i < takenSeatNames.length; i++) {regions.push({name: takenSeatNames[i],silent: true,itemStyle: {color: '#bf0e08'},emphasis: {itemStyle: {borderColor: '#aaa',borderWidth: 1}},select: {itemStyle: {color: '#bf0e08'}}});}return regions;}$w.chart1.echartsInstance.setOption(option);// Get selected seats.$w.chart1.echartsInstance.on('geoselectchanged', function (params) {const selectedNames = params.allSelected[0].name.slice();// Remove taken seats.for (var i = selectedNames.length - 1; i >= 0; i--) {if (takenSeatNames.indexOf(selectedNames[i]) >= 0) {selectedNames.splice(i, 1);}}console.log('selected', selectedNames);});}
说明:
模仿 Echarts 的示例改造,替换对应组件属性,
echarts 对应 $w.chart1.echarts, myChart 对应 $w.chart1.echartsInstance。Echarts 示例代码中的
$.get 请求需要进行相应的改造。SVG 文件需要预先获取完整访问地址。
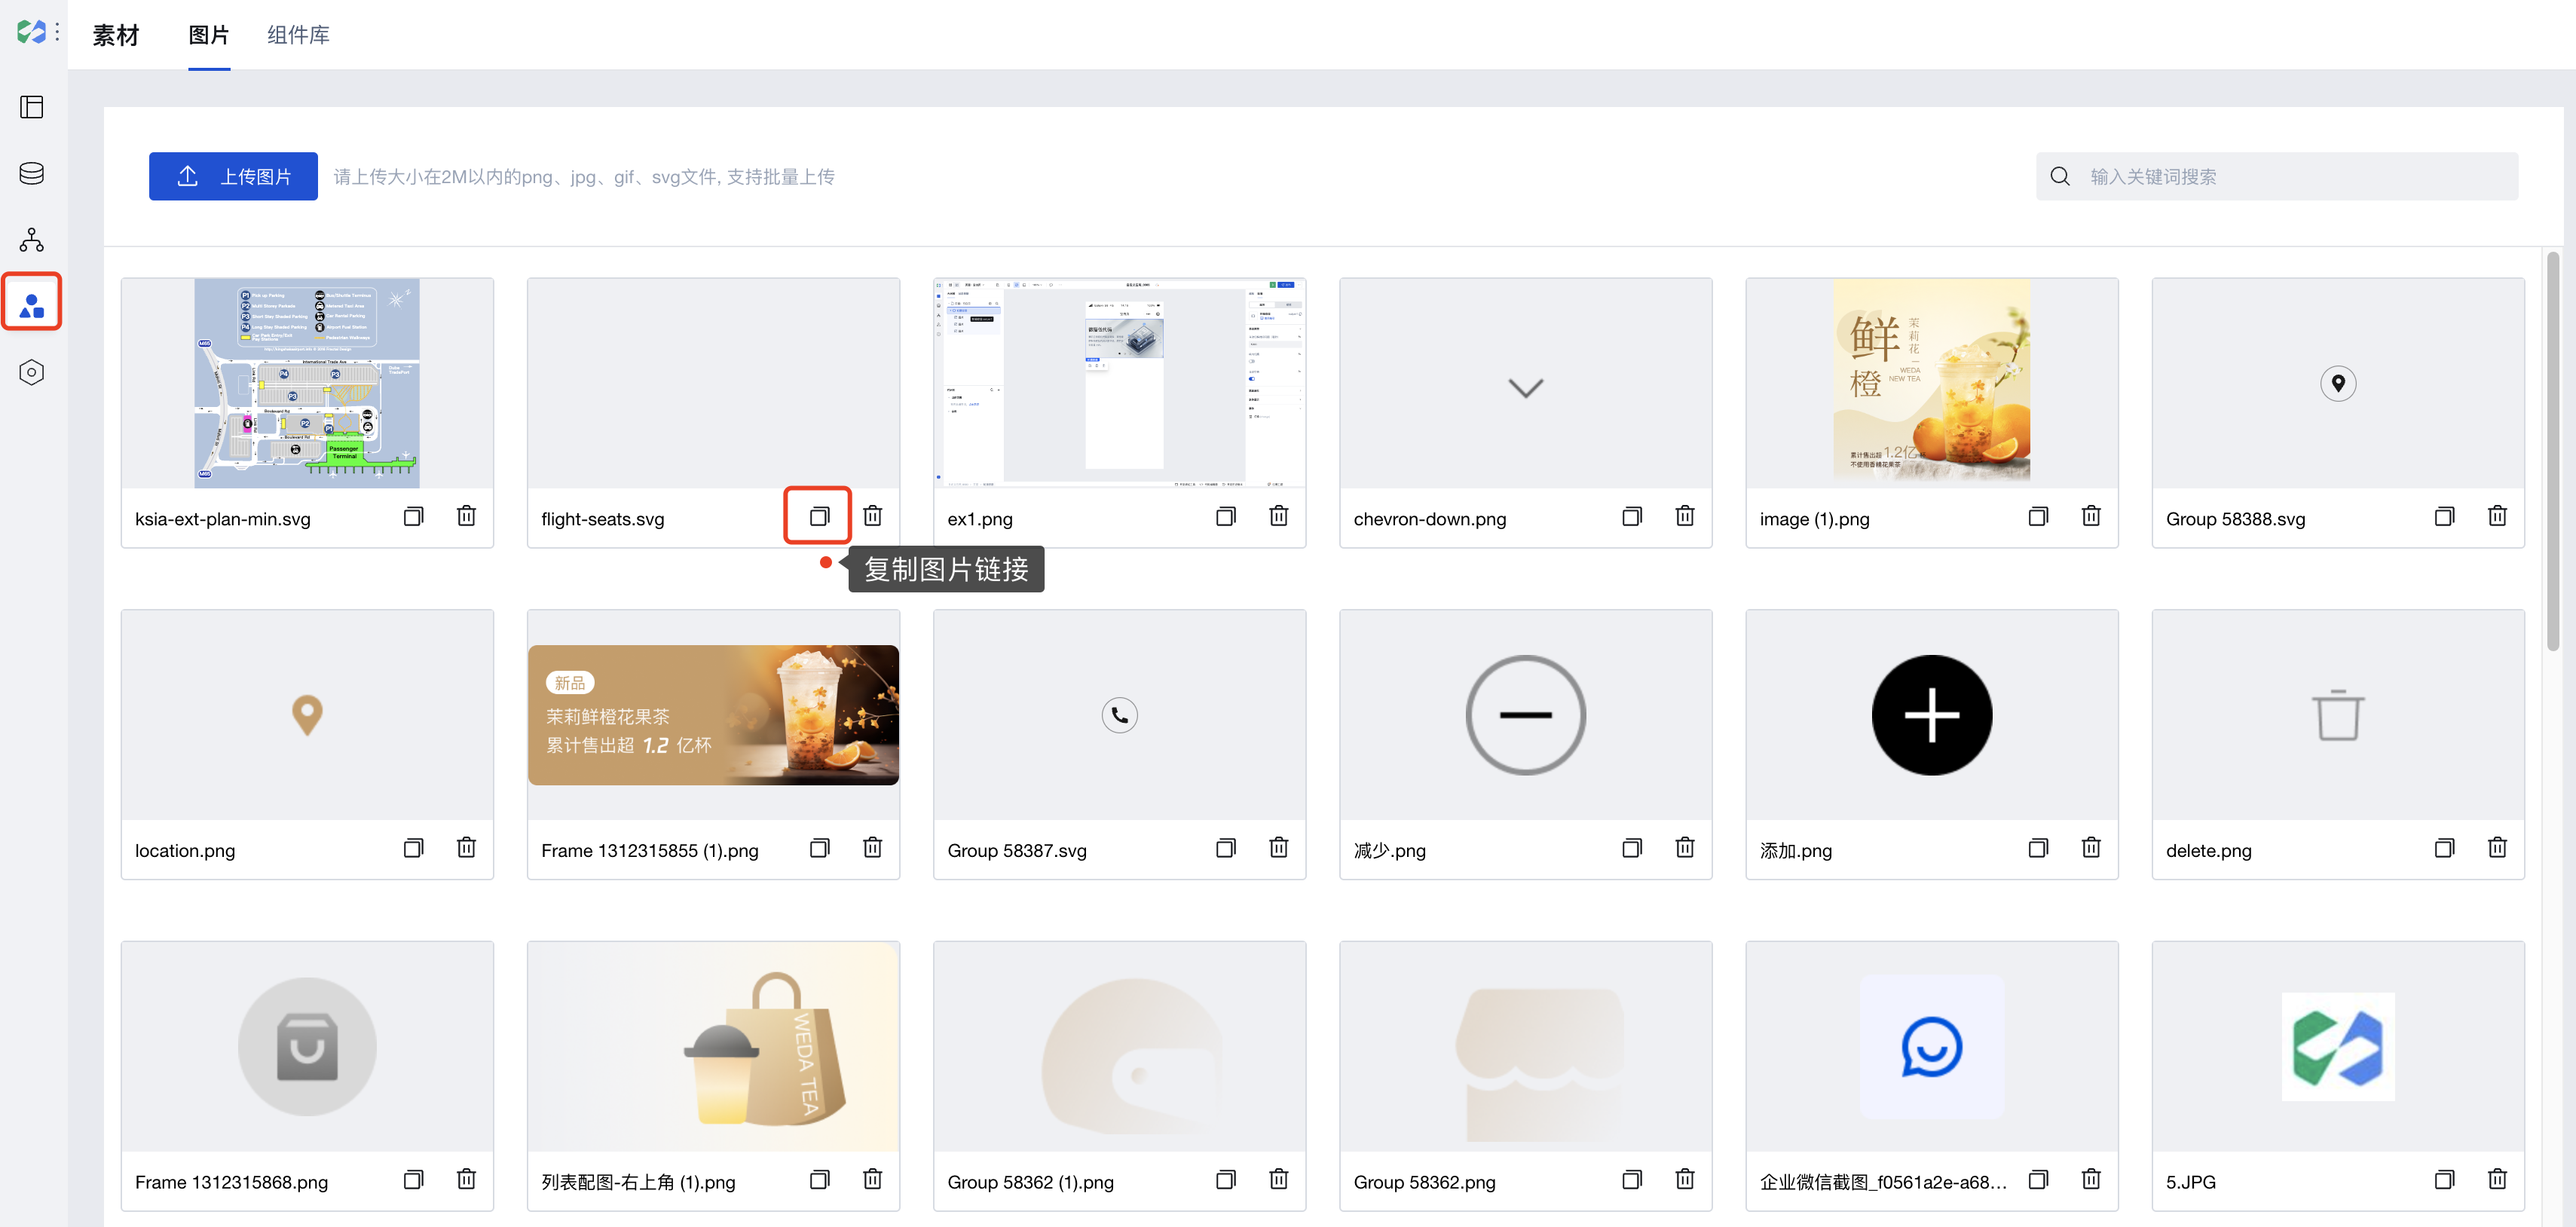

5. 更多图表组件图表 Ready 事件绑定
function1 方法。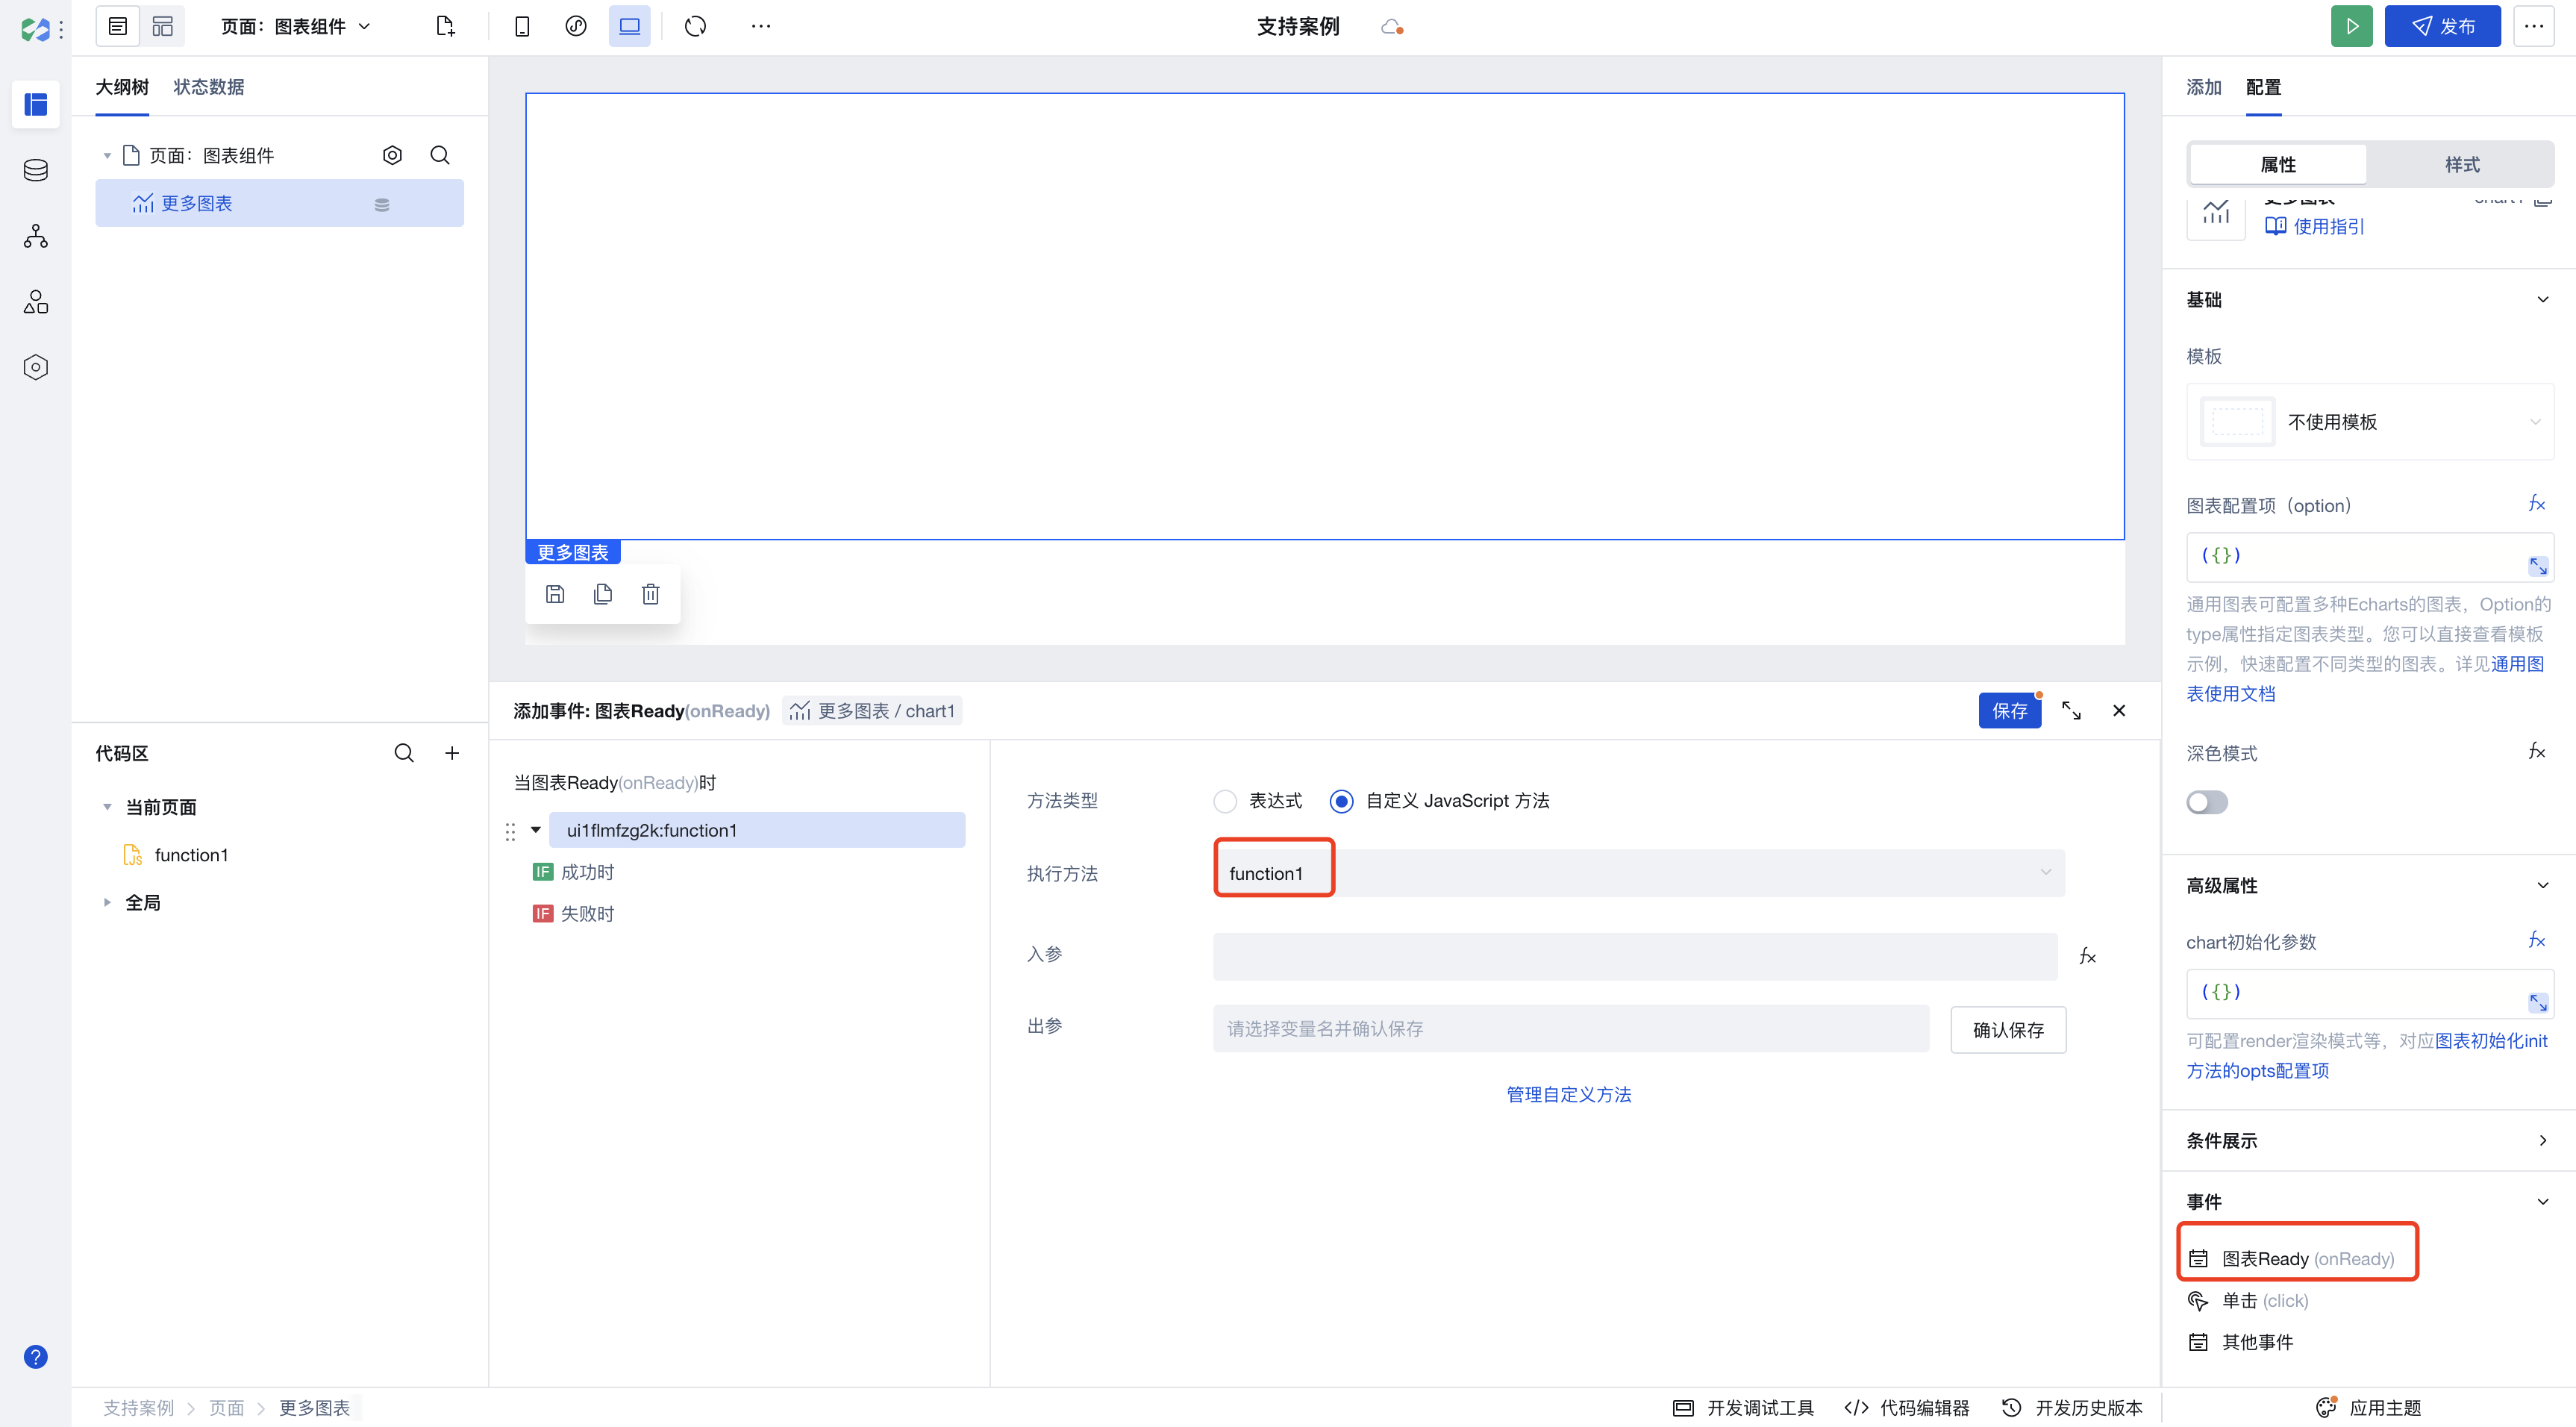

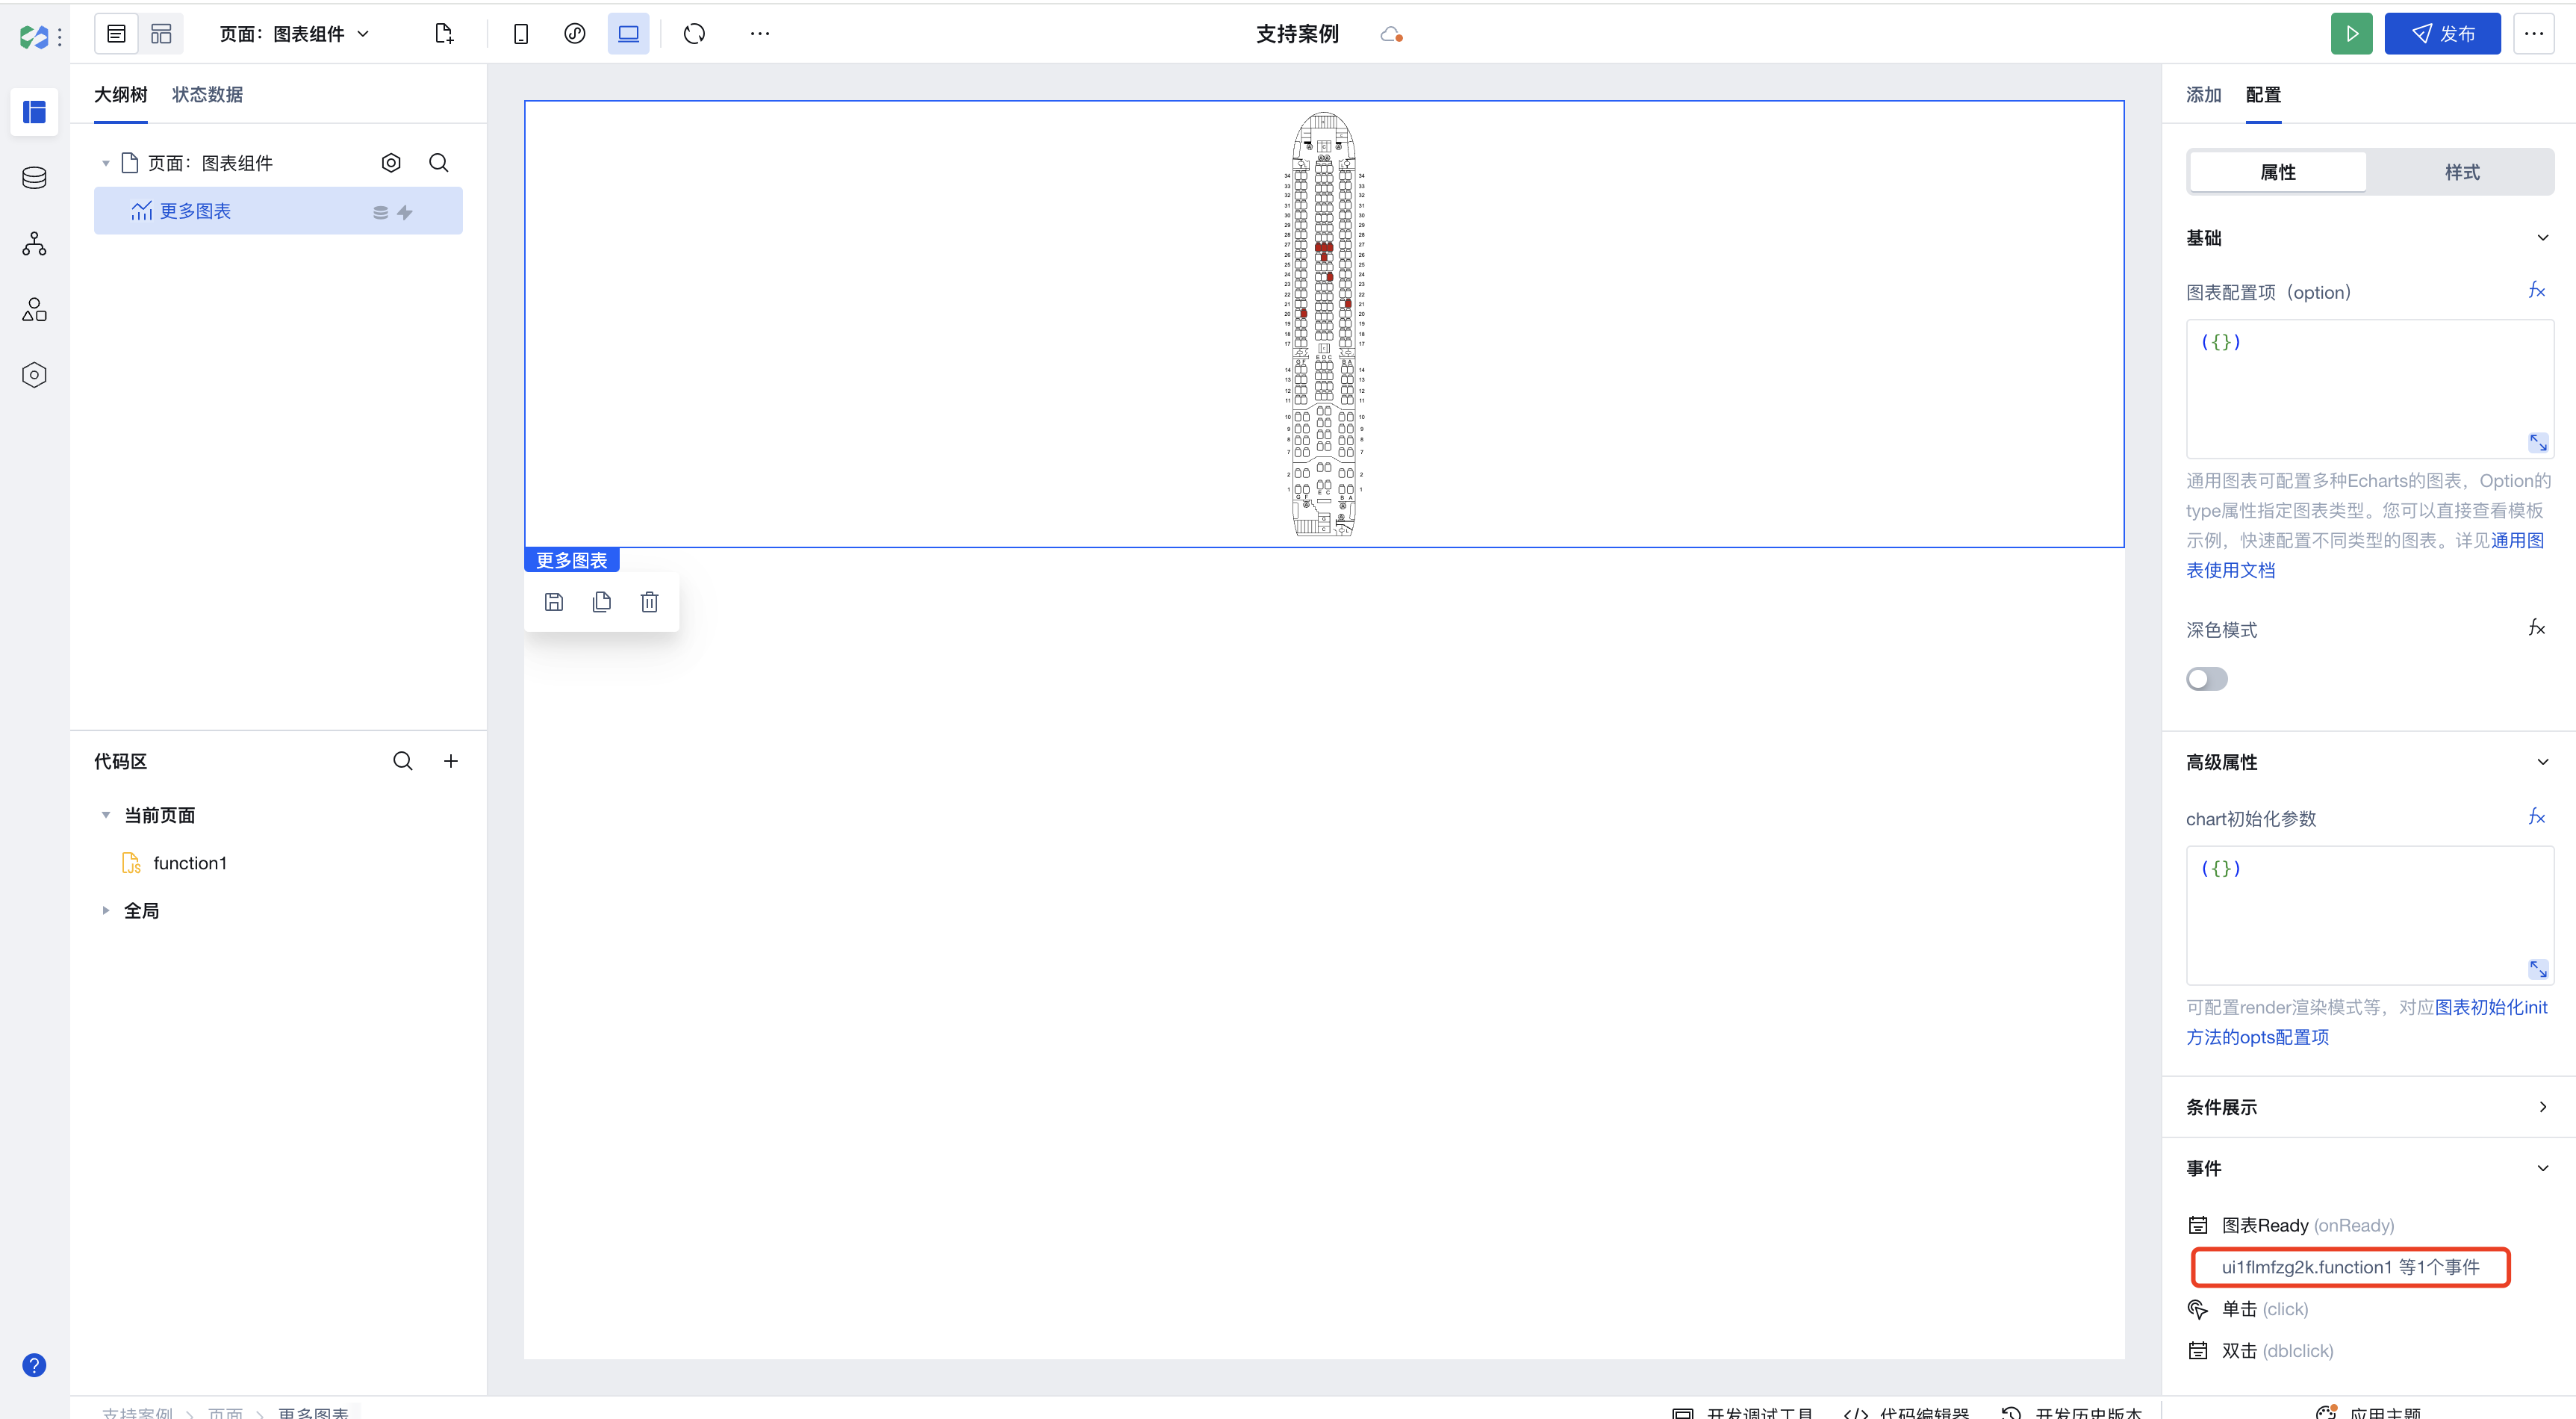
6. 图表配置完成,效果展示。

更多图表组件引用地图
1. 在编辑器中使用更多图表组件,并将图表默认配置项清除,并新建自定义
javascript 方法 function1。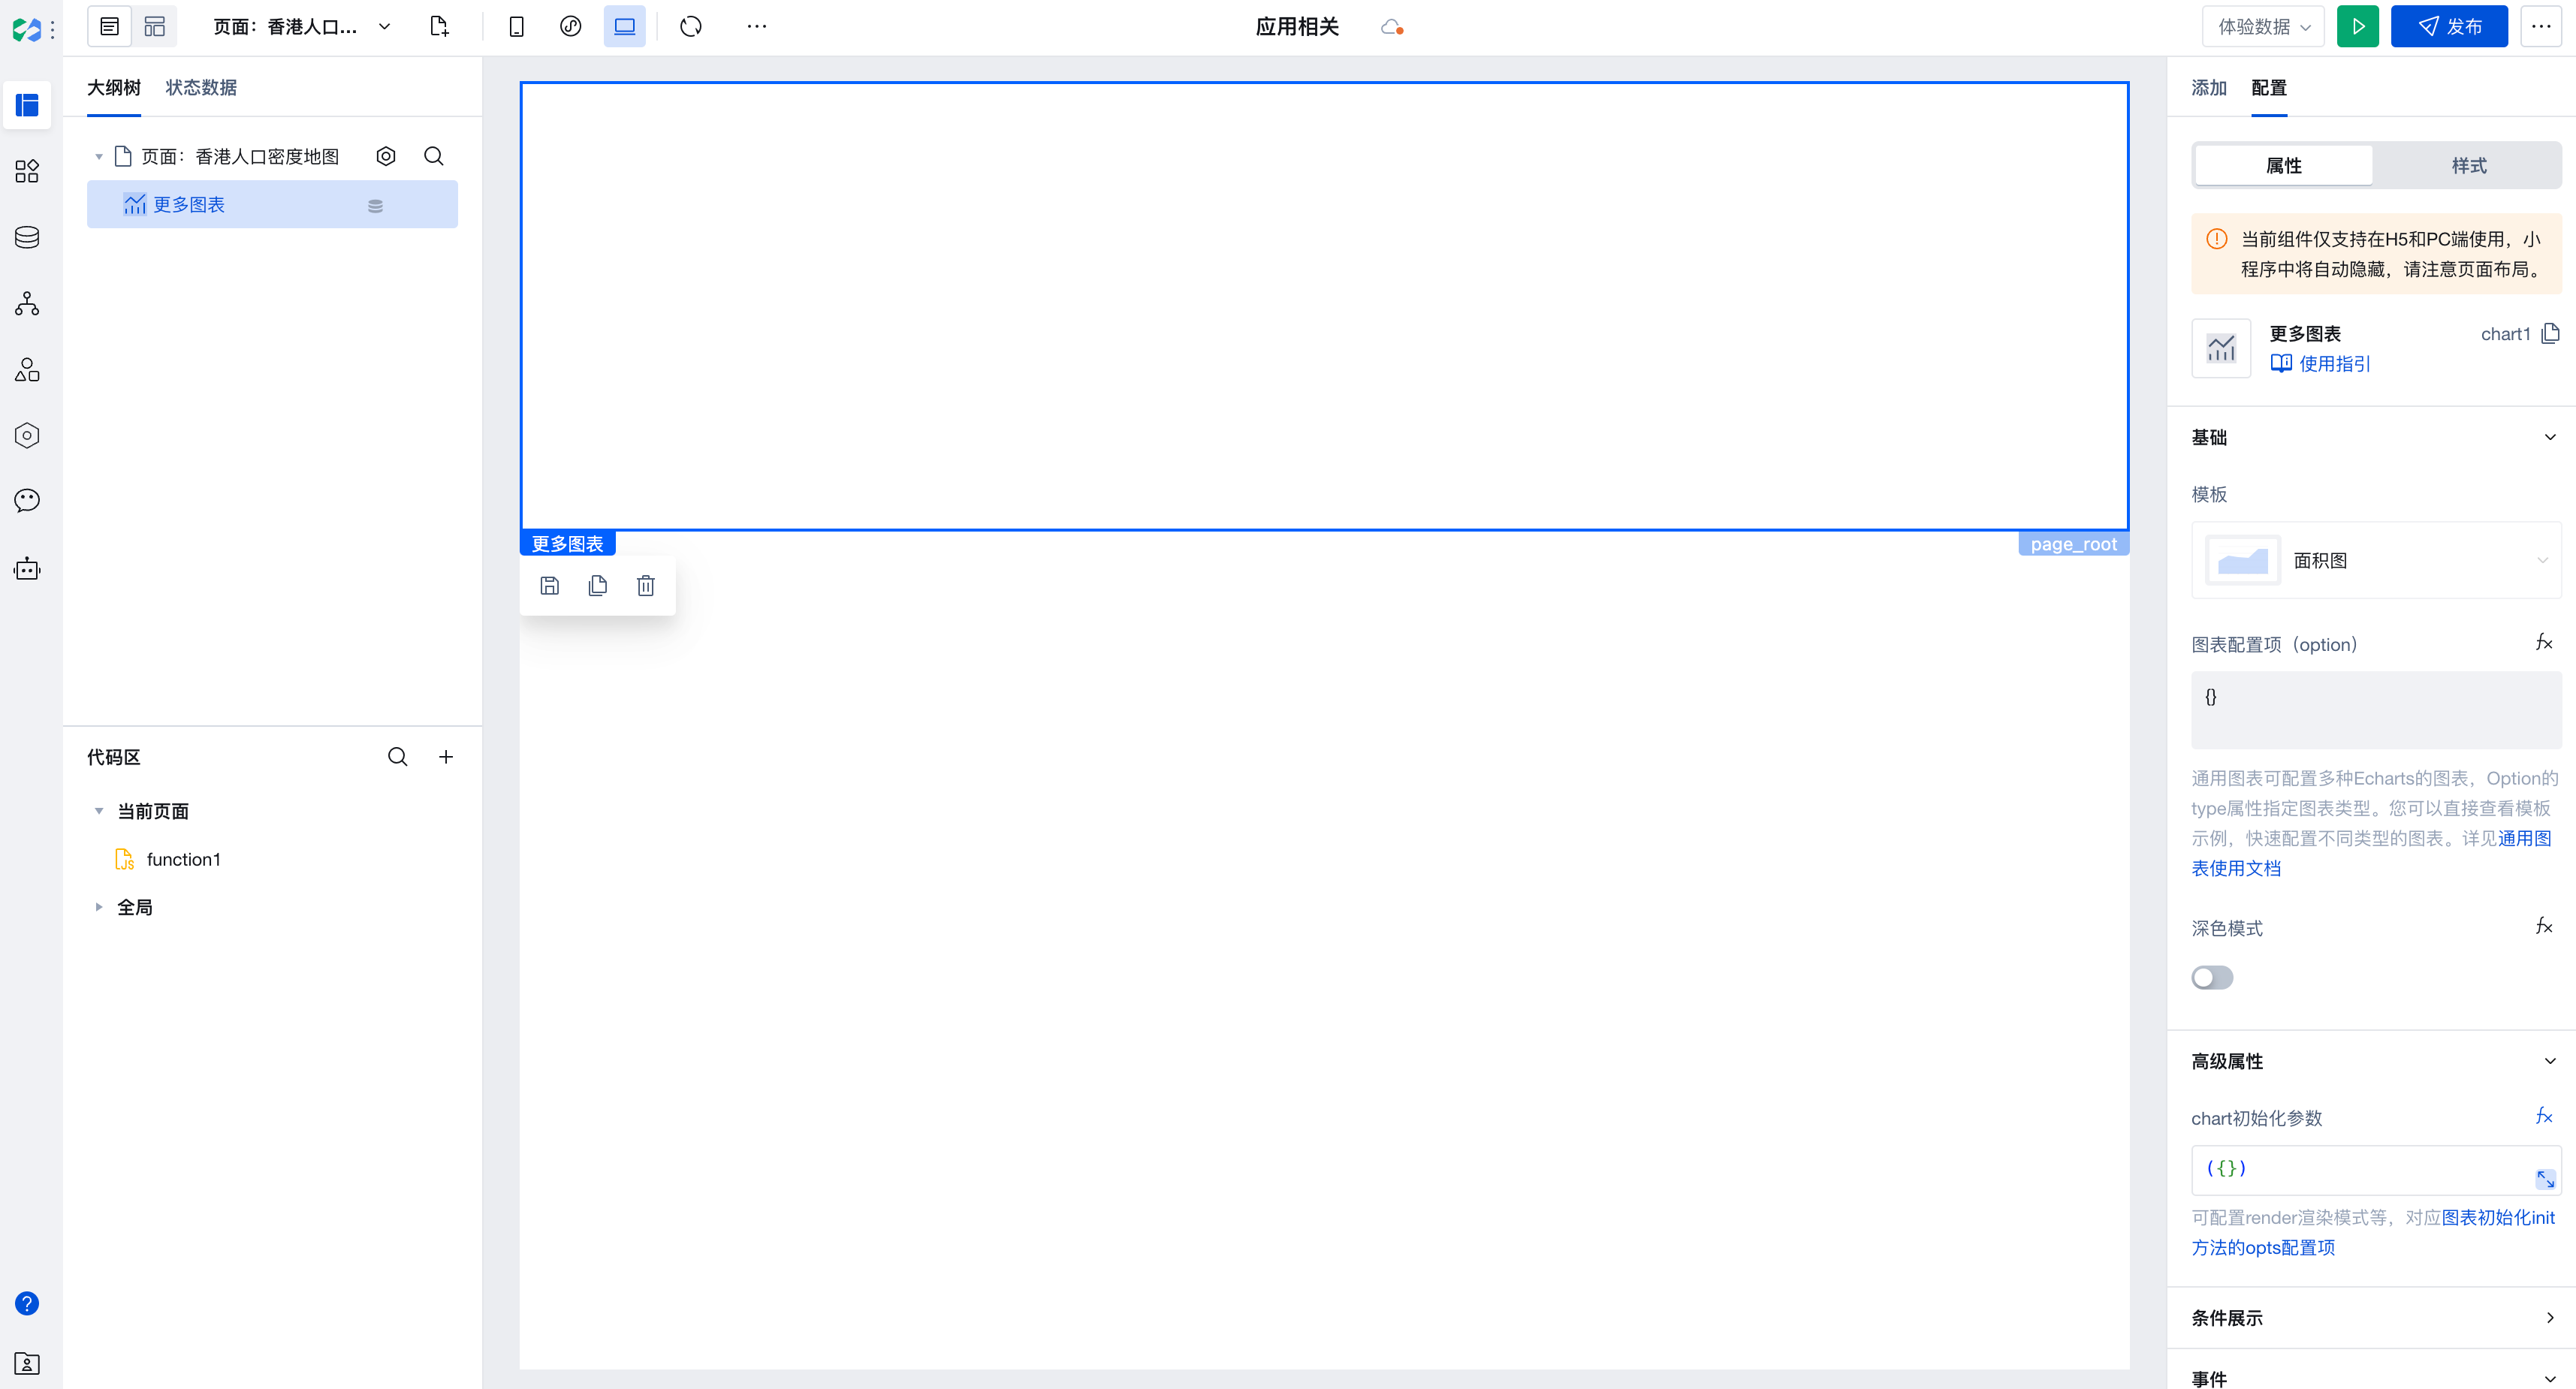

2. 前往 Echarts 官网 查看应用示例,选择中国香港人口密度地图。
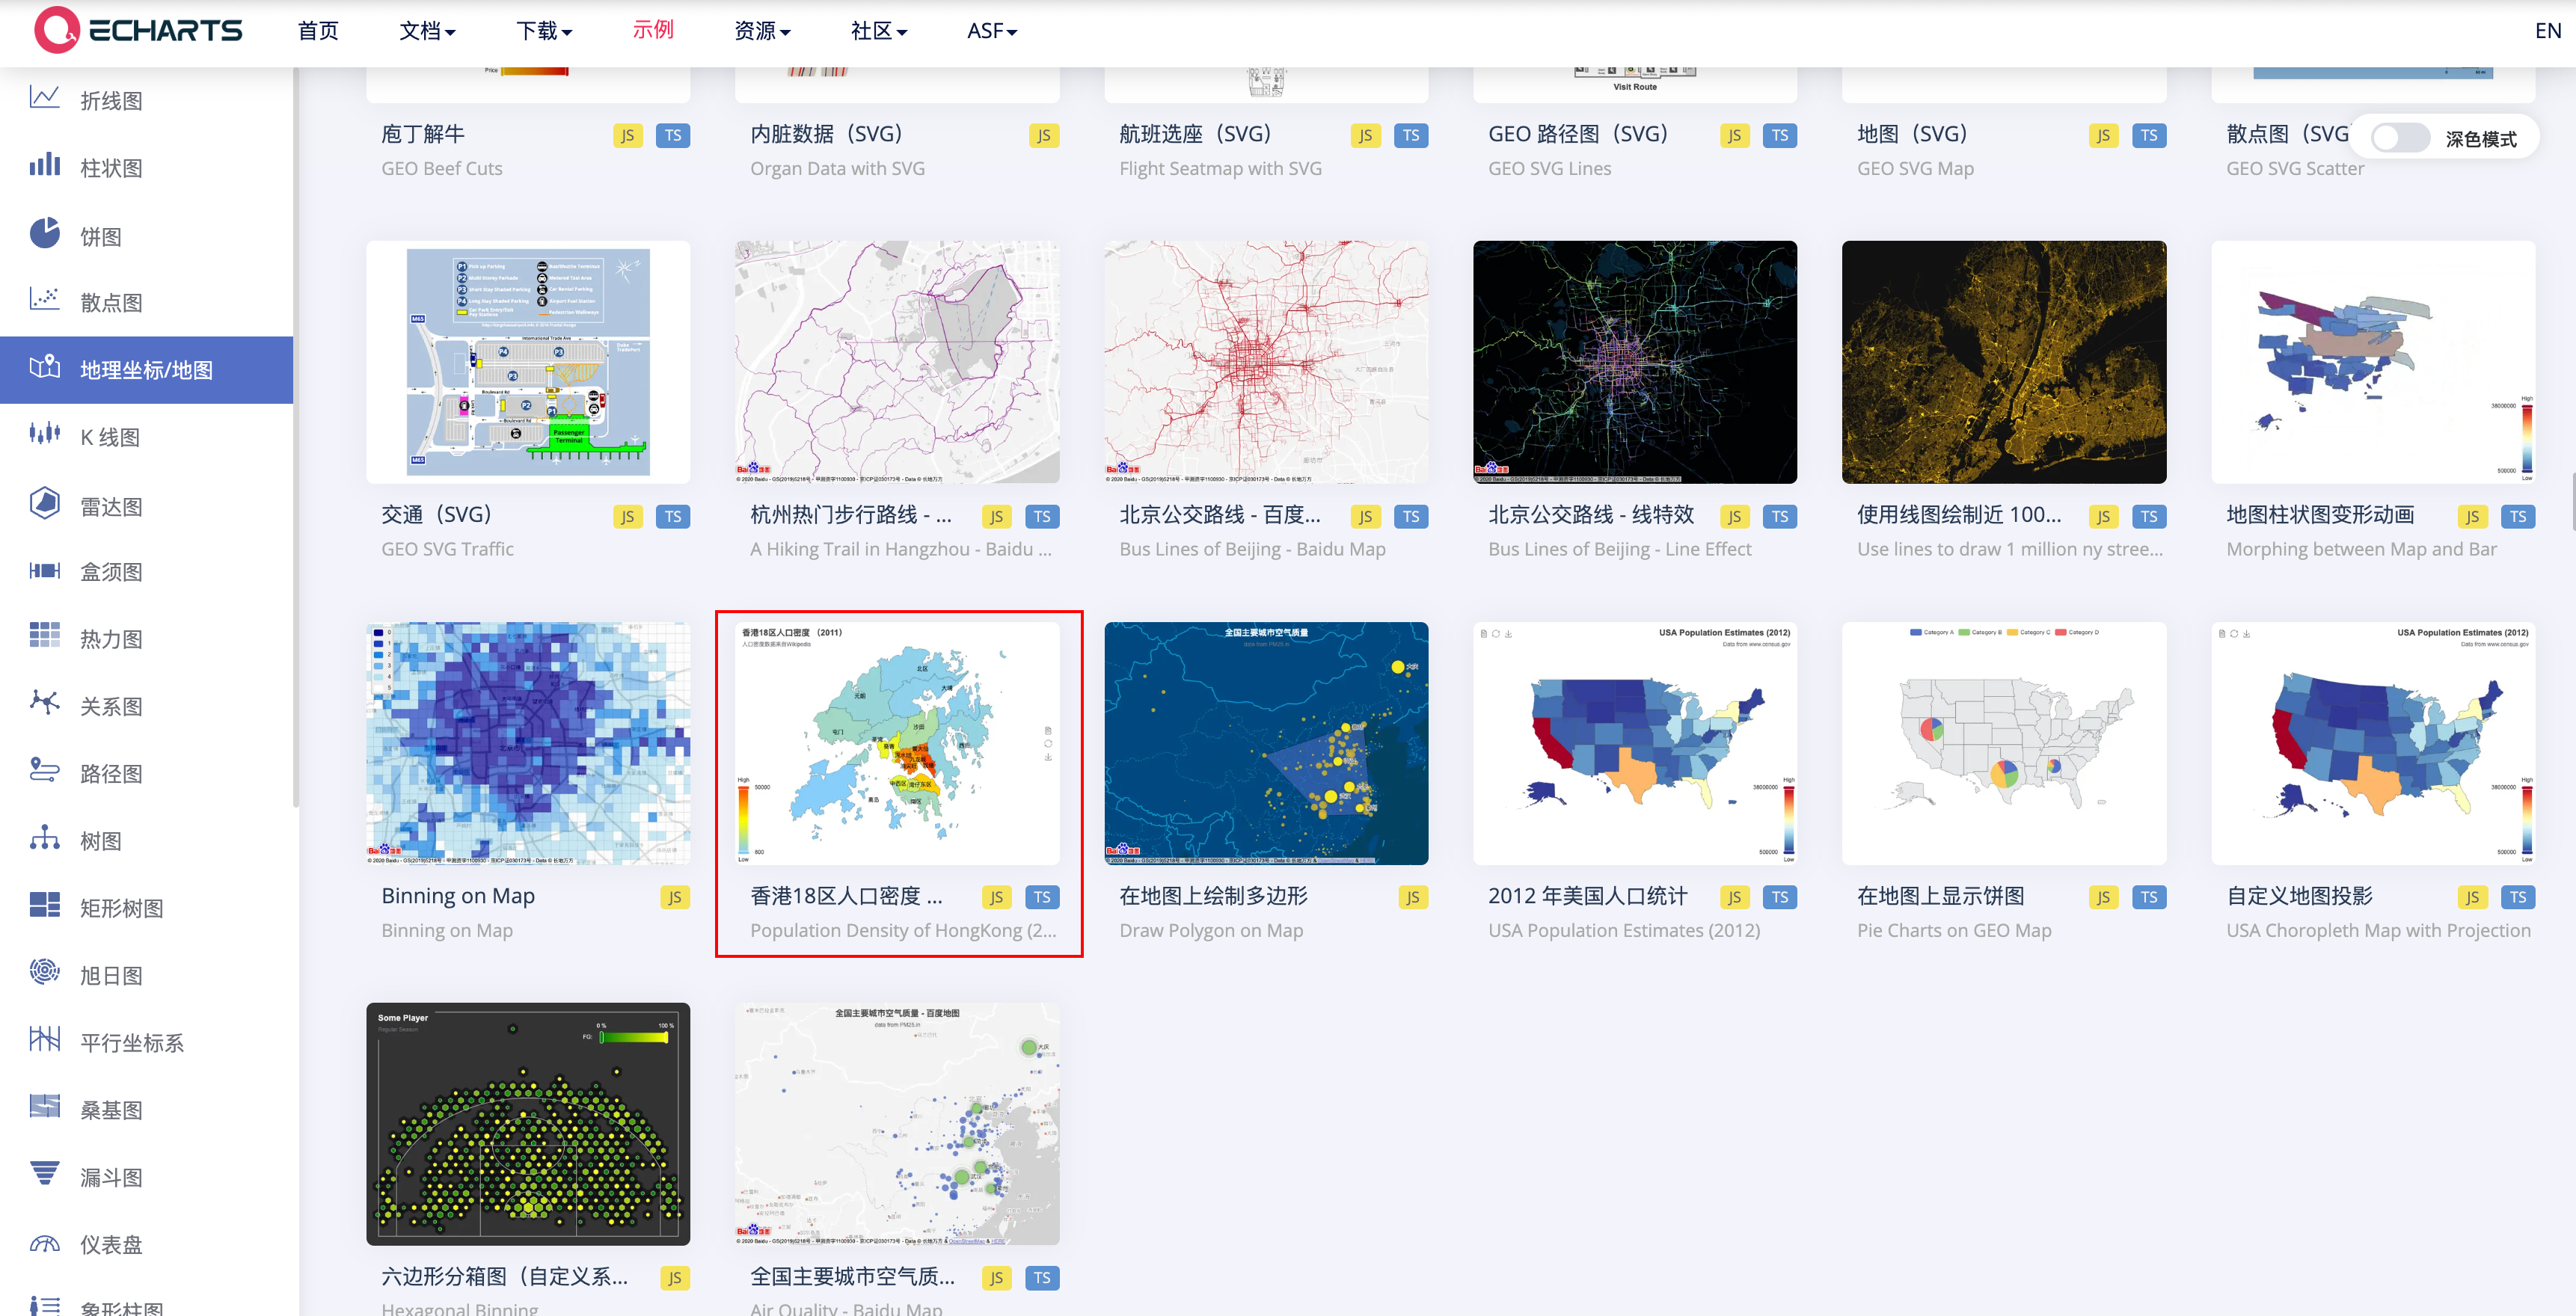

3. 中国香港人口密度地图示例完整代码下的配置内容。
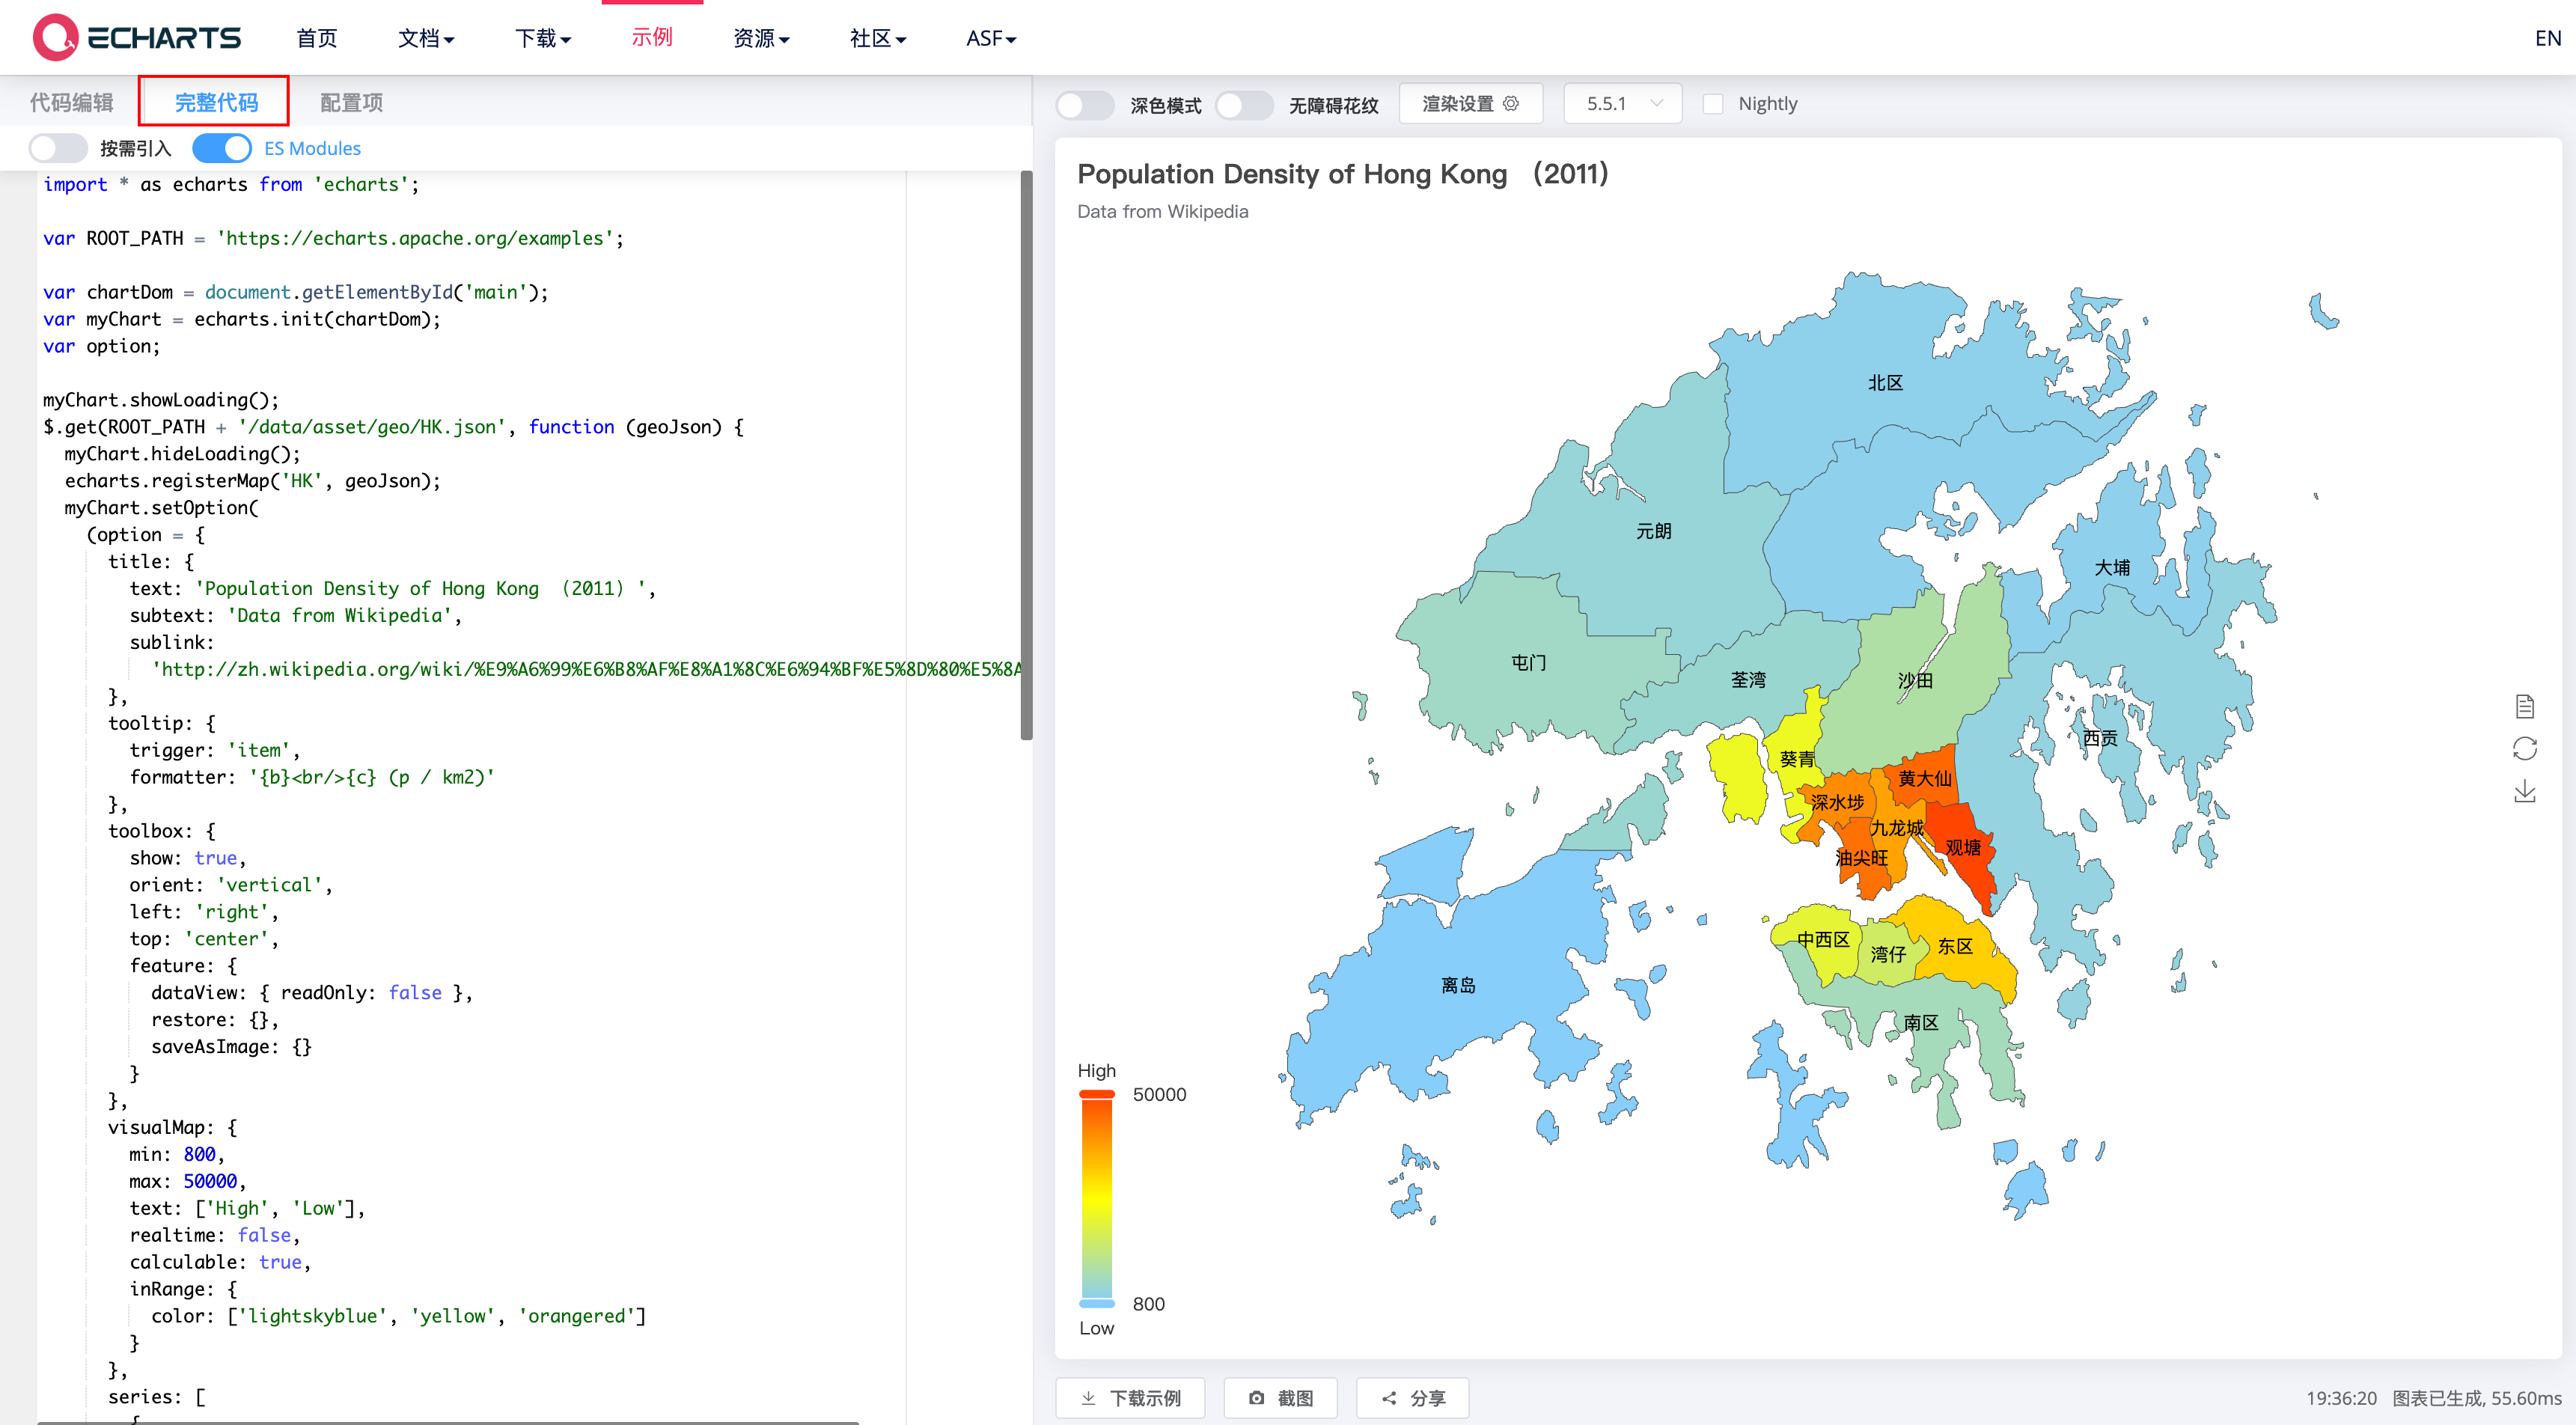

4. 将在上述复制的内容粘贴到
function1 方法中,并进行相应改造。export default async function ({ event, data }) {let area_people = data.target //地区对应人口数据,这里是动态传参let myChart = $w.chart1.echartsInstance;let option;myChart.showLoading();await fetch('https://6c6f-lowcode-0ghsfkoo8e3f415d-1258057692.tcb.qcloud.la/weda-uploader/hk.json?sign=94bcc4df9a7938020c26e8d3fa637660&t=1727353720').then(response => {if (!response.ok) {throw new Error(`HTTP error! status: ${response.status}`);}return response.text(); // 或者 response.json() 如果返回的是JSON数据}).then(data => {console.log(data); // 在这里处理获取到的数据myChart.hideLoading();$w.chart1.echarts.registerMap('HK', data);myChart.setOption((option = {title: {text: 'Population Density of Hong Kong (2011)',subtext: 'Data from Wikipedia',sublink:'http://zh.wikipedia.org/wiki/%E9%A6%99%E6%B8%AF%E8%A1%8C%E6%94%BF%E5%8D%80%E5%8A%83#cite_note-12'},tooltip: {trigger: 'item',formatter: '{b}<br/>{c} (p / km2)'},toolbox: {show: true,orient: 'vertical',left: 'right',top: 'center',feature: {dataView: { readOnly: false },restore: {},saveAsImage: {}}},visualMap: {min: 800,max: 50000,text: ['High', 'Low'],realtime: false,calculable: true,inRange: {color: ['lightskyblue', 'yellow', 'orangered']}},series: [{name: '中国香港18区人口密度',type: 'map',map: 'HK',label: {show: true},data: area_people, //这里使用接收的动态参数// 自定义名称映射nameMap: {'Central and Western': '中西区',Eastern: '东区',Islands: '离岛','Kowloon City': '九龙城','Kwai Tsing': '葵青','Kwun Tong': '观塘',North: '北区','Sai Kung': '西贡','Sha Tin': '沙田','Sham Shui Po': '深水埗',Southern: '南区','Tai Po': '大埔','Tsuen Wan': '荃湾','Tuen Mun': '屯门','Wan Chai': '湾仔','Wong Tai Sin': '黄大仙','Yau Tsim Mong': '油尖旺','Yuen Long': '元朗'}}]}));}).catch(error => {console.error('Error fetching data:', error);});option && myChart.setOption(option);}
说明:
echarts 对应
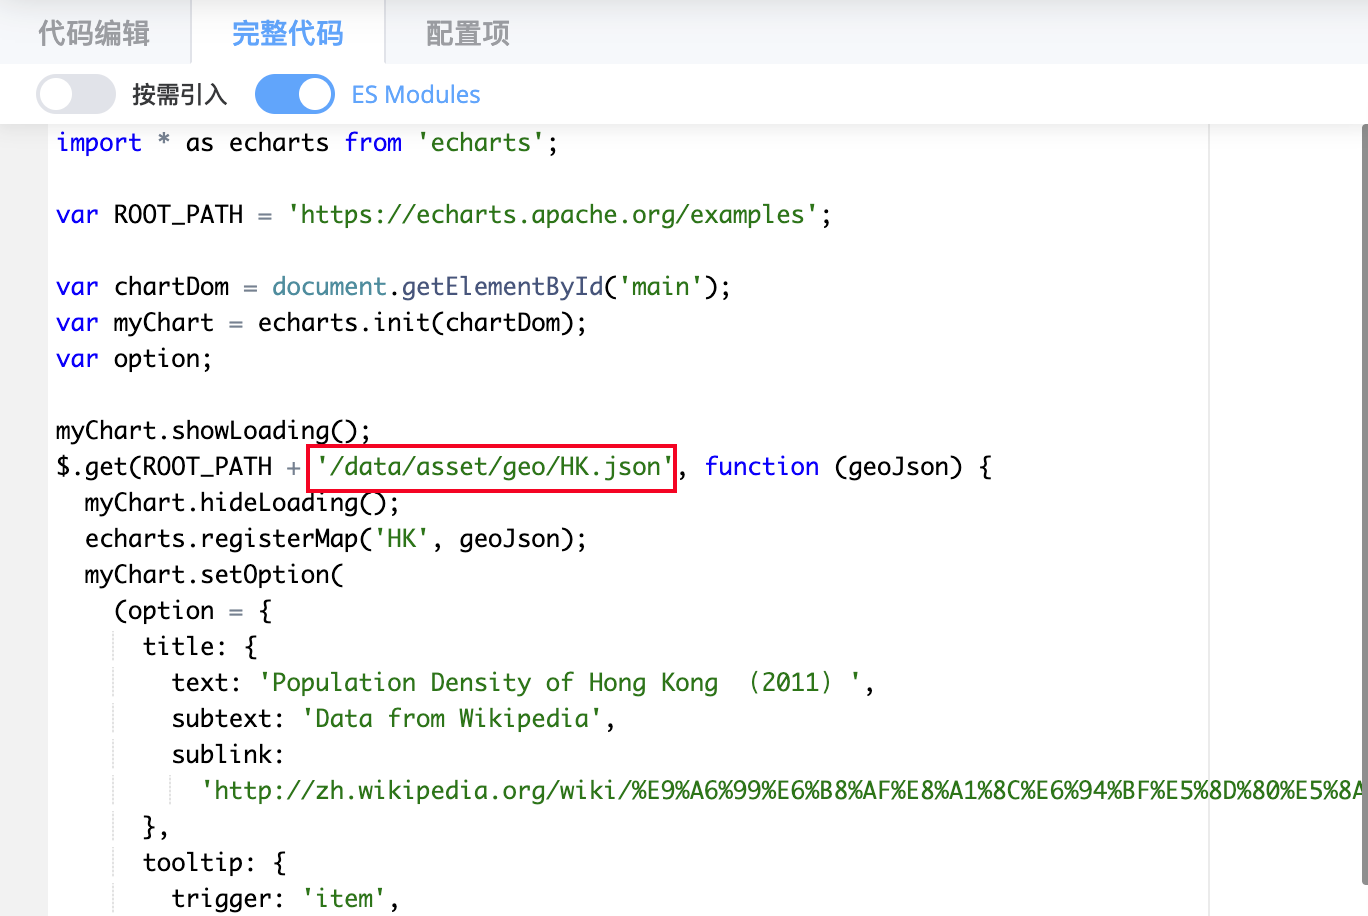
$w.chart1.echarts, myChart 对应 $w.chart1.echartsInstance。获取 echarts 示例当中的 json 文件,并上传到云储存,生成可以访问的 HTTP 链接(json 文件请自行上传),在微搭 javascript 方法中用 fetch() 函数,发送 HTTP 请求来获取 URL 资源。

地图数据封装成外部数据来源,作为参数在调用js方法的时候进行传递。
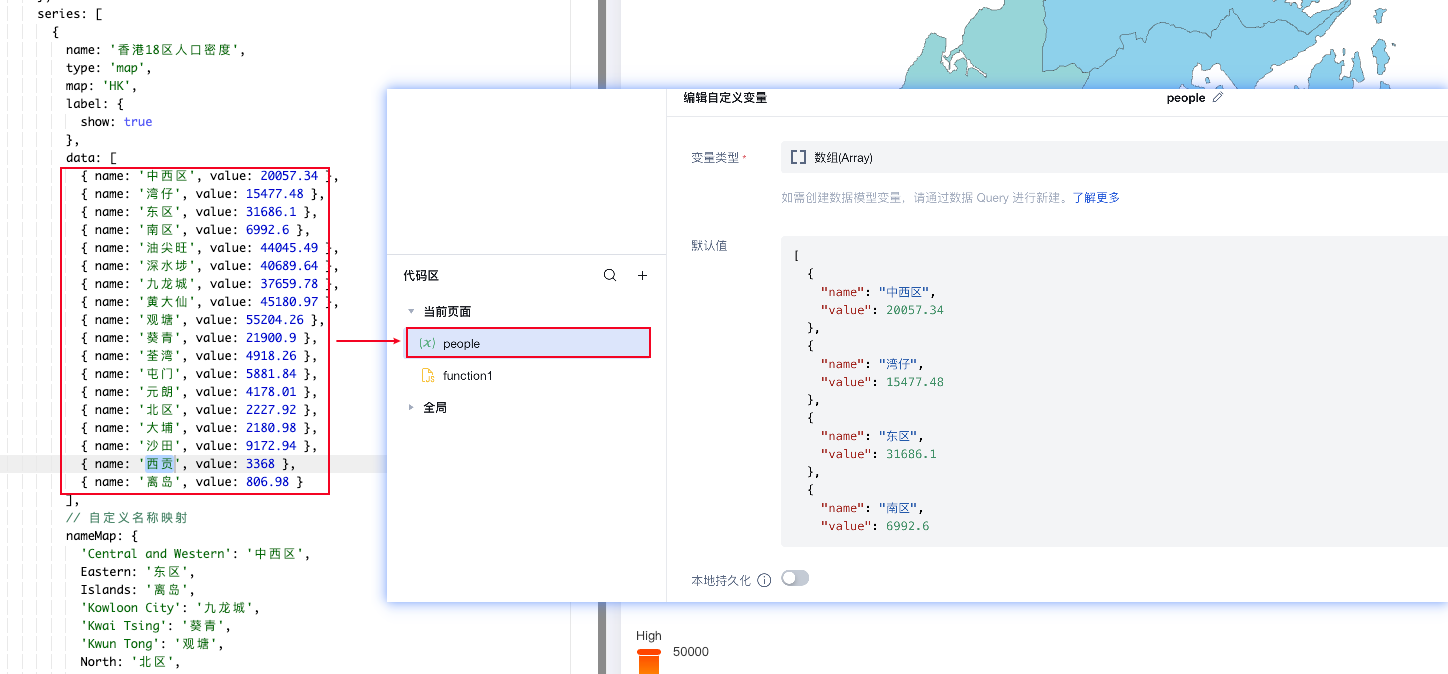

js 方法中接收参数。


5. 更多图表组件图表 Ready 事件绑定
function1 方法并传递入参变量 people。

说明:
实际业务场景中,调用 js 方法入参可以来自数据模型 query 查询以及 APIs 调用外部数据源,可以将相关接口返回数据改造成示例需要的参数格式即可。
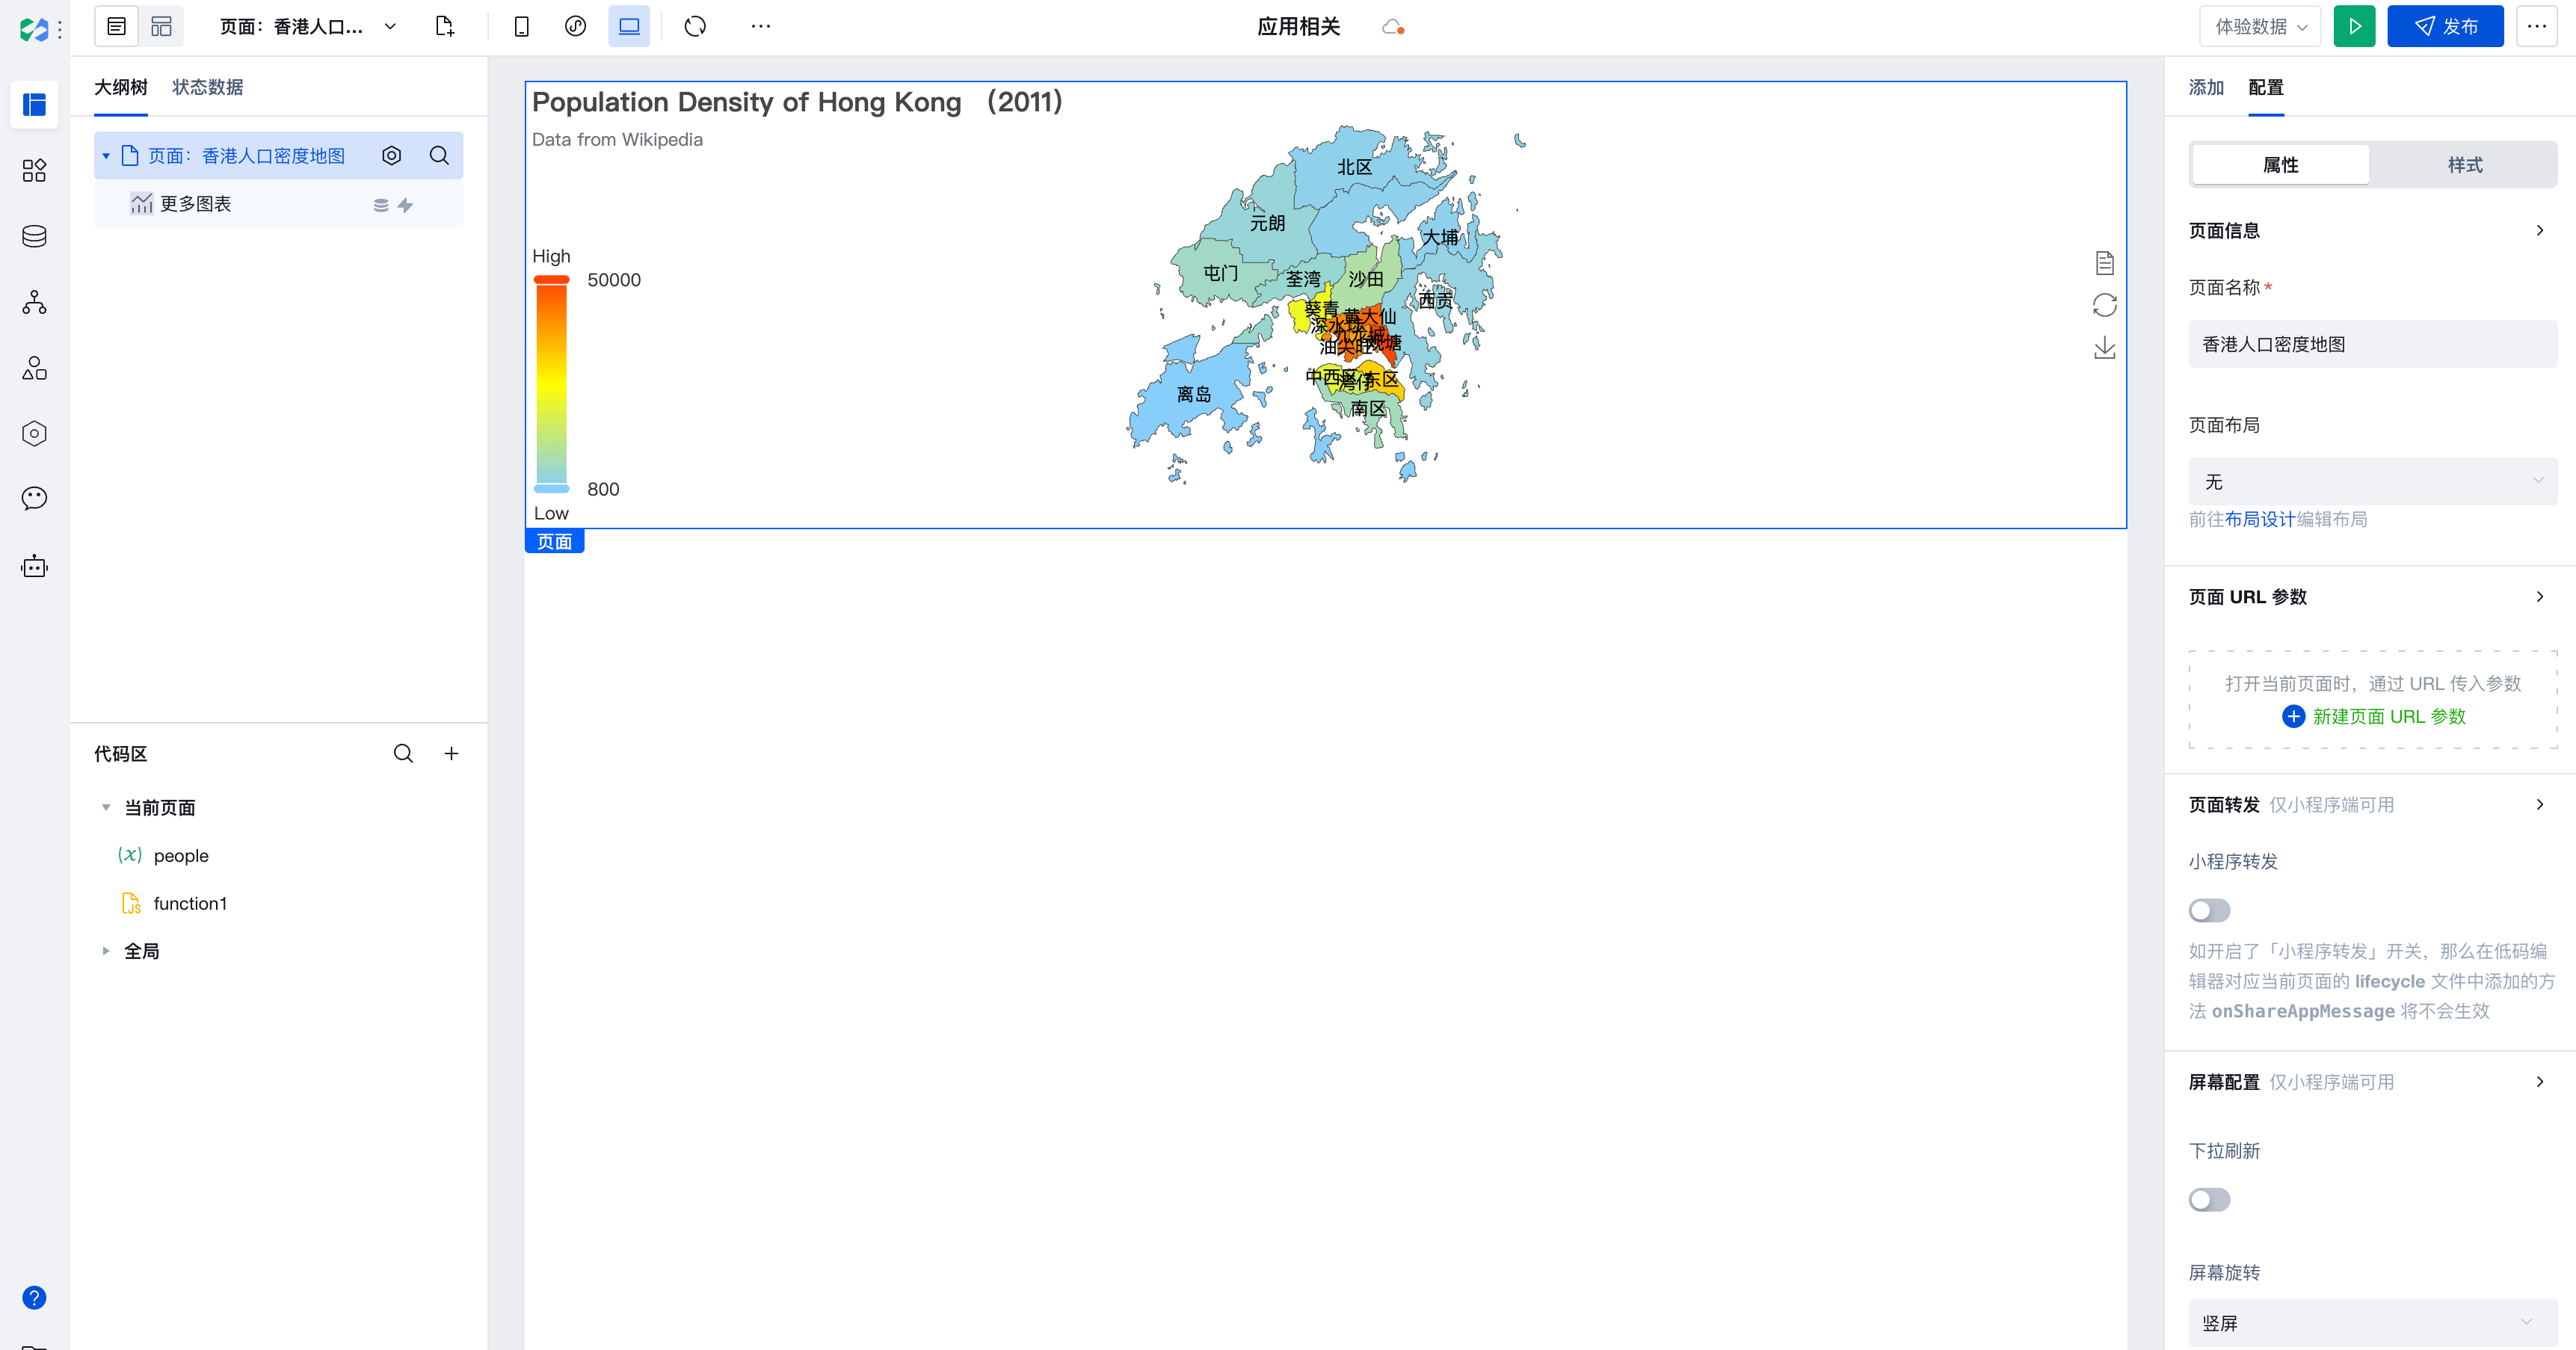
6. 图表配置完成,效果展示。
