指标方案简介
周期指标方案用于统计需求、任务、缺陷等事项状态变更所耗费的时间与完成率,是基于部分图表模板额外提供的功能。例如衡量需求从未开始到已完成所耗费的时间、缺陷从提出到已收录的处理时间,辅助团队管理者查看各个事项的处理周期。
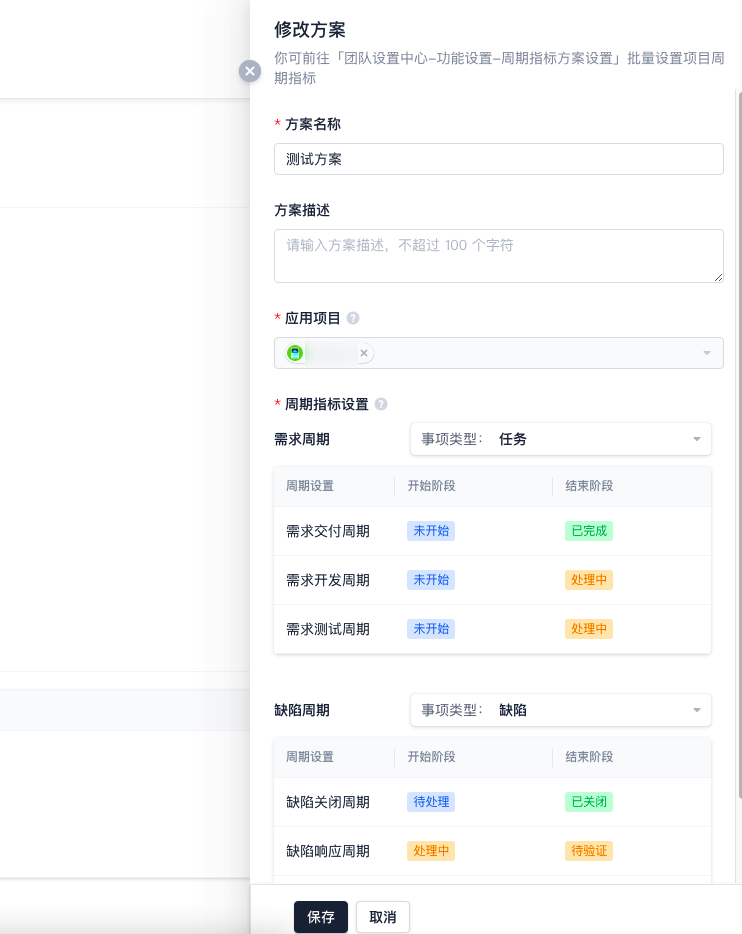
添加周期指标方案
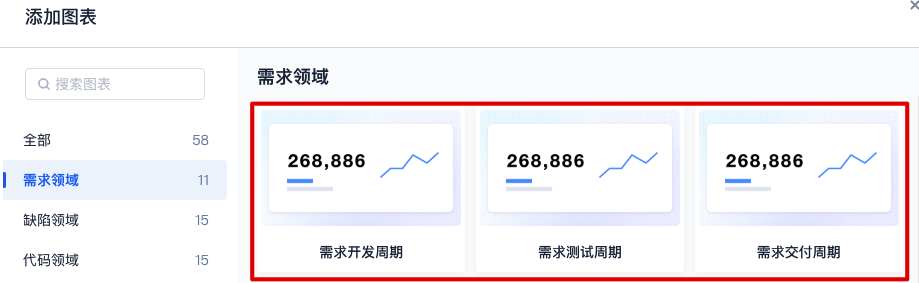
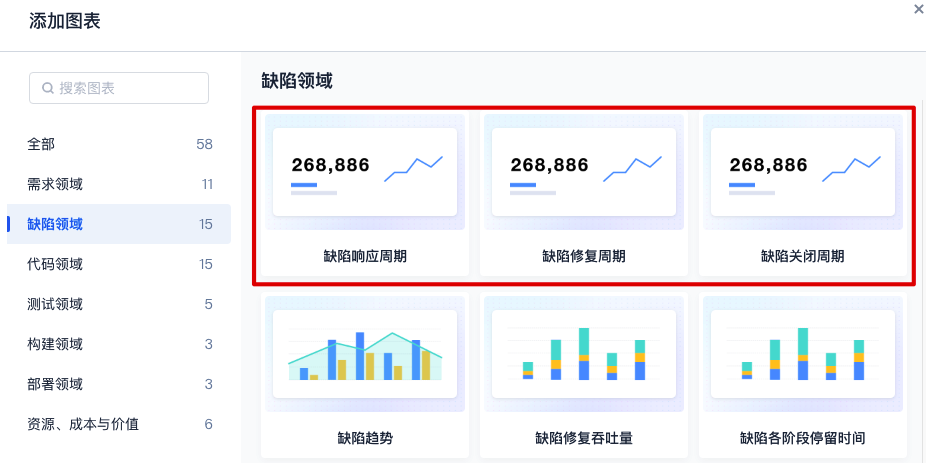
支持在以下六种图表模板中添加指标方案:
需求开发周期
需求测试周期
需求交付周期
缺陷响应周期
缺陷修复周期
缺陷关闭周期
在视图模板页右上角单击添加图表后,使用上述类型图表。
选择项目范围后单击查看方案。
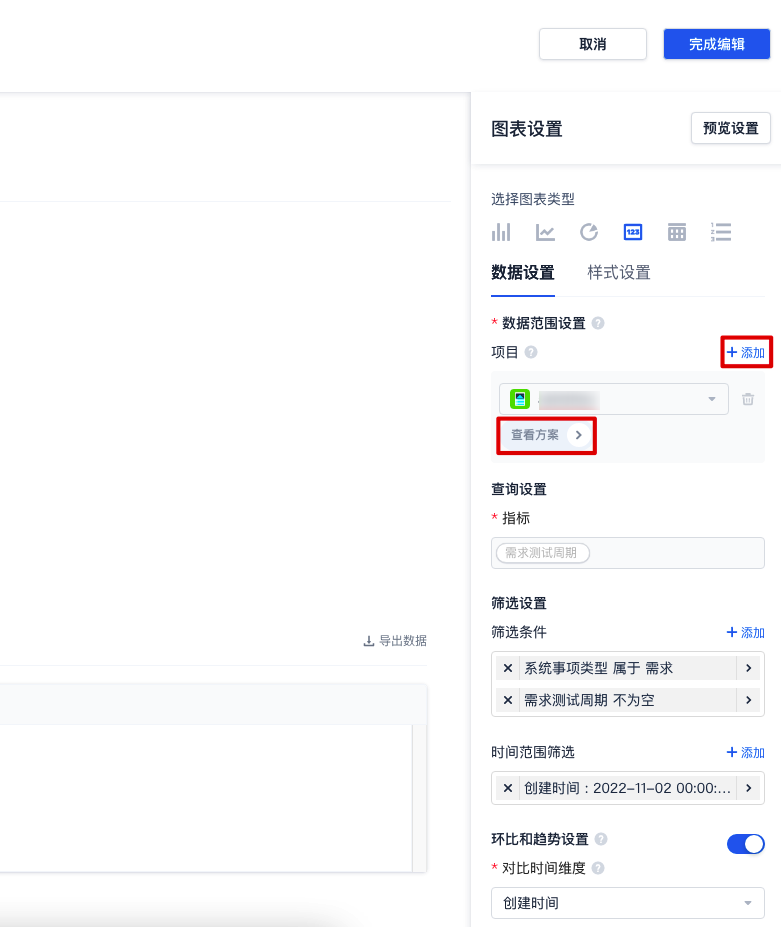
指定方案统计范围。
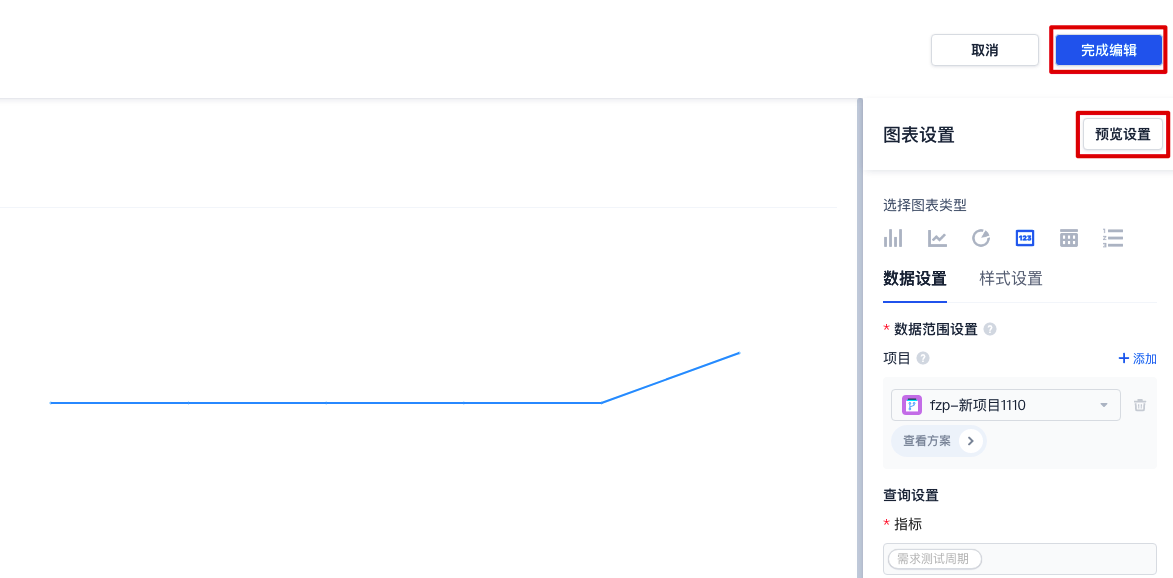
配置参数后,单击预览设置查看图表是否符合预期,无误后单击完成编辑。