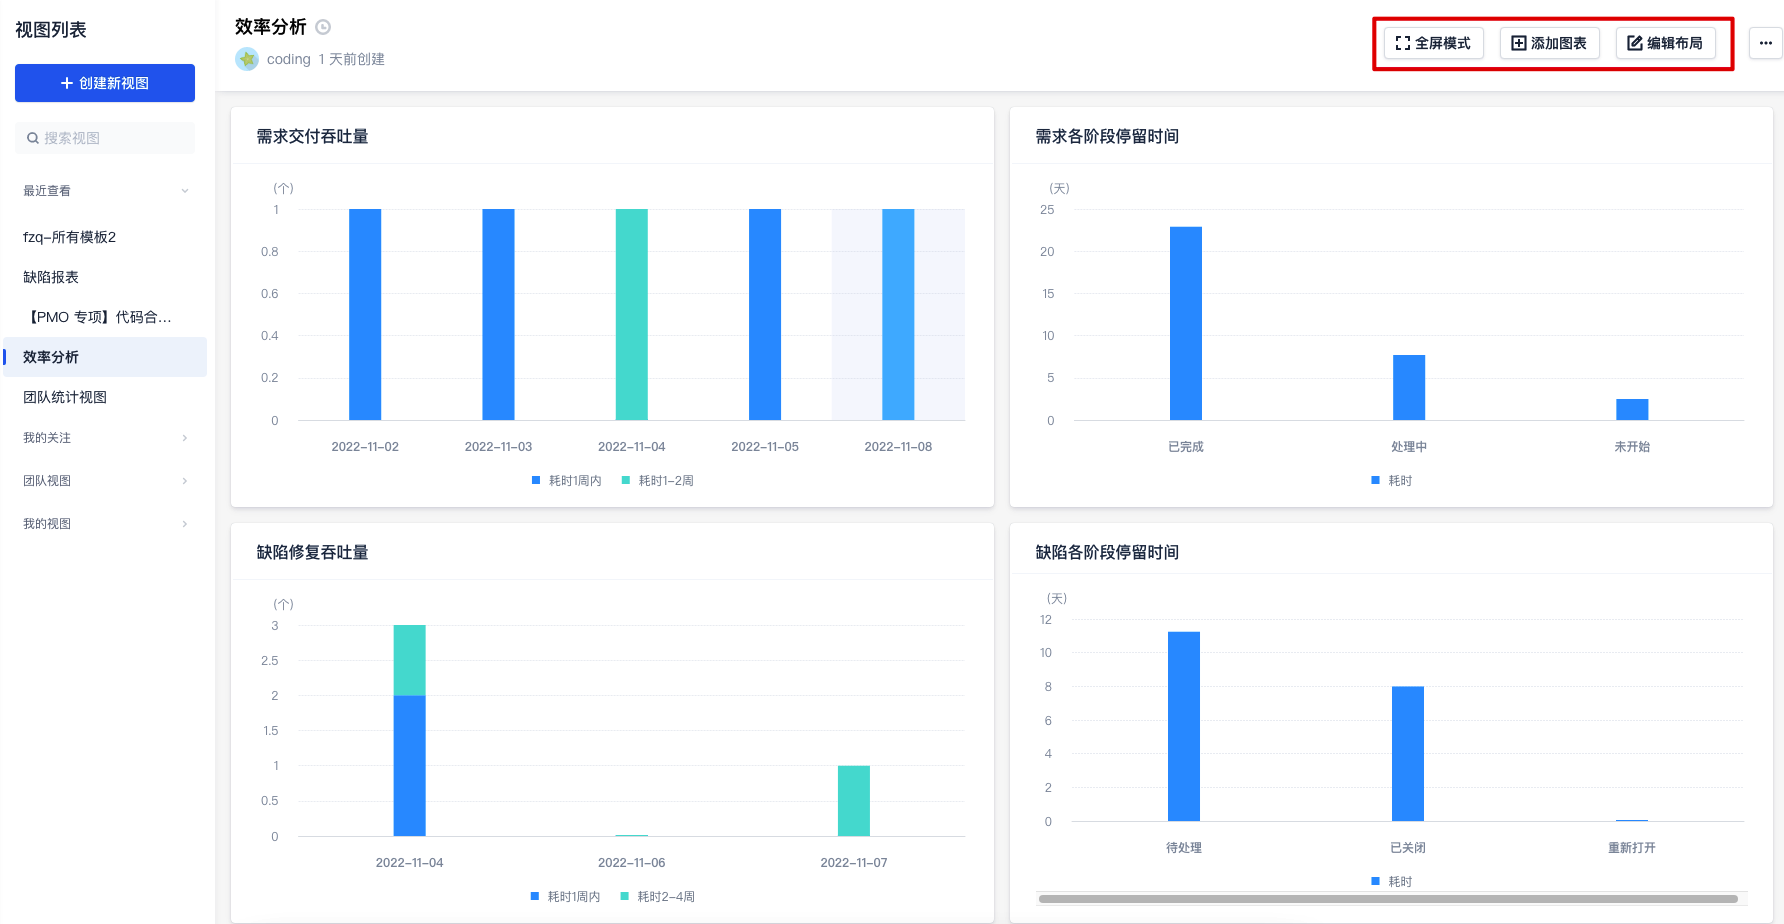
视图中包含多个统计图表,您可以自定义视图中的图表数据、调整各项图表大小、全屏查看视图等操作。
添加图表
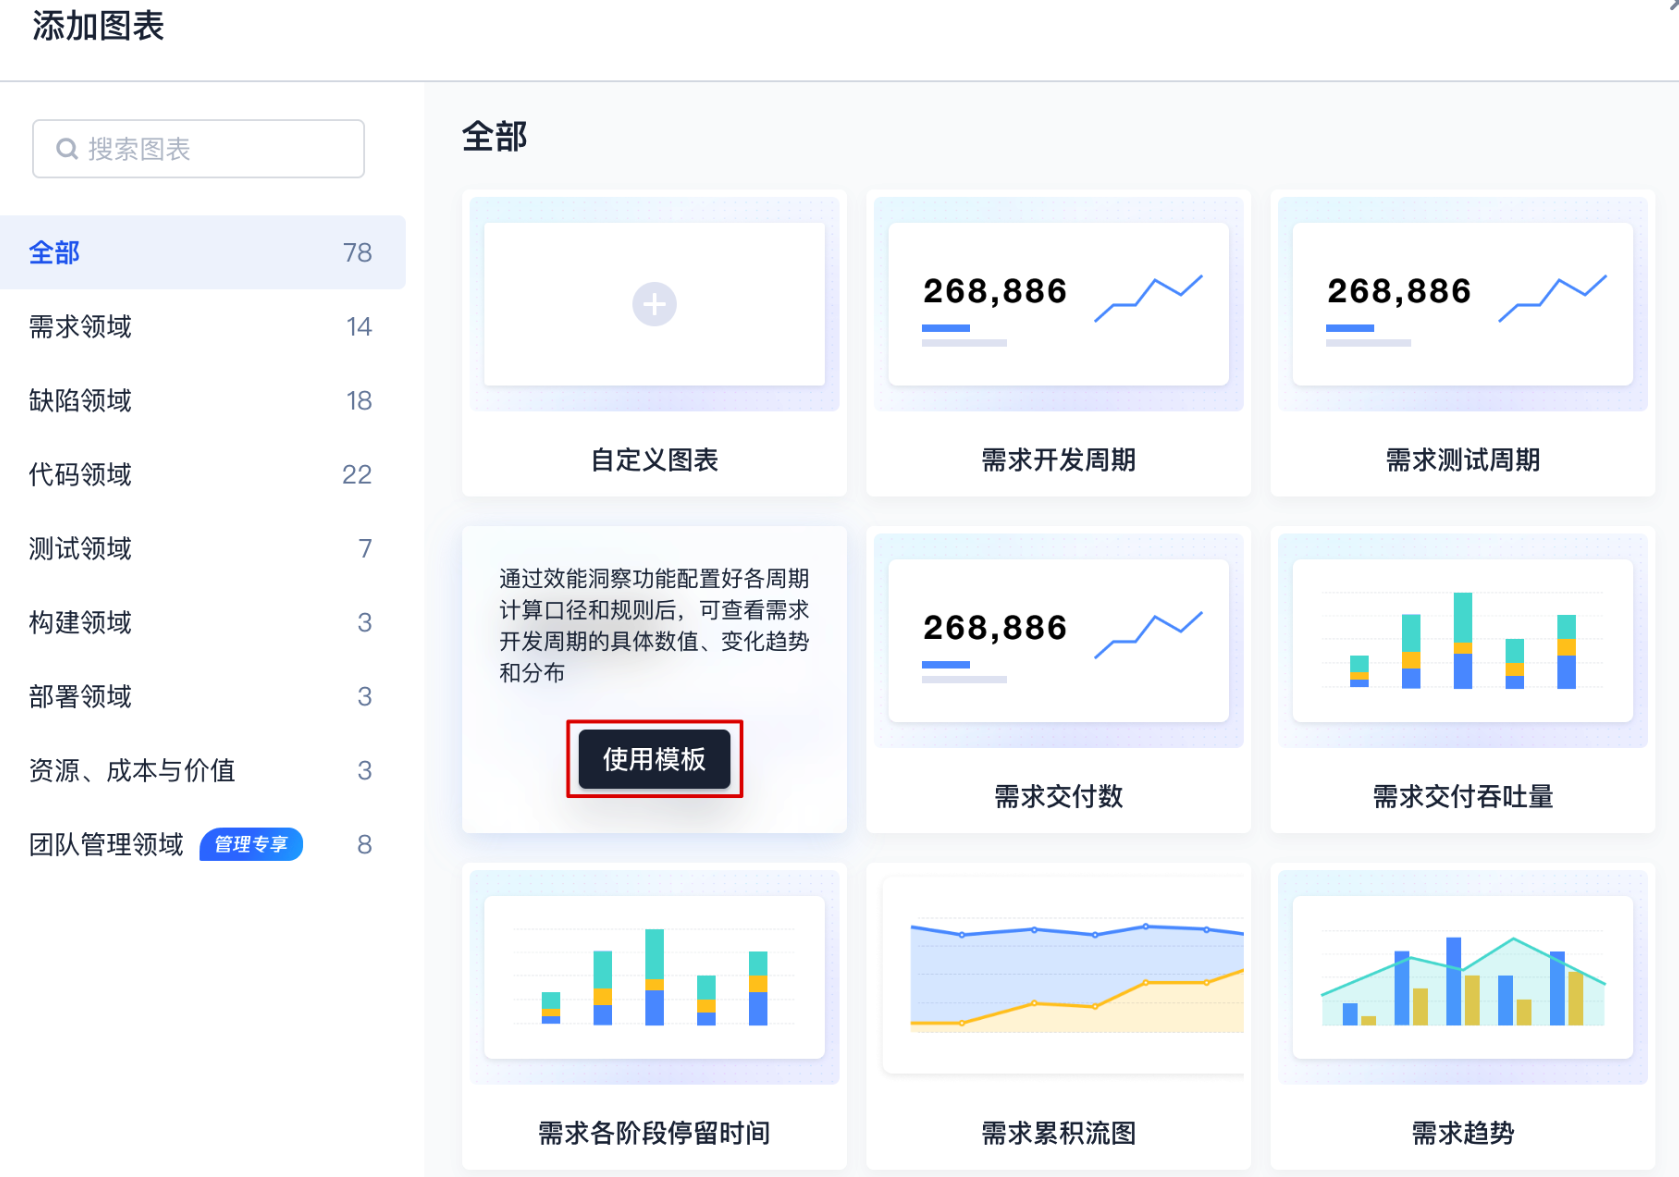
效能洞察提供 70+ 统计图表,覆盖需求创建到最终的应用部署全流程研发环节。提供丰富直观、样式统一的统计图表,帮助管理者更好地洞察团队现状。既支持使用模板添加图表,又支持自定义图表。
使用模板添加图表。
在添加图表页面,鼠标移至图表后将展示模板描述,确认模板后单击使用模板进行创建。
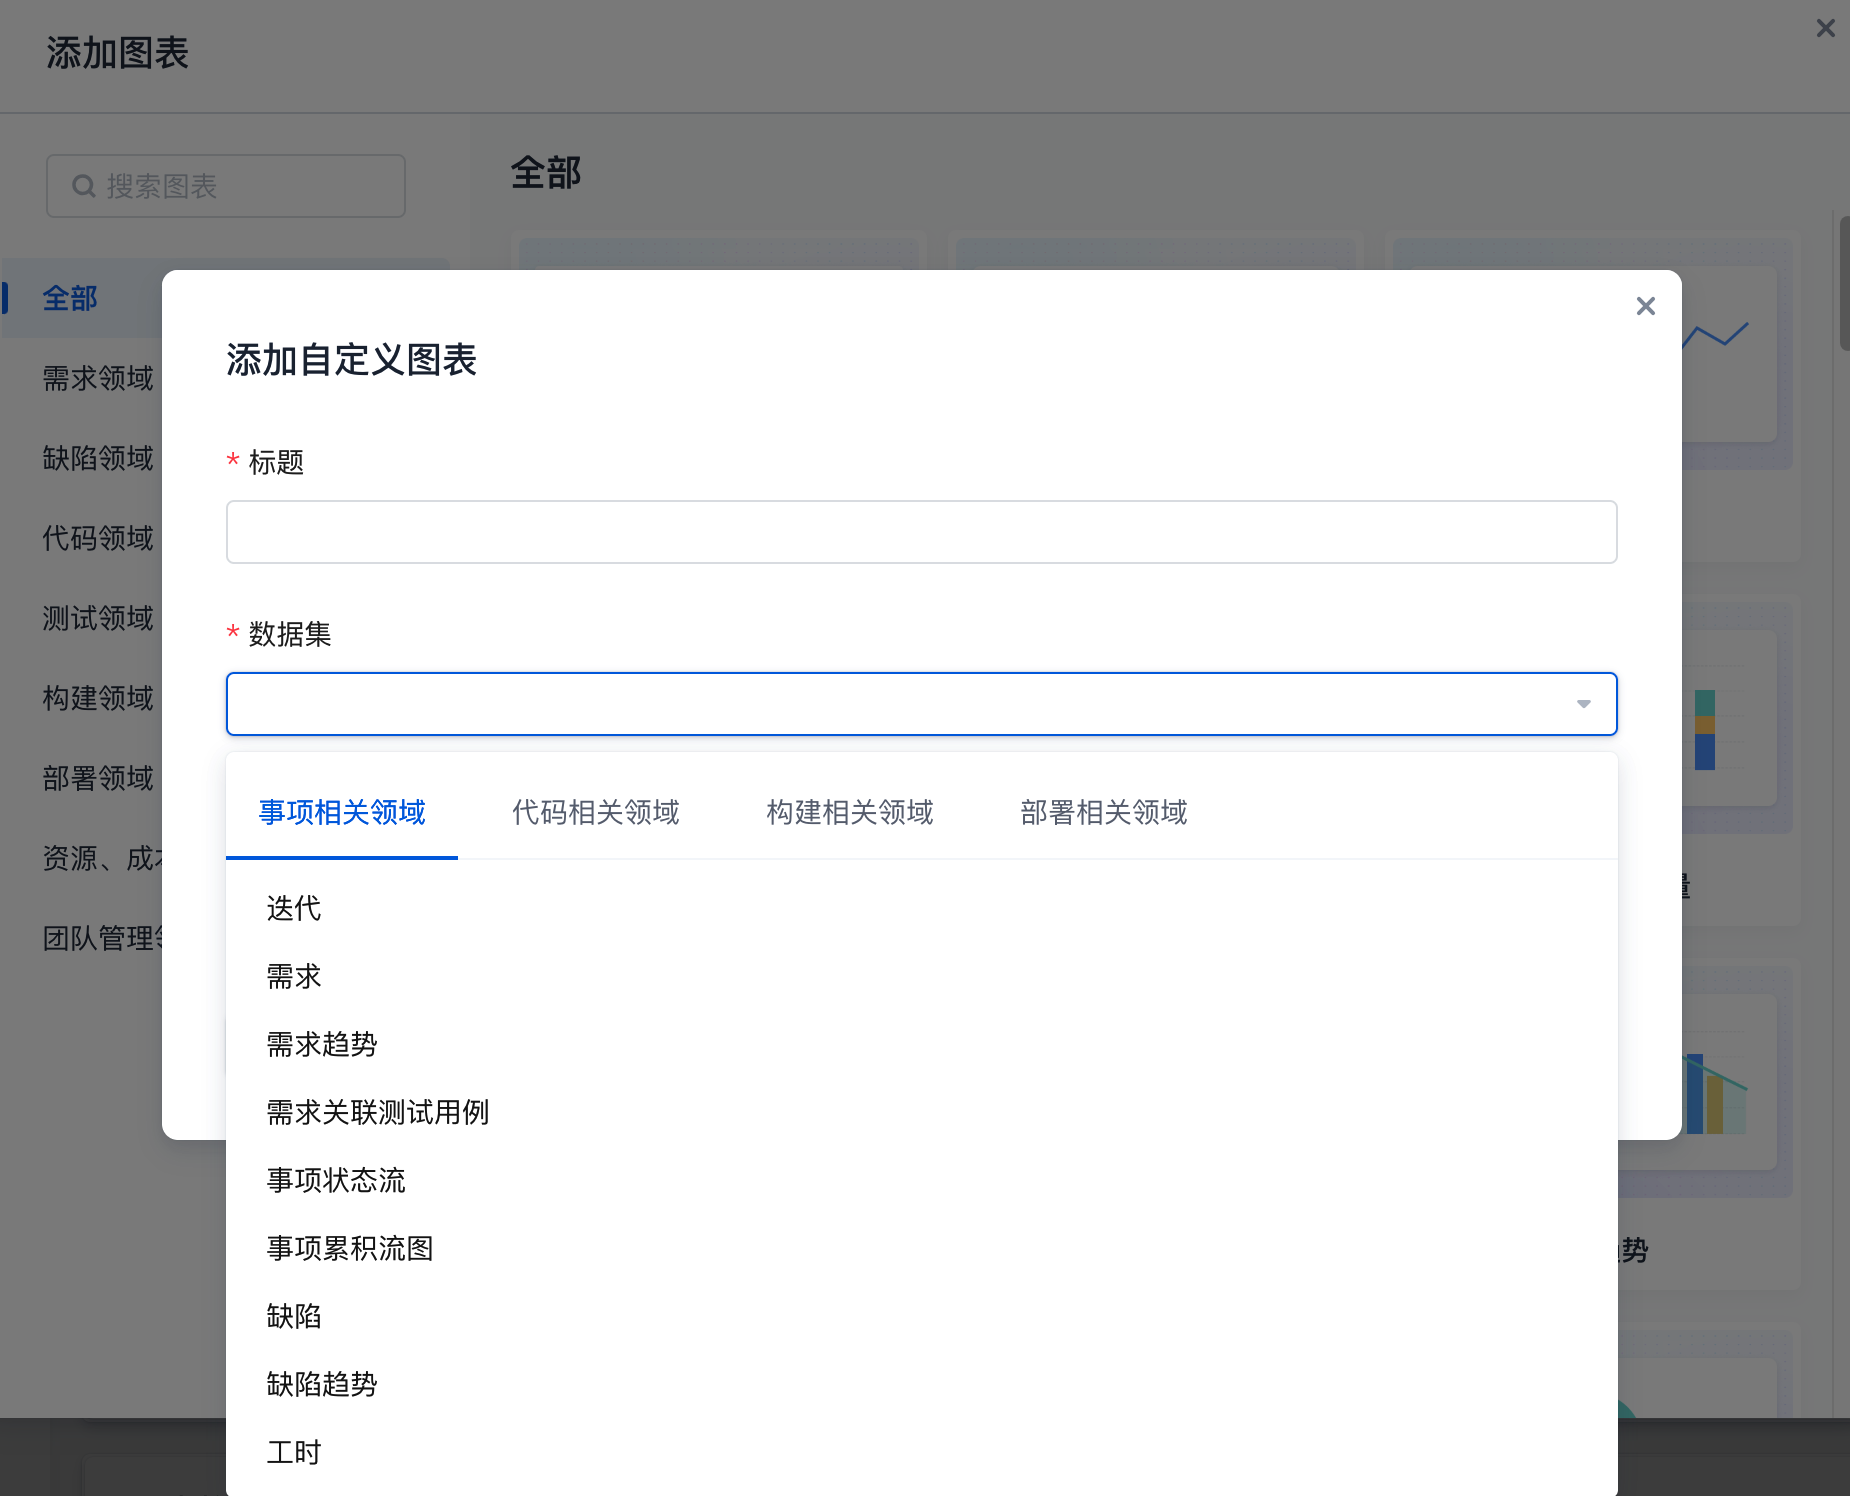
自定义图表。
当用户有个性化指标图表的需求时,可以在添加图表页面单击 + 自行选择指标、维度、筛选等,充分满足个性化需求。
调整图表基础样式
在图表右侧中可以切换图表类型、数据设置与样式设置。
切换图表类型
提供柱状图、折线图、饼状图、排序、表格、列表六种图表类型,可根据实际需要进行切换。因统计数据源存在差异,仅支持在系统自动提供的图表类型中进行切换。
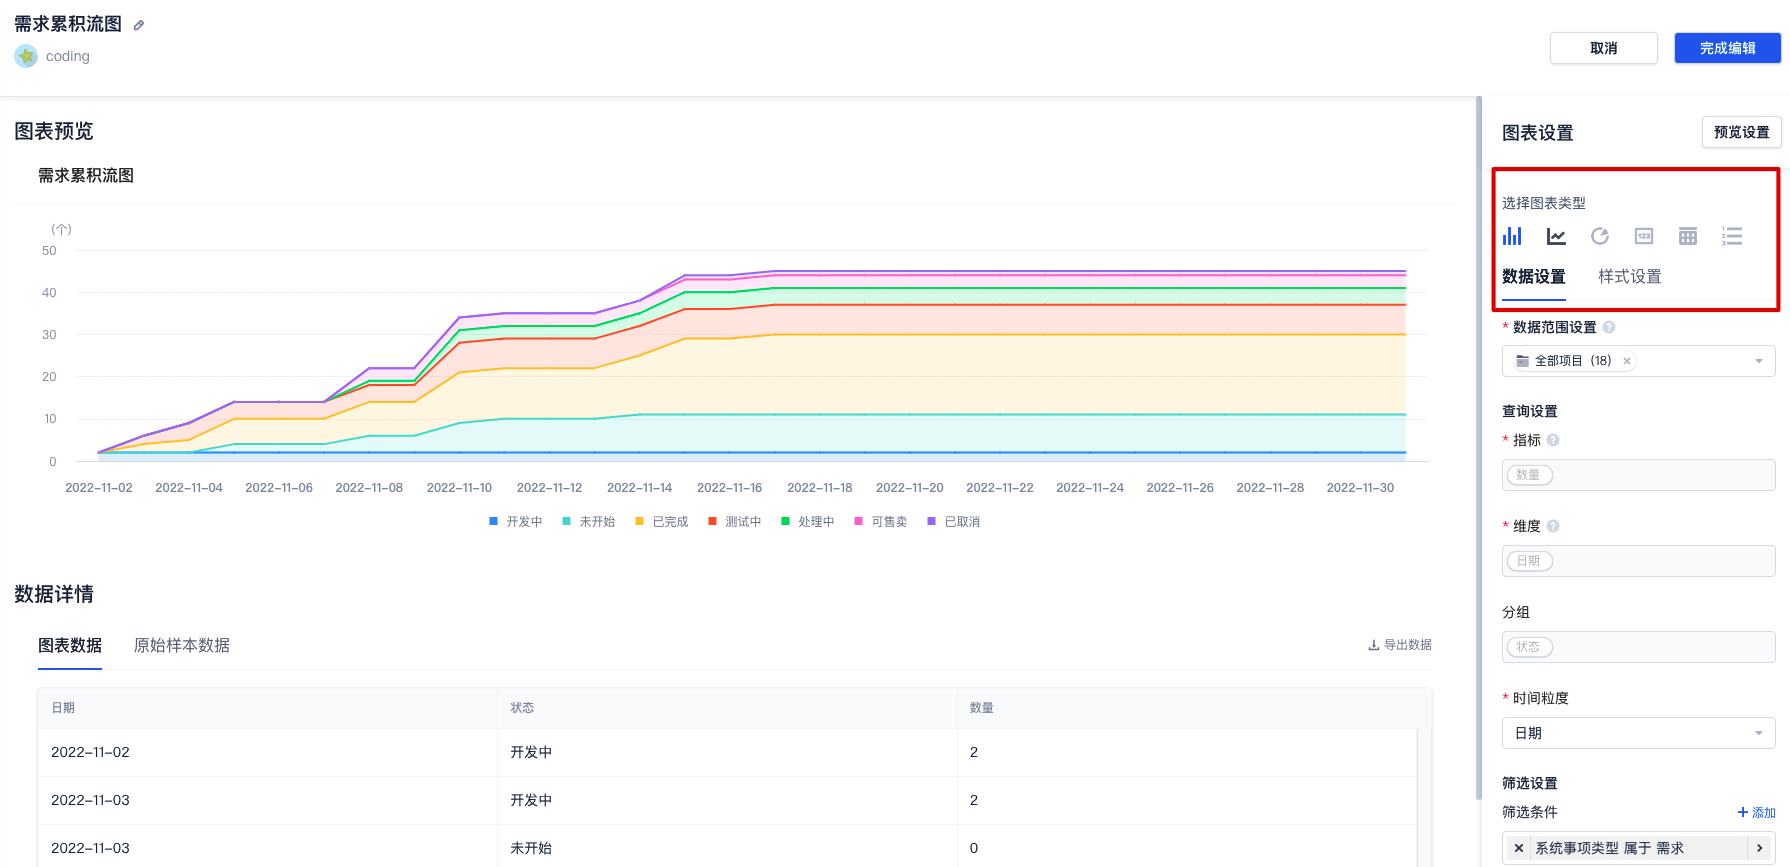
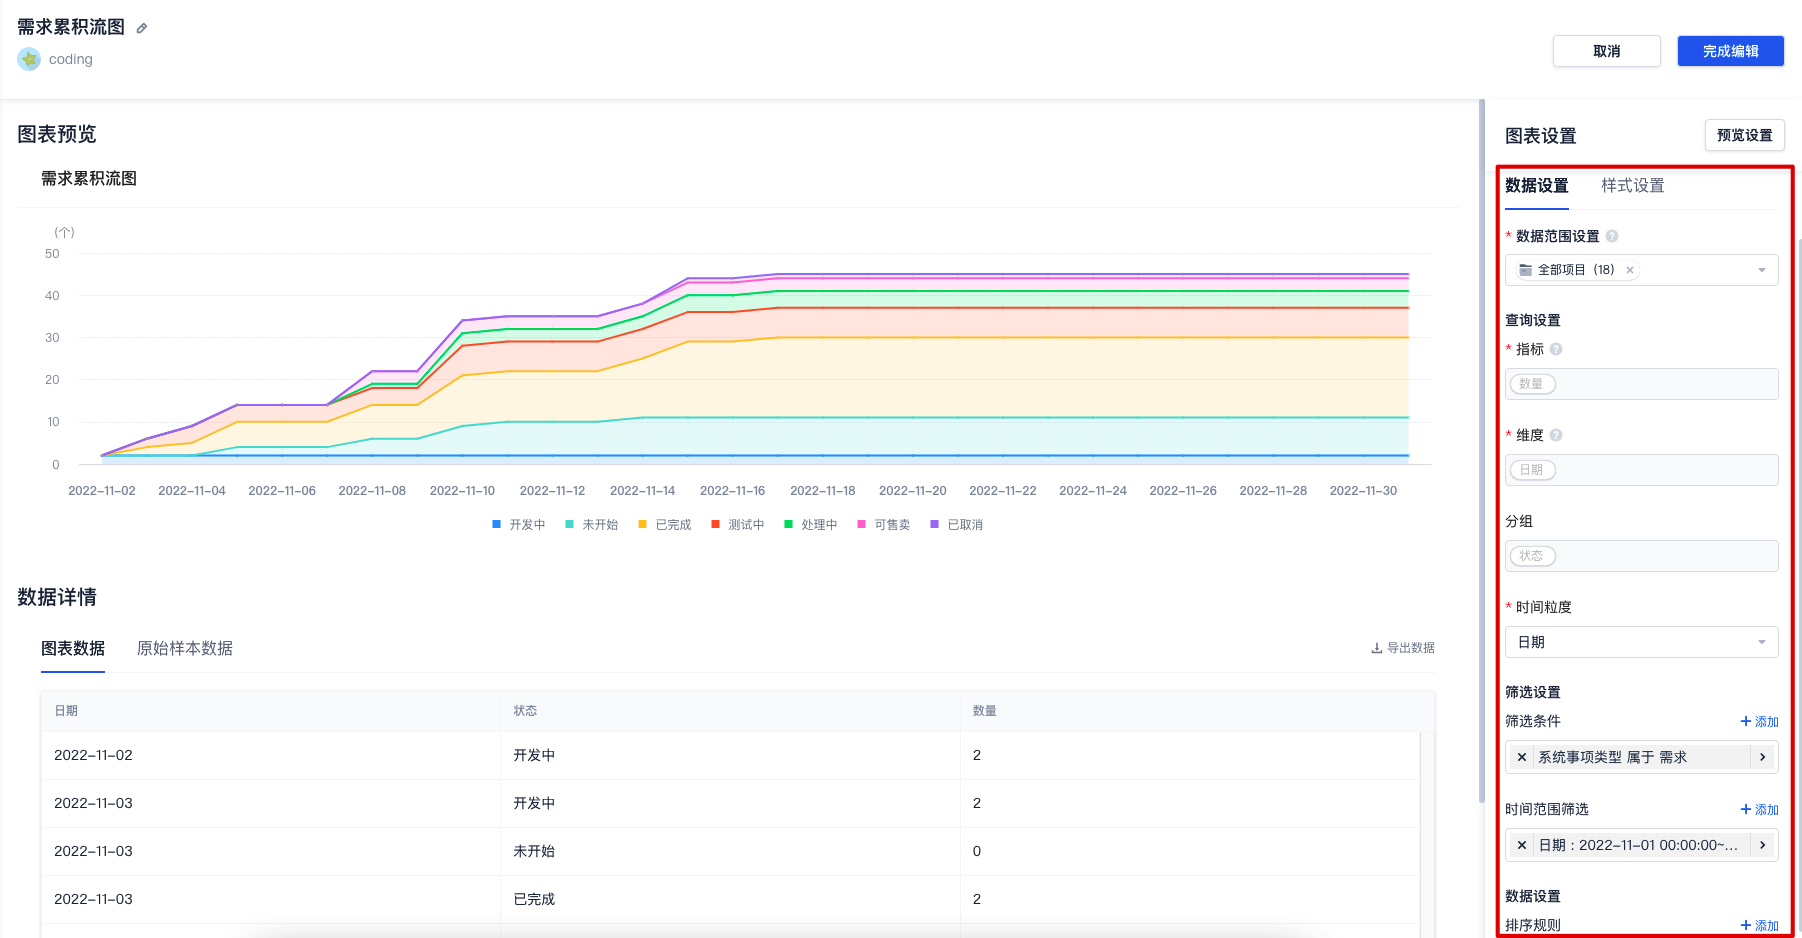
数据设置
支持调整统计项目数据范围(具备访问权限的项目范围)、设置筛选条件(事项状态与时间范围等条件)、调整数据排序以及开启参考基线设置。
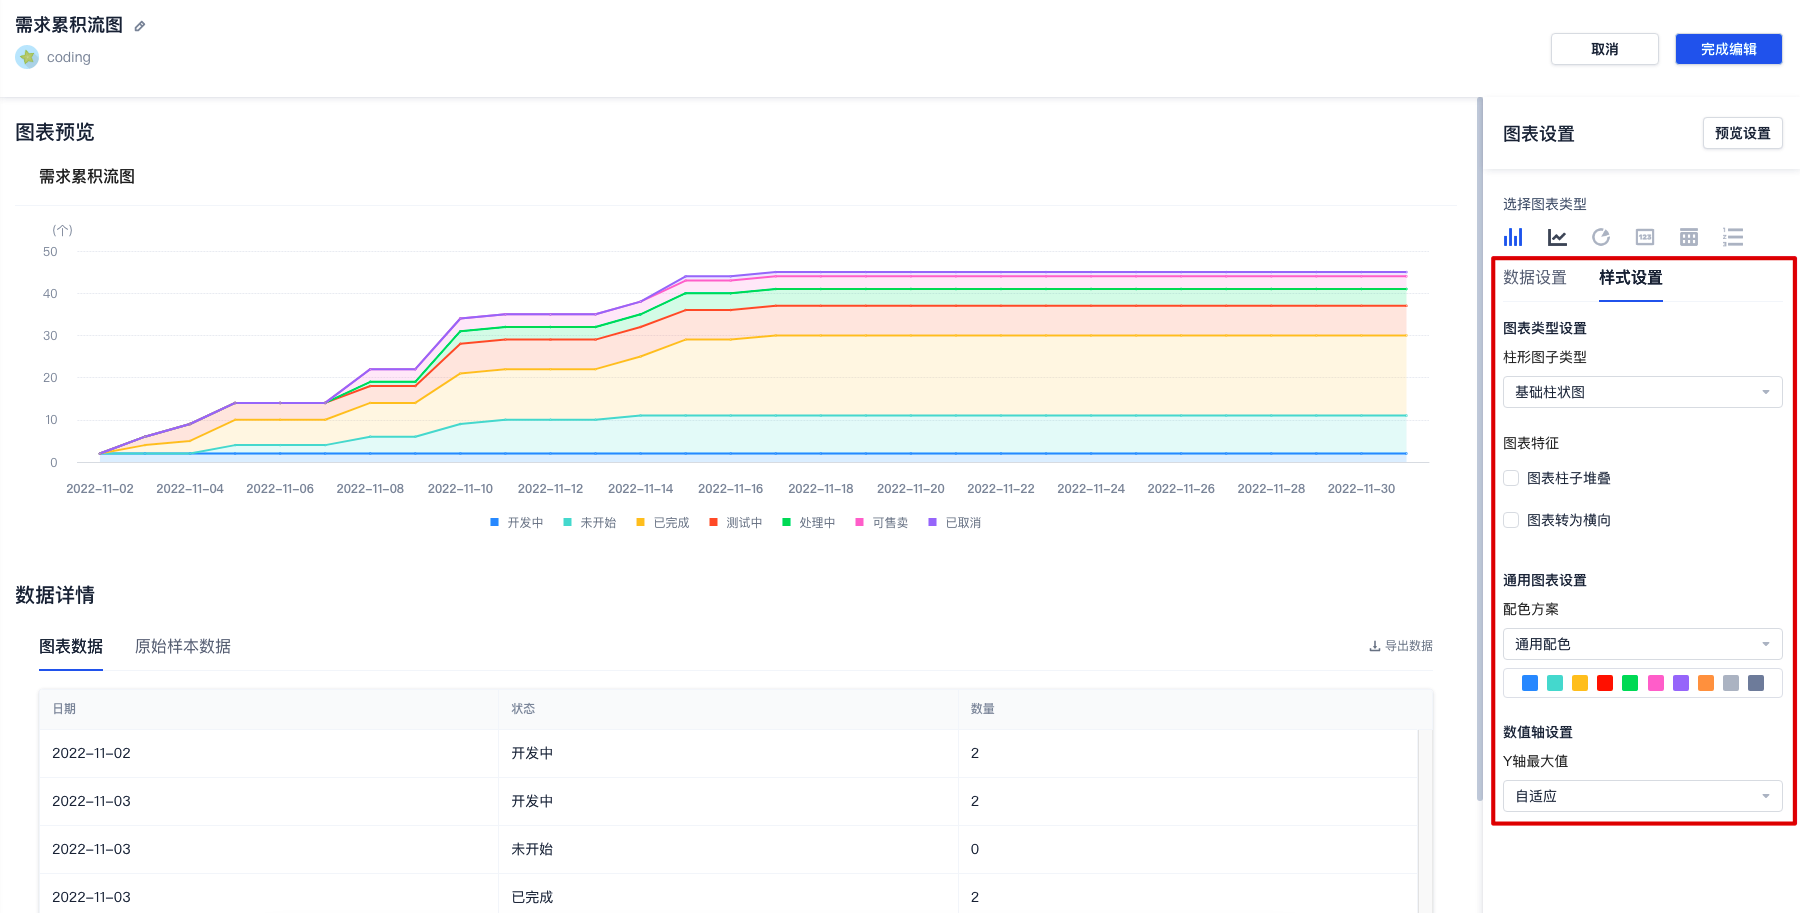
样式设置
在样式设置中可以调整配色方案以及基础外观设置。
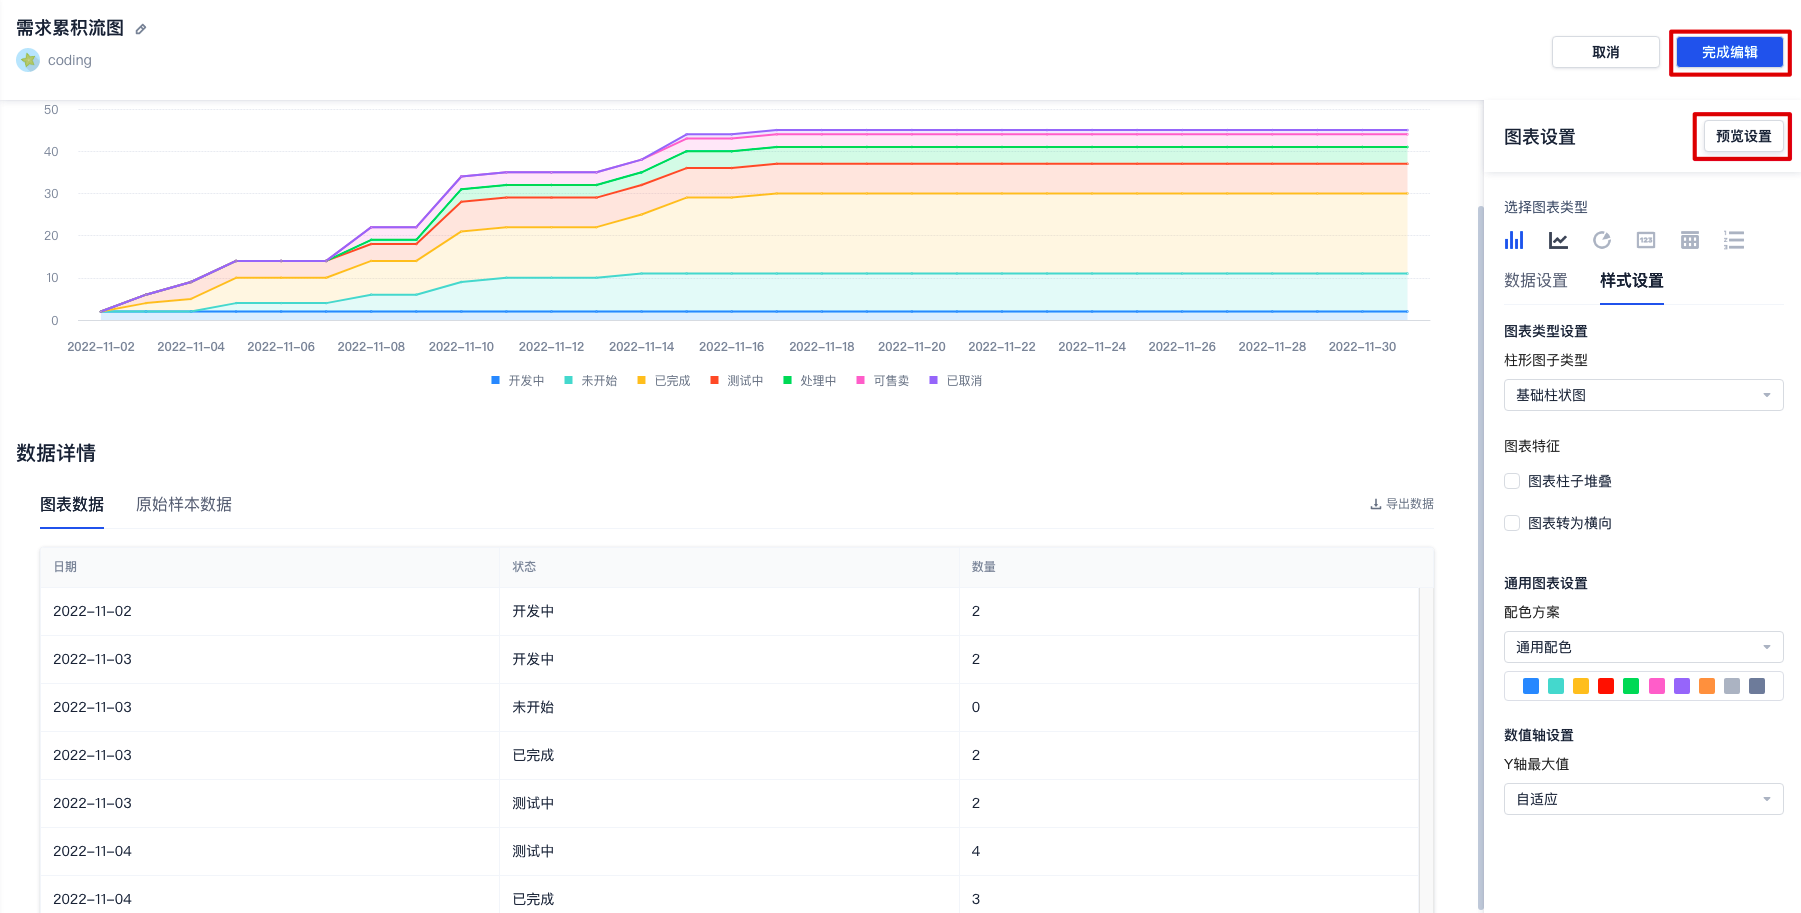
调整完成后单击右上角的预览设置可查看变更后的样式,确认无误后单击完成编辑。
编辑数据图表
视图创建完成后,支持对其中的图表全屏查看、重命名、复制、移动、导出和删除操作,单击单个图表的右上角菜单按钮进行调整。
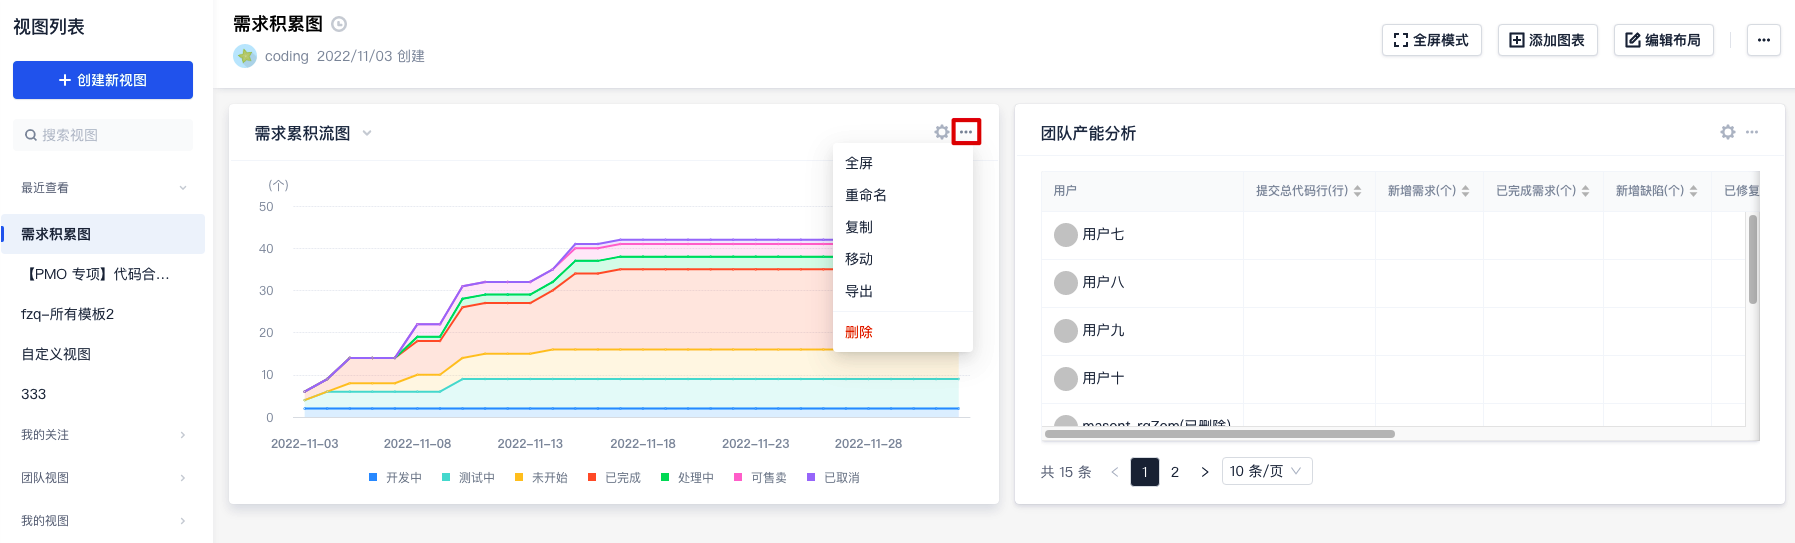
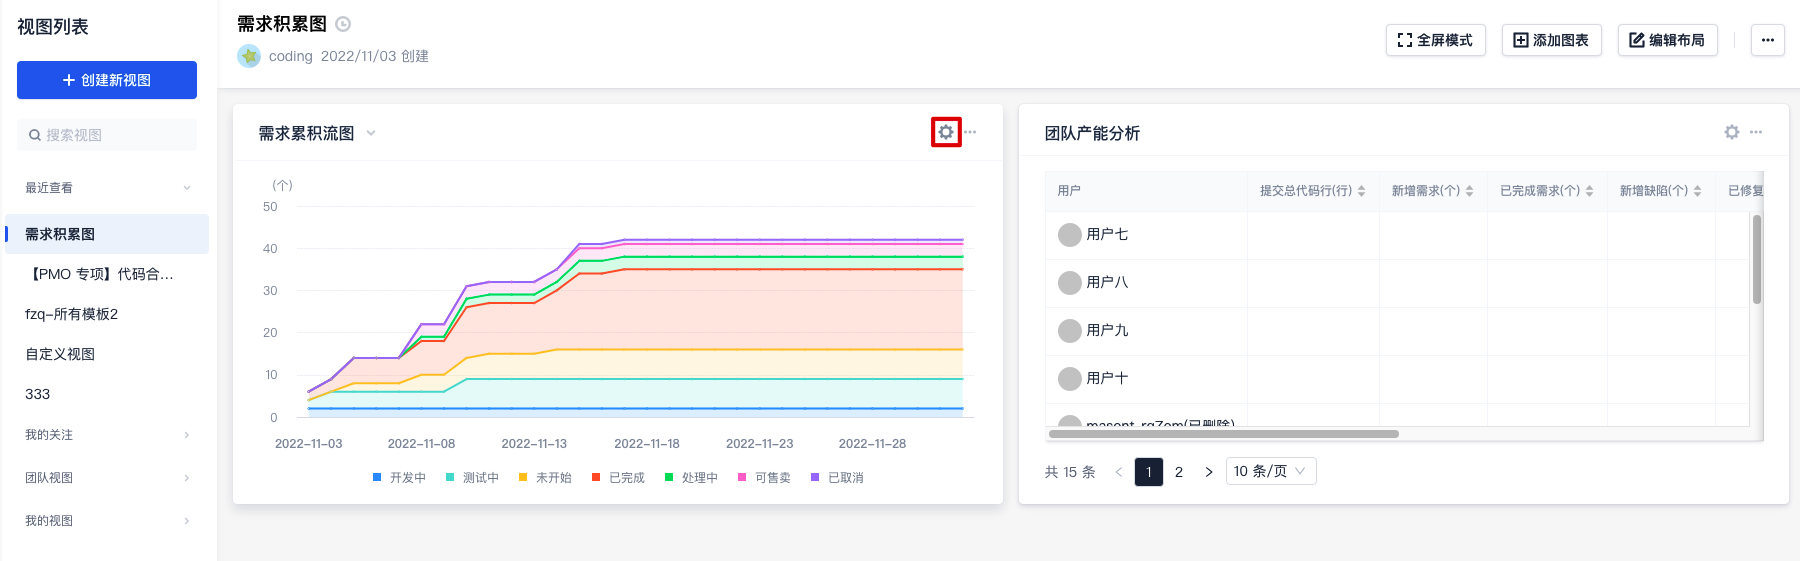
单击设置按钮可重新定义当前图表命名与统计范围。
编辑视图布局
支持调整各项图表在视图中的布局位置与范围大小,单击视图右上角的编辑布局进行调整。

在编辑页可以自由拖拽图表位置。
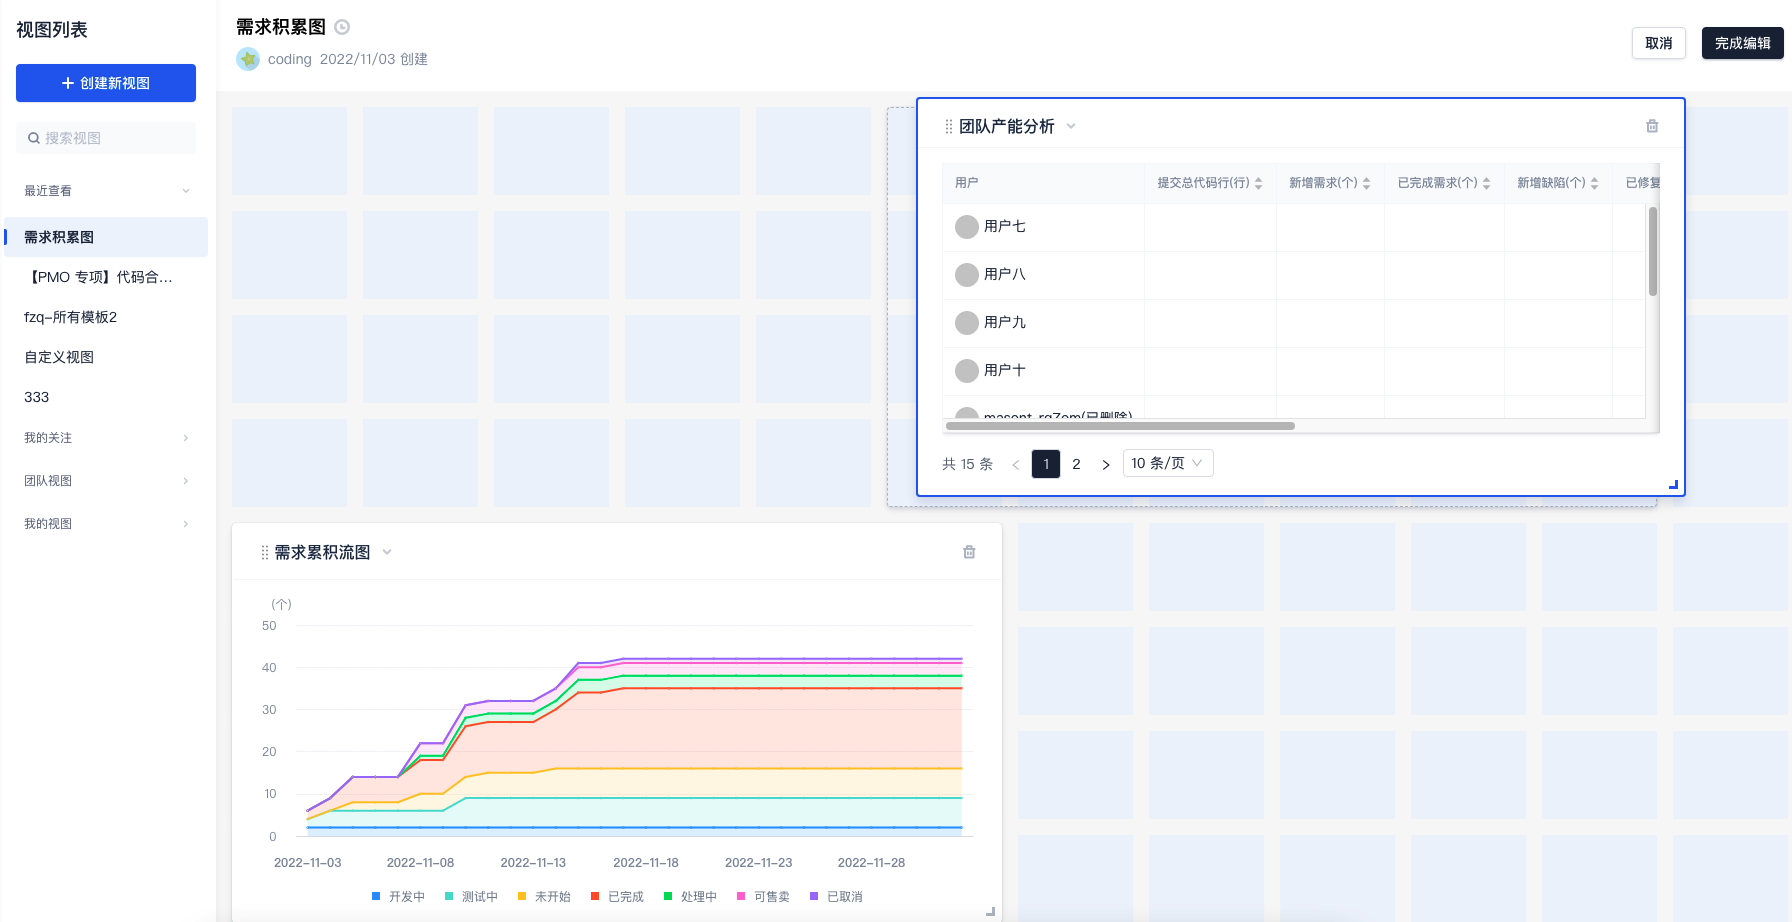
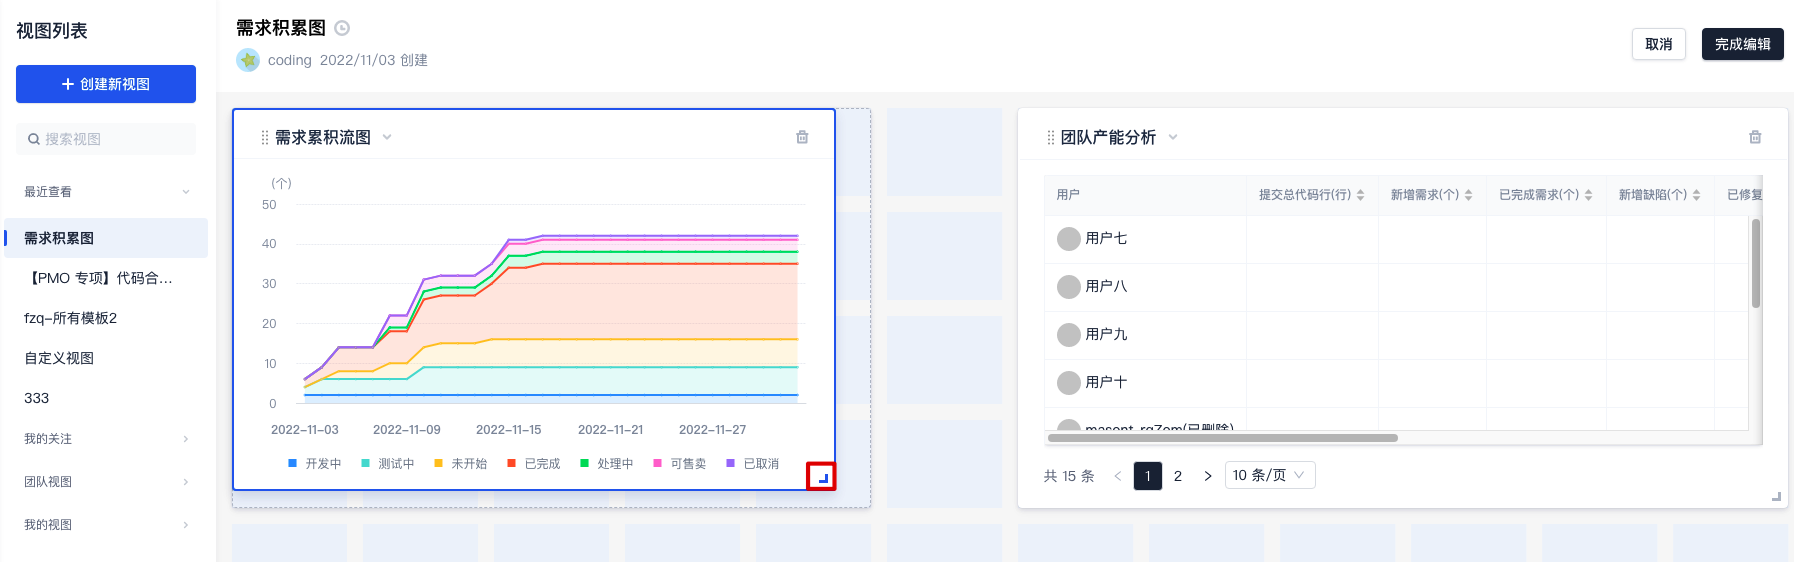
单击视图右下角边框调整按钮改变当前尺寸大小。