操作场景
会话管理是指查看和控制当前与数据库实例建立的连接及正在执行的操作。其核心应用场景围绕实时运维、性能保障与安全管控展开。
性能监控:当数据库出现响应变慢、CPU 或内存使用率异常升高时。数据库管理员(DBA)会立即进入会话管理页面。
查看活跃会话:检查当前是否存在大量并发连接。
识别慢操作:通过查看会话的执行时间,快速定位正在执行的慢查询或长时间运行的操作。
定位资源消耗源:找出哪些会话占用了最多的数据库资源(如 CPU 时间、锁等待),从而确定性能瓶颈的直接原因。
故障定位:应用程序出现连接超时、事务提交失败或疑似死锁时。
查看操作语句:获取会话正在执行的具体命令或事务,分析语句间的资源竞争关系。
终止阻塞会话:当确认某个会话是导致死锁或严重阻塞的源头时,DBA 可以强制终止(Kill)该会话,以立即恢复数据库的正常服务。
安全管控:怀疑数据库存在异常访问、恶意攻击时。
审计连接来源:检查所有会话的客户端 IP 和端口,识别是否存在未知或非法的来源地址。
监控用户行为:查看各个数据库账号正在执行的操作,监控是否有超出其权限范围的危险操作(如全表扫描、大规模删除)。
即时中断威胁:一旦发现来自未知源 IP 的恶意操作(如密码爆破、数据拖库),可立即终止其会话,并采取进一步的封禁措施。
前提条件
云数据库 MongoDB 副本集实例或分片实例的状态为运行中。
管理会话请求
1. 登录 MongoDB 控制台。
2. 在左侧导航栏 MongoDB 的下拉列表中,选择副本集实例或者分片实例。副本集实例与分片实例操作类似。
3. 在右侧实例列表页面上方,选择地域。
4. 在实例列表中,找到目标实例。
5. 单击目标实例 ID,进入实例详情页面。
6. 选择数据库管理页签,进入会话管理页面。系统会记录连接当前实例正在执行的会话请求。如下图所示。
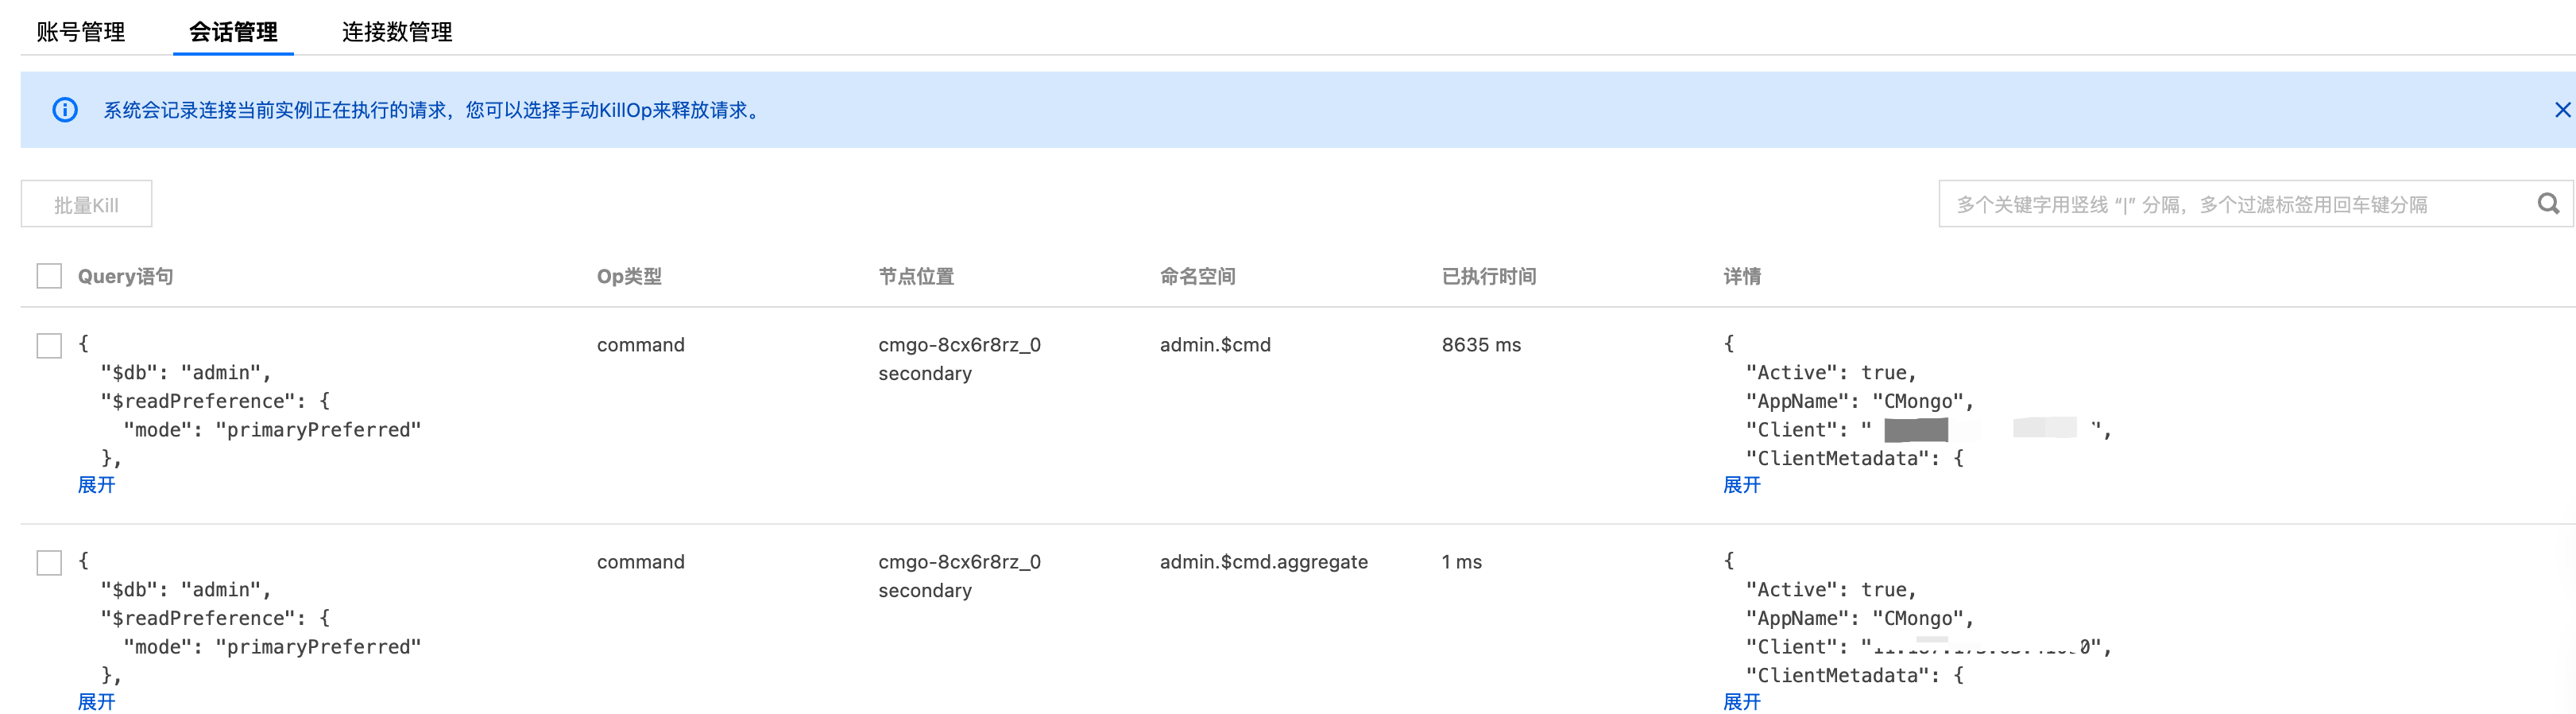
参数名称 | 参数含义 |
Query 语句 | 查询语句 |
Op 类型 | 操作类型 |
节点位置 | 执行操作所在的节点 |
命令空间 | 数据库表的命名空间 |
已执行时间 | 耗时时间 |
详情 | 执行语句详情信息 |
7. (可选)选中所需清理的会话记录,单击列表上方的批量 Kill,可手动执行 killOp 命令会话请求并释放资源。
注意:
手动执行 killOp 可能中断关键操作,仅建议在确认安全后执行。
8. 在提示对话框中,阅读提示信息,确认终止请求,单击确定,完成操作。
相关 API
接口名称 | 功能描述 |
终止 MongoDB 云数据库实例上执行的特定操作。 |


