Slow query analysis

Last updated: 2025-08-21 15:51:11

Note

By default, a SQL query that takes more than one second is a slow query, and the corresponding statement is a slow query statement. The process where a database administrator (DBA) analyzes slow query statements and finds out the reasons why slow queries occur is known as slow query analysis.
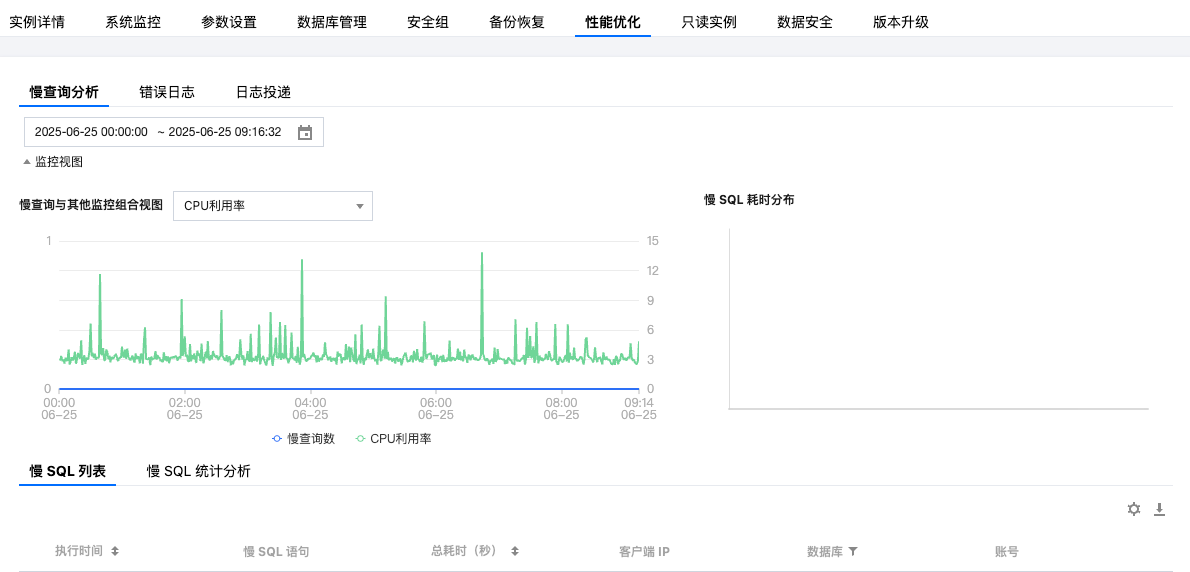
The TencentDB for PostgreSQL console provides slow query analysis capabilities under the Performance Optimization module on the instance management page, as shown below:


Monitoring View

The console features two charts as monitoring views, allowing you to intuitively and conveniently view the slow SQL-related information of the database. Slow Query and Other Monitoring Combined View: This view supports visualizing slow query metrics and comparing them with other metrics. Other supported metrics include: CPU utilization, QPS, request count, read request count, write request count, other request count, buffer cache hit rate, and average execution latency. Slow SQL Duration Distribution: This view enables you to examine the primary distribution of slow queries within different time intervals by analyzing slow SQL statements across various time periods.

Slow SQL List

The slow SQL list shows slow query statements of the database in real time. The list is arranged in descending order by time, that is, the latest slow query statement is automatically displayed in the first row. The slow SQL list has the following fields: the execution time, the slow SQL statement, the total time, the client IP, the database name, and the account executing the statement.
Note
By default, the slow SQL list displays slow SQL data over the past seven days. The slow SQL data is stored in a log, and the oldest data is automatically deleted from the log to ensure that the log only stores data within the past seven days and the log size does not exceed 50 GiB.
If a single slow SQL statement exceeds 20KB, it cannot be viewed from the console. Please submit a ticket and contact Tencent Cloud for assistance.

Slow SQL Statistics and Analysis

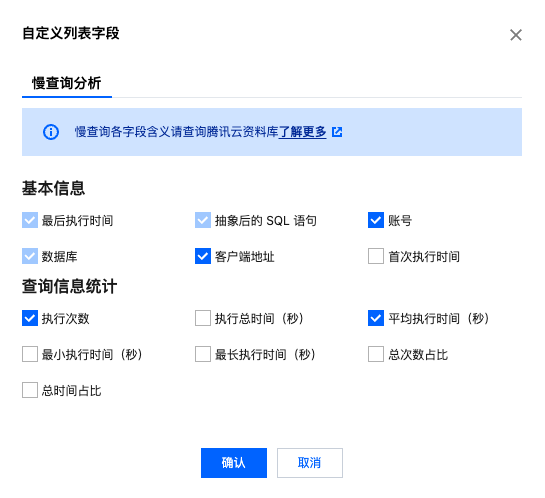
Slow SQL statistical analysis is based on the aggregation of similar SQL statements after abstracting system parameters from all slow SQL statements within a specified time range. This analysis provides slow SQL information, which includes various field information.
Last Execution Time: Within the statistical scope, this is the time when the abstract statement last appeared. Since some statements are expected to have a longer execution time, we uniformly record the begin_time of the statement execution.
Abstracted SQL Statement: This refers to the statement after removing constants from the slow SQL. Abstracted statements allow for the aggregation and summary of similar statements, making it easier for you to analyze them effectively.
Database: The database that the statement has accessed.
Account: This indicates which account was used to execute the statement.
Client IP Address: The client locations where the statement has been executed.
First Execution Time: The time when the slow SQL statement first appeared within the statistical range (after abstraction and aggregation, there may be multiple records).
Total Execution Time: The total duration of slow query statements within the statistical scope.
Average Execution Time: The average time is calculated by dividing the total time consumed by the slow query statement by the total number of executions of the slow query statement.
Minimum Execution Time: The minimum execution time among all instances of this abstract statement as a slow query statement; used to help determine whether the statement is an occasional event.
Maximum Execution Time: The maximum execution time among all instances of this abstract statement as a slow query statement; used to help determine whether the statement is an occasional event.
Total Time Ratio: Within the statistical scope, the proportion of time taken by a slow query statement compared to the total time taken by all slow query statements.