功能介绍
节点状态页面展示了当前集群所有节点监控概览和所有节点列表,并支持查看所有节点热点图。用户可以在日常使用中,通过弹性 MapReduce 控制台,管理节点的状态及指标信息。
操作步骤
1. 登录 弹性 MapReduce 控制台,在集群列表中单击对应的集群 ID/名称进入集群详情页。
2. 选择集群资源 > 节点状态可查看集群中所有节点监控信息。
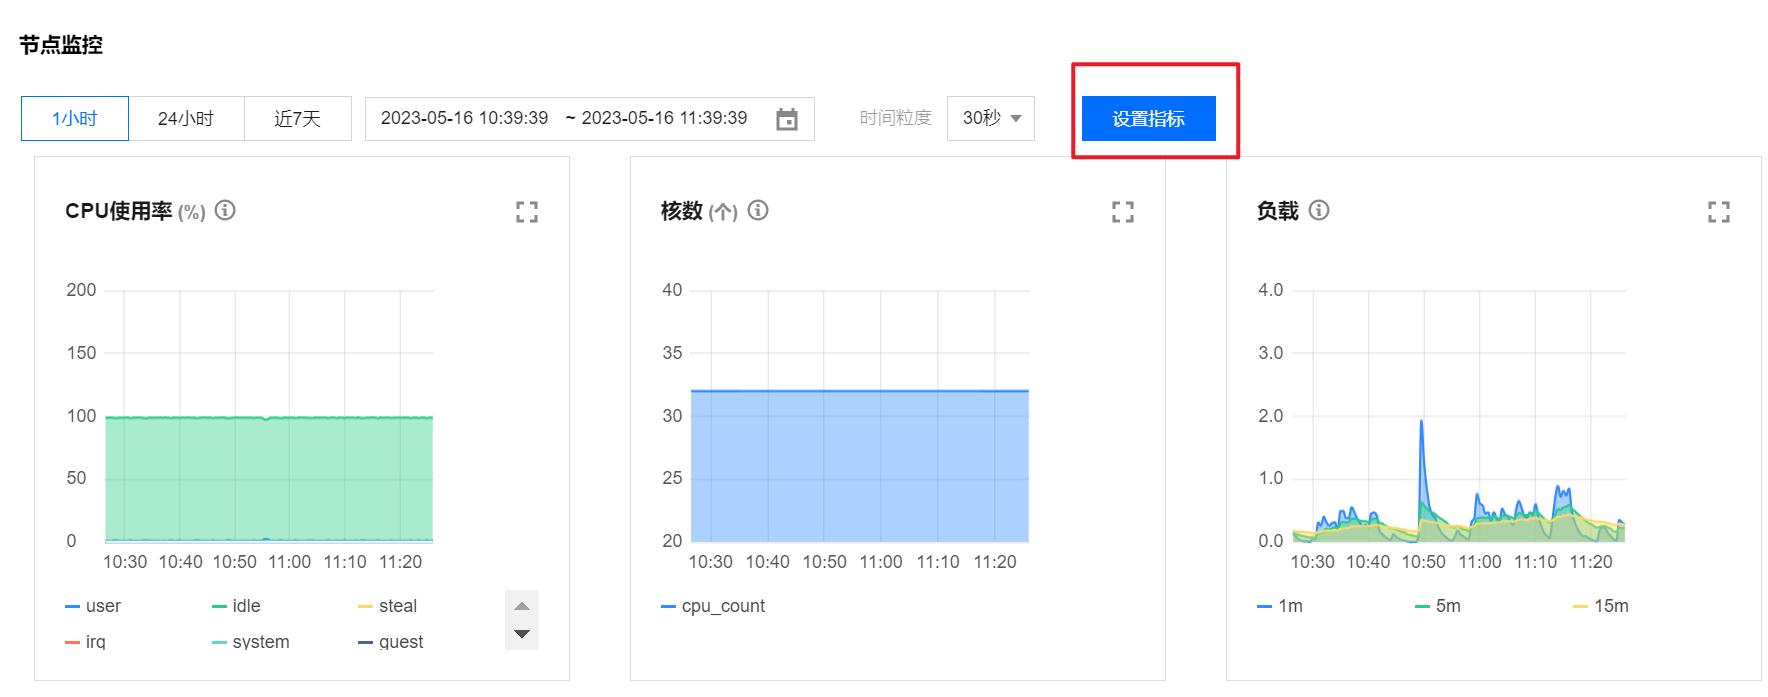
3. 在节点监控中,可查当前集群所有节点聚合监控指标概览和所有节点列表。
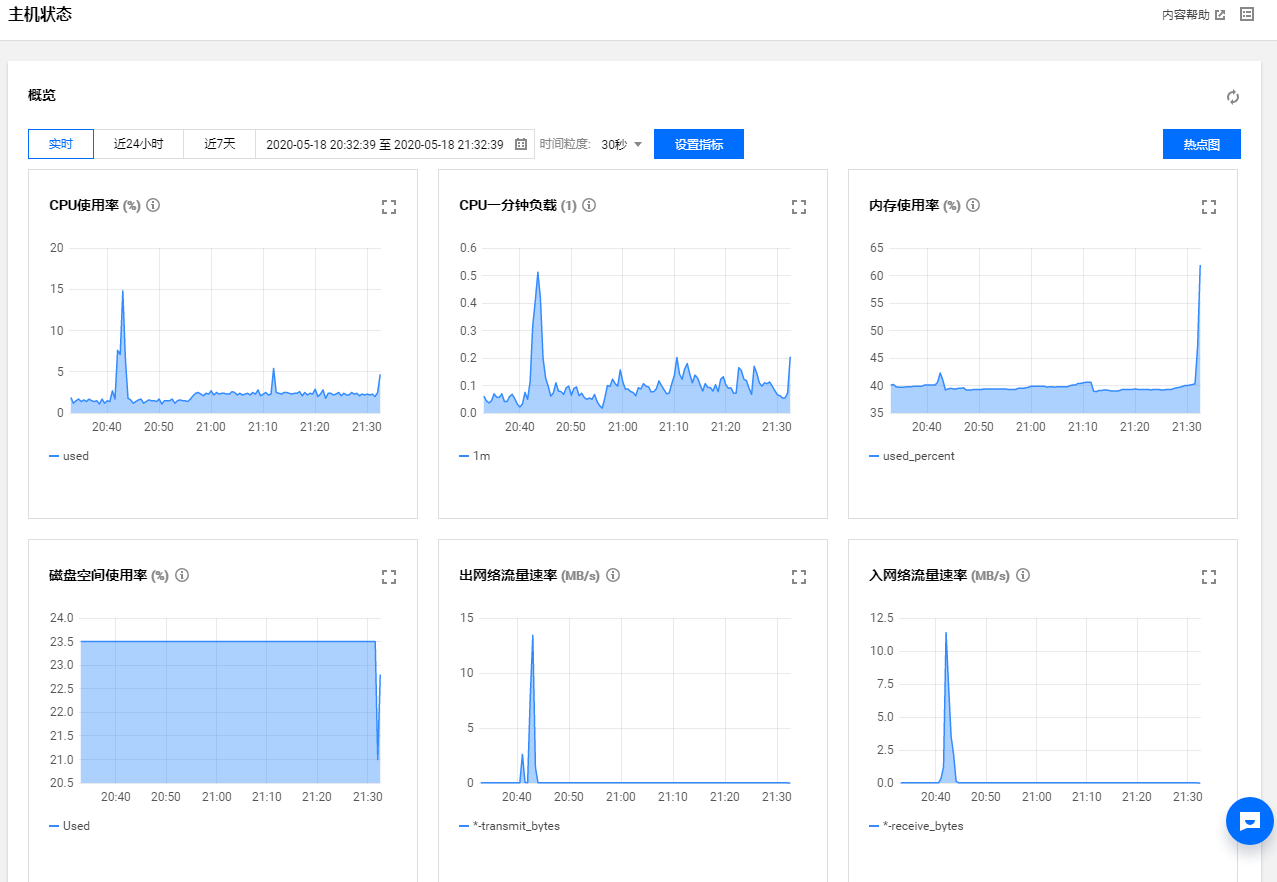
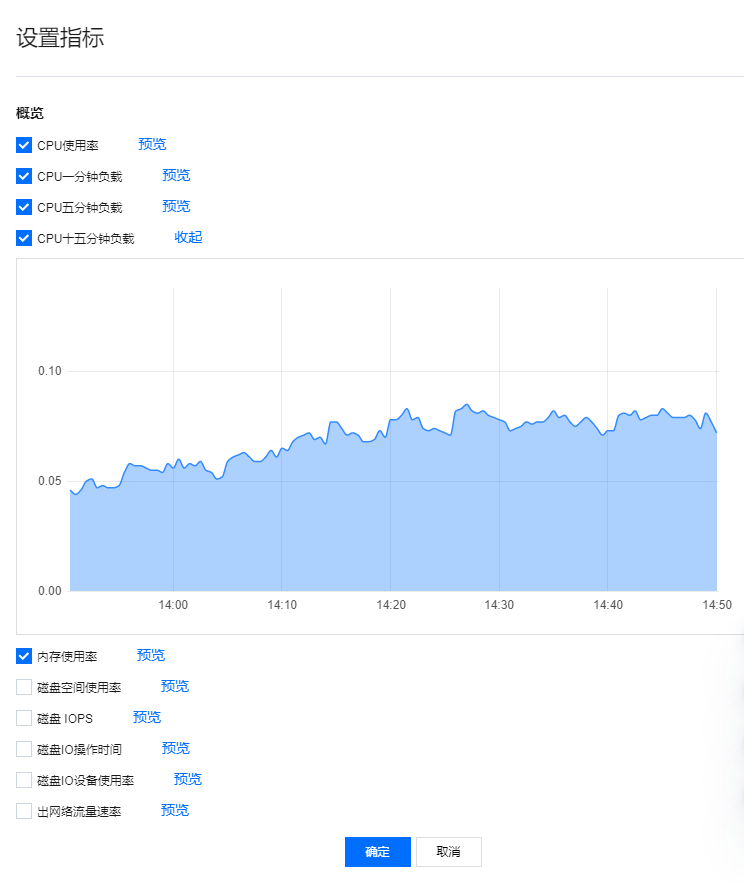
概览:可直观查看对应时间段所有节点聚合监控指标及指标各项统计规则。可单击设置指标自定义展示指标。
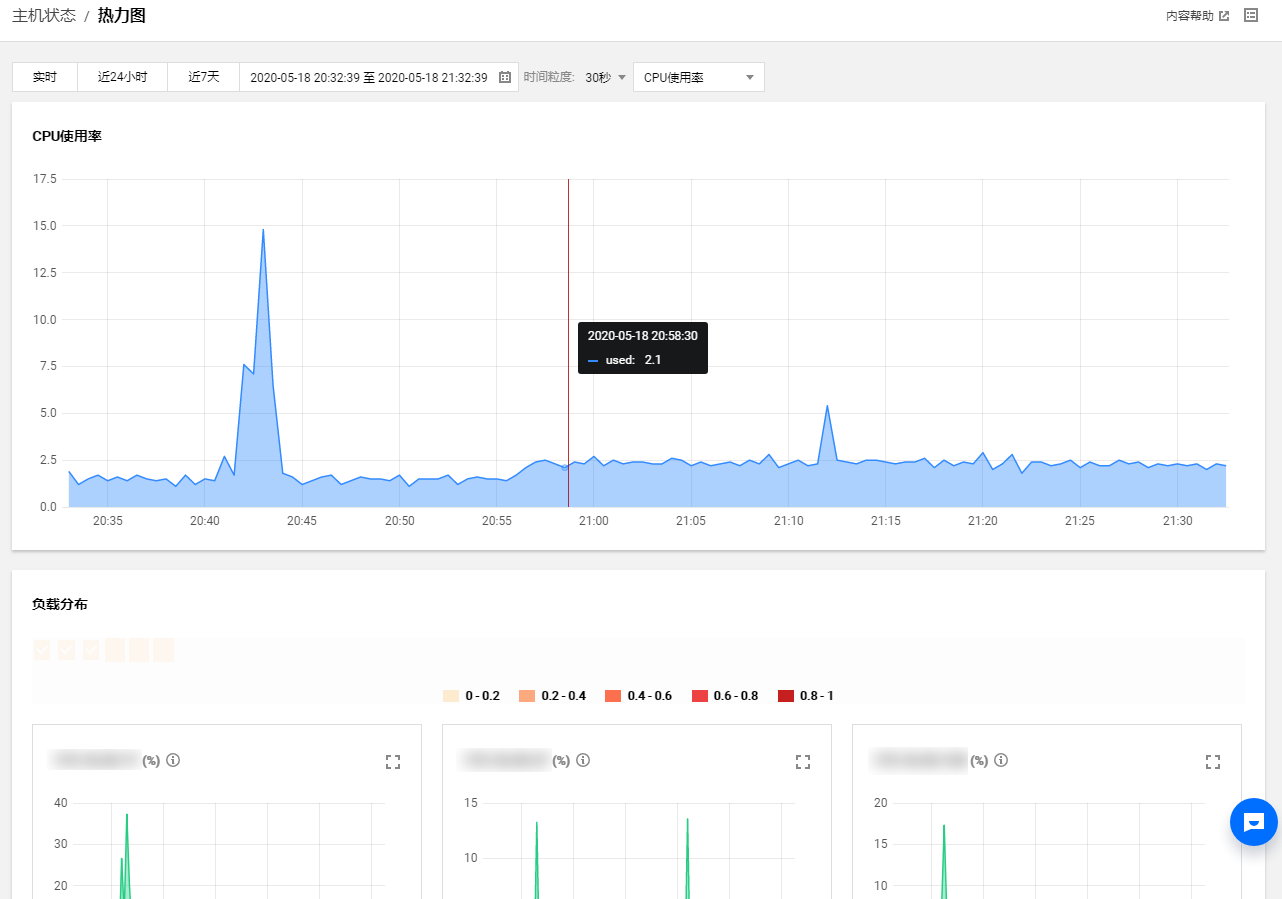
热点图:负载热点图更加直观地展示了节点的负载情况,同时可指定时间段和负载条件进行查看。负载热点图主要分为两部分,一部分为当前集群所有节点聚合负载图;一部分为所有节点单个热点图,可直观查看所有节点的负载情况。
节点列表:展示了当前所有节点和部署节点类型、CPU 利用率、内存利用率、磁盘利用率。单击对应节点 IP 可查看单个节点基本配置、部署状态、负载状态、节点监控等。
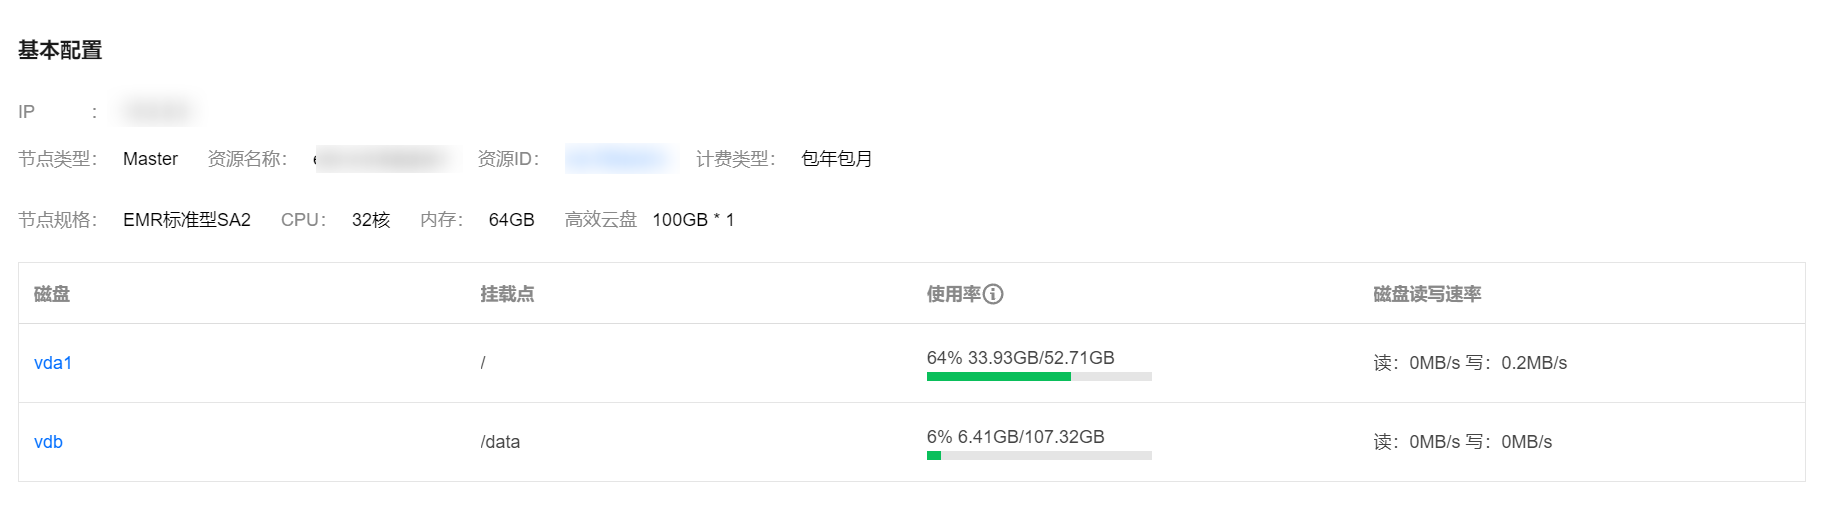
基本配置:可查看当前节点的基本信息,例如节点类型、资源名称、资源 ID、计费类型、规格大小等。
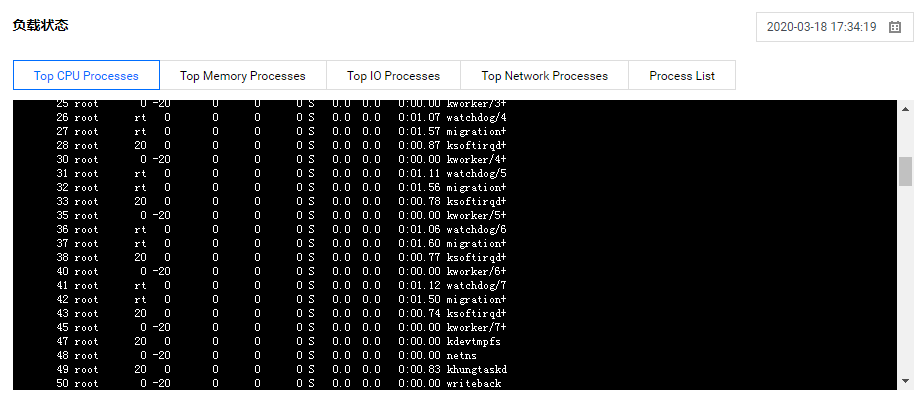
负载状态:可查看当前节点维度 TOP N 进程情况,同时可根据指定时间进行查看。
节点监控:可查看当前节点各分组指标负载趋势图,默认展示6个指标,最多可展示12个指标。可单击设置指标自定义展示指标。