功能介绍
集群事件中包含事件列表和事件策略。
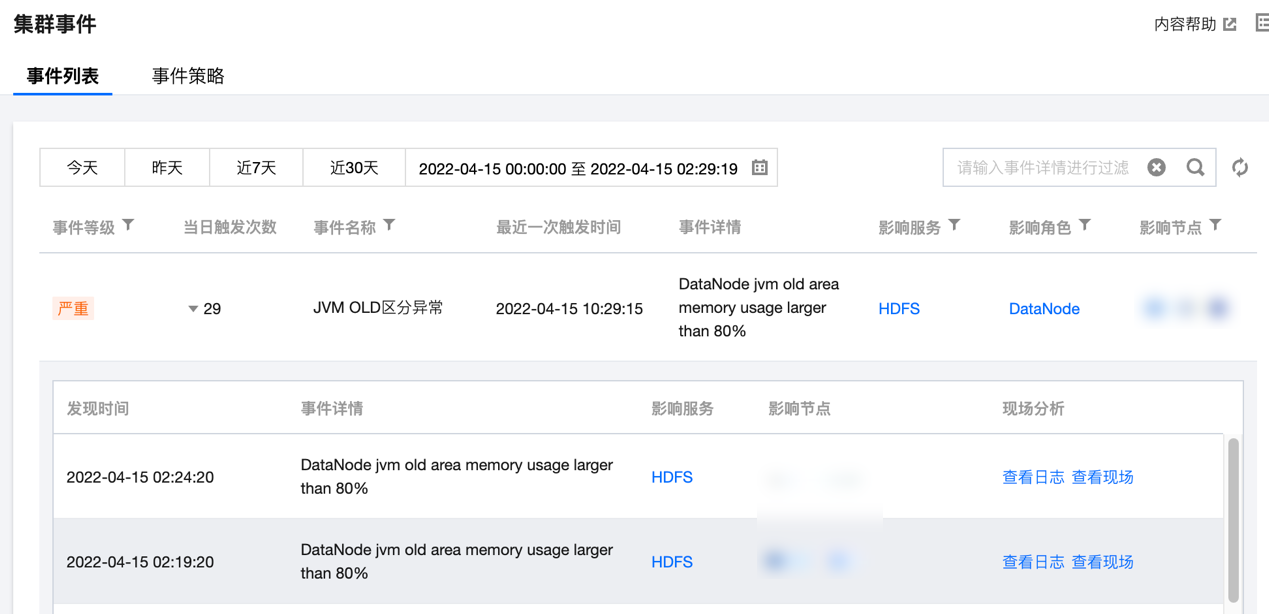
事件列表:记录集群发生的关键变化事件或异常事件。
事件策略:支持根据业务情况自定义事件监控触发策略,已开启监控的事件可设置为集群巡检项。
查看事件列表
1. 登录 弹性 MapReduce 控制台,在集群列表中单击对应的集群 ID/名称进入集群详情页。
2. 在集群详情页中选择集群监控 > 集群事件 > 事件列表,可直接查看当前集群所有操作事件。

严重程度说明如下:
致命:节点或服务的异常事件,人工干预处理,否则服务不可用,这类事件可能持续一段时间。
严重:暂时未造成服务或节点不可用问题,属于预警类,如果一直不处理会产生致命事件。
一般:记录集群发生的常规事件,一般无需特别处理。
3. 单击当日触发次数列值可查看事件的触发记录,同时可查看事件记录相关指标、日志或现场。
设置事件策略
1. 登录 EMR 控制台,在集群列表中单击对应的集群 ID/名称进入集群详情页。
2. 在集群详情页中选择集群监控 > 集群事件 > 事件策略,可以自定义设置事件监控触发策略。
3. 事件配置列表包含:事件名、事件发现策略、严重程度(致命/严重/一般)、开启监控,支持修改和保存。

4. 事件发现策略分两类:一类事件为系统固定策略事件,不支持用户修改;另一类事件会因客户业务标准的不同而变化,支持用户设置。

5. 事件策略可自定义是否开启事件监控,已开启监控的事件才支持在集群巡检的巡检项中选择。部分事件默认开启,部分事件默认开启且不可关闭。具体规则如下:
类别 | 事件名称 | 事件含义 | 建议&措施 | 默认值 | 严重程度 | 允许关闭 | 默认开启 |
节点 | CPU 利用率连续高于阈值 | 机器 CPU 利用率 >= m,持续时间 t 秒(300<=t<=2592000) | 节点扩容或升配 | m=85, t=1800 | 严重 | 是 | 是 |
| CPU IO wait 平均值高于阈值 | t 秒内机器 CPU iowait 使用率平均值 >= m(300<=t<=2592000) | 人工排查 | m=60, t=1800 | 严重 | 是 | 是 |
| CPU 1分钟负载连续高于阈值 | CPU 1分钟负载 >= m,持续时间 t 秒(300<=t<=2592000) | 节点扩容或升配 | m=8, t=1800 | 一般 | 是 | 否 |
| CPU 5分钟负载连续高于阈值 | CPU 5分钟负载 >= m,持续时间 t 秒(300<=t<=2592000) | 节点扩容或升配 | m=8, t=1800 | 严重 | 是 | 否 |
| 内存使用率持续高于阈值 | 内存使用率 >= m,持续时间 t 秒(300<=t<=2592000) | 节点扩容或升配 | m=85, t=1800 | 严重 | 是 | 是 |
| 系统进程总数连续高于阈值 | 系统进程总数 >= m,持续时间 t 秒(300<=t<=2592000) | 人工排查 | m=10000, t=1800 | 严重 | 是 | 是 |
| 节点文件句柄使用率持续超过阈值 | 节点文件句柄使用率 >= m,持续时间 t 秒(300<=t<=2592000) | 人工排查 | m=85, t=1800 | 一般 | 是 | 否 |
| 节点 TCP 连接数持续超过阈值 | 节点 TCP 连接数 >= m,持续时间 t 秒(300<=t<=2592000) | 检查是否存在连接泄露 | m=10000, t=1800 | 一般 | 是 | 否 |
| 节点内存使用配置超过阈值 | 节点上所有角色内存使用配置叠加超过节点物理内存阈值 | 调整节点进程堆内存分配 | 90% | 严重 | 是 | 否 |
| 元数据库异常 | 使用连接测试命令无法正常连接元数据库 | 人工排查 | - | 严重 | 是 | 是 |
| 单盘空间使用率持续高于阈值 | 单盘空间使用率>=m,持续时间 t秒(300<=t<=2592000) | 节点扩容或升配 | m=0.85, t=1800 | 严重 | 是 | 是 |
| 单盘 IO 设备利用率持续高于阈值 | 单盘 IO 设备利用率>=m,持续时间 t秒(300<=t<=2592000) | 节点扩容或升配 | m=0.85, t=1800 | 严重 | 是 | 是 |
| 单盘 INODES 使用率持续高于阈值 | 单盘 INODES 使用率>=m,持续时间 t秒(300<=t<=2592000) | 节点扩容或升配 | m=0.85, t=1800 | 严重 | 是 | 是 |
| 子机 UTC 时间和 NTP 时间差值高于阈值 | 子机 UTC 时间和 NTP 时间差值高于阈值(单位毫秒) | 1. 确保 NTP daemon 处于运行状态 2. 确保与 NTP server 的网络通信正常 | 差值=30000 | 严重 | 是 | 是 |
| 故障节点自动补偿 | 当开启自动补偿功能后,task 节点和 router 节点异常时,系统将自动购买同机型规格配置进行补偿替换 | 1. 补偿替换成功,无须关注 2. 补偿替换失败,请前往 控制台 手动销毁,重新购买节点进行替换 | - | 一般 | 是 | 是 |
| 节点故障 | 集群中有故障节点 | - | 严重 | 否 | 是 | |
| 节点磁盘 IO 异常 | 节点磁盘 IO 异常(检测基于设备 IOPS 和 IO 设置使用率,适用部分 IO 异常情况) | 节点磁盘 IO 异常。 处理方式:可能是 IO Hang 或磁盘异常导致 | - | 严重 | 是 | 否 |
| 实例硬盘异常待授权 | 实例发生硬盘异常,需要授权维修 | 请登录云服务维修任务控制台,对维修任务进行授权操作 | - | 严重 | 是 | 是 |
| 实例运行异常待授权 | 实例发生运行异常,需要授权维修 | 请登录云服务维修任务控制台,对维修任务进行授权操作 | - | 严重 | 是 | 是 |
| 实例运行隐患待授权 | 实例运行隐患待授权 | 请登录云服务维修任务控制台,对维修任务进行授权操作 | - | 严重 | 是 | 否 |
| 连接跟踪表满 | 连接跟踪表满 | 1.人工排查
2.提单咨询 | - | 严重 | 是 | 否 |
| 子机 nvme 设备error | 子机 nvme 盘故障导致掉盘 | 1.隔离问题盘的读写,卸载对应目录
2.提单咨询 | - | 严重 | 是 | 是 |
| 连接数超限导致丢包 | 连接数超限导致丢包 | 1.人工排查
2.提单咨询 | - | 严重 | 是 | 否 |
| 外网出带宽超限导致丢包 | 云服务器实例外网出带宽超过主机的外网出带宽限制导致丢包。带宽毛刺导致的丢包不会体现在带宽图表中,
原因:带宽最细统计粒度为 10 级(10 秒内总流量/10 秒)。若常量带宽没有明显超出也可忽略 | 提高外网带宽上限。如果已达到可购买的最高上限,可通过负载均衡等方式降低单机带宽 | - | 严重 | 是 | 否 |
| 机器重启 | 机器重启 | 当云服务器被重启的时候,会触发该事件,请根据实际情况查看状态变更是否符合预期 | - | 严重 | 是 | 是 |
| 内存 OOM | 系统内存使用过载 | 评估当前系统所配置内存是否满足业务内存需求,如果需要更大的内存建议升级 CVM 内存配置 | - | 严重 | 是 | 是 |
| 内核故障 | 操作系统内核 bug 或驱动问题导致操作系统内核发生致命错误 | 检查系统中是否有加载内核自身携带的内核驱动以外的其它内核驱动模块。尝试不要加载这些模块,观察系统运行情况 | - | 严重 | 是 | 是 |
| 磁盘只读 | 磁盘无法写入数据 | 检查云服务器当前的运行状态是否正常,如果发生了系统挂死等情况,可以从控制台重启(强制重启)恢复 | - | 严重 | 是 | 是 |
| 节点指标数据采集丢失 | 节点指标数据采集异常 | 人工排查 | - | 一般 | 是 | 是 |
HDFS | HDFS 文件总数持续高于阈值 | 集群文件总数量 >= m,持续时间 t 秒(300<=t<=2592000) | 调大 namenode 内存 | m=50,000,000, t=1800 | 严重 | 是 | 否 |
| HDFS 总 block 数量持续高于阈值 | 集群 Blocks 总数量 >= m,持续时间 t 秒(300<=t<=2592000) | 调大 namenode 内存或调大 block size | m=50,000,000, t=1800 | 严重 | 是 | 否 |
| HDFS 标记为 Dead 状态的数据节点数量持续高于阈值 | 标记为 Dead 状态的数据节点数量 >= m,持续时间 t 秒(300<=t<=2592000) | 人工排查 | m=1,t=1800 | 一般 | 是 | 否 |
| HDFS 存储空间使用率持续高于阈值 | HDFS 存储空间使用率 >= m,持续时间 t 秒(300<=t<=2592000) | 清理 HDFS 中的文件或对集群扩容 | m=85, t=1800 | 严重 | 是 | 是 |
| NameNode 发生主备切换 | NameNode 发生主备切换 | 排查 NameNode 切换的原因 | - | 严重 | 是 | 是 |
| NameNode RPC 请求处理延迟持续高于阈值 | RPC 请求处理延迟 >= m毫秒,持续时间 t 秒(300<=t<=2592000) | 人工排查 | m=300, t=300 | 严重 | 是 | 否 |
| NameNode 当前连接数持续高于阈值 | NameNode 当前连接数 >= m,持续时间 t 秒(300<=t<=2592000) | 人工排查 | m=2000, t=1800 | 一般 | 是 | 否 |
| NameNode 发生 full GC | NameNode 发生 full GC | 参数调优 | - | 严重 | 是 | 是 |
| NameNode JVM 内存使用率持续高于阈值 | NameNode JVM 内存使用率持续 >= m,持续时间 t 秒(300<=t<=2592000) | 调整 NameNode 堆内存大小 | m=85, t=1800 | 严重 | 是 | 是 |
| DataNode RPC 请求处理延迟持续高于阈值 | RPC 请求处理延迟 >= m毫秒,持续时间 t 秒(300<=t<=2592000) | 人工排查 | m=300, t=300 | 一般 | 是 | 否 |
| DataNode 当前连接数持续高于阈值 | DataNode 当前连接数 >= m,持续时间 t 秒(300<=t<=2592000) | 人工排查 | m=2000, t=1800 | 一般 | 是 | 否 |
| DataNode 发生 full GC | NameNode 发生 full GC | 参数调优 | - | 一般 | 是 | 否 |
| DataNode JVM 内存使用率持续高于阈值 | NameNode JVM 内存使用率持续 >= m,持续时间 t 秒(300<=t<=2592000) | 调整 DataNode 堆内存大小 | m=85, t=1800 | 一般 | 是 | 是 |
| HDFS 两个NameNode 服务状态均为 Standby | 两个 NameNode 角色同时处于 StandBy 状态 | 人工排查 | - | 严重 | 是 | 是 |
| HDFS MissingBlocks 数量持续高于阈值 | 集群 MissingBlocks 数量>=m,持续时间t秒(300<=t<=604800) | 建议排查 HDFS 出现数据块损坏,使用命令 hadoop fsck / 检查 HDFS 文件分布的情况 | m=1,t=1800 | 严重 | 是 | 是 |
| HDFS NameNode 进入安全模式 | NameNode 进入安全模式(持续300s) | 建议排查 HDFS 出现数据块损坏,使用命令 hadoop fsck / 检查 HDFS 文件分布的情况 | - | 严重 | 是 | 是 |
| HDFS NameNode 长时间未做 checkpoint | HDFS NameNode 长时间未做 checkpoint | 1. 检查 SecondaryNameNode(Standby NameNode) 的状态 2. 检查 HDFS 配置文件 hdfs-site.xml 中的
dfs.namenode.checkpoint.period和dfs.namenode.checkpoint.txns 参数 3. 查看 HDFS 集群的日志信息 | m=24 | 一般 | 是 | 是 |
| HDFS 小文件占比超过指定阈值 | 小文件比率>=50%,每天巡检一次 | 合并相同类型的小文件或定时清理掉小文件或用对象存储来存小文件 | m=50 | 一般 | 是 | 是 |
| HDFS 目录满 | HDFS存在目录,其下节点个数超过警戒阈值 | 清理目录下的节点数量,或者提高目录的容量限制值 | m=95 | 严重 | 是 | 是 |
YARN | 集群当前丢失的 NodeManager 的个数持续高于阈值 | 集群当前丢失的 NodeManager 的个数 >= m,持续时间 t 秒(300<=t<=2592000) | 检查 NM 进程状态,检查网络是否畅通 | m=1, t=1800 | 一般 | 是 | 否 |
| Pending Containers 个数持续高于阈值 | pending Containers 个数 >= m个,持续时间 t 秒(300<=t<=2592000) | 合理指定 YARN 任务可用资源 | m=90, t=1800 | 一般 | 是 | 否 |
| 集群内存使用率持续高于阈值 | 内存使用率 >= m,持续时间 t 秒(300<=t<=2592000) | 集群扩容 | m=85, t=1800 | 严重 | 是 | 是 |
| 集群 CPU 使用率持续高于阈值 | CPU 使用率 >= m,持续时间 t 秒(300<=t<=2592000) | 集群扩容 | m=85, t=1800 | 严重 | 是 | 是 |
| 各队列中可用的 CPU 核数持续低于阈值 | 任意队列中可用 CPU 核数 <= m,持续时间 t 秒(300<=t<=2592000) | 给队列分配更多资源 | m=1, t=1800 | 一般 | 是 | 否 |
| 各队列中可用的内存持续低于阈值 | 任意队列中可用内存 <= m,持续时间 t 秒(300<=t<=2592000) | 给队列分配更多资源 | m=1024, t=1800 | 一般 | 是 | 否 |
| ResourceManager 发生主备切换 | ResourceManager 发生了主备切换 | 检查 RM 进程状态,查看 standby RM 日志查看主备切换原因 | - | 严重 | 是 | 是 |
| ResourceManager 发生 full GC | ResourceManager 发生了 full GC | 参数调优 | - | 严重 | 是 | 是 |
| ResourceManager JVM 内存使用率持续高于阈值 | RM JVM 内存使用率持续 >= m,持续时间 t 秒(300<=t<=2592000) | 调整 ResourceManager 堆内存大小 | m=85, t=1800 | 严重 | 是 | 是 |
| NodeManager 发生 full GC | NodeManager 发生 full GC | 参数调优 | - | 一般 | 是 | 否 |
| NodeManager 可用的内存持续低于阈值 | 单个 NM 可用内存持续 <= m,持续时间 t 秒(300<=t<=2592000) | 调整 NodeManager 堆内存大小 | m=1, t=1800 | 一般 | 是 | 否 |
| NodeManager JVM 内存使用率持续高于阈值 | NM JVM 内存使用率持续 >= m,持续时间 t 秒(300<=t<=2592000) | 调整 NodeManager 堆内存大小 | m=85, t=1800 | 一般 | 是 | 否 |
| YARN ResourceManager 无 active 状态 | YARN ResourceManager 无 active 状态 | 人工排查 | t=90 | 严重 | 是 | 是 |
| YARN Application作业运行失败次数持续高于阈值 | YARN Application 作业运行失败 | 人工排查 | m=1,t=300 | 一般 | 是 | 否 |
| YARN 当前不健康的 NodeManager 的个数持续高于阈值 | Unhealthy NodeManager 个数>=m
,持续时间t秒(300<=t<=2592000) | 人工排查 | m=1,t=1800 | 一般 | 是 | 否 |
| App 查询元数据加速桶单桶带宽超过指定阈值 | App 查询元数据加速桶, 单桶读带宽超过指定阈值 >=m(GB/s), 写带宽超过指定阈值 >=m(GB/s) | 人工排查 | m1=10(GB/s) m2=10(GB/s) | 一般 | 是 | 否 |
| App 查询元数据加速桶单桶请求频率超过指定阈值 | App 查询元数据加速桶,单桶各 API 请求频率超过执行阈值>=m(次/秒) | 人工排查 | m1=10000 m2=10000 m3=10000 m4=10000 | 一般 | 是 | 否 |
| YARN application运行时长高于阈值 | YARN application 运行时间>=m(min) | 人工排查 | t=30min | 一般 | 是 | 否 |
| 被拉黑的 NodeManager 阈值 | App 被拉黑的节点数大于阈值 | 人工排查 | m=0 | 一般 | 是 | 否 |
| 元数据加速桶或 CHDFS 流量带宽打满 | 10分钟内出现503错误的COS桶 | 人工排查 | m=3.8 | 一般 | 是 | 否 |
YARN 队列(需申请) | 队列资源使用占比超过指定阈值 | YARN 队列 App 资源使用超过阈值 | 人工排查 | 队列App m=50 | 一般 | 是 | 否 |
| 队列 APP 物理节点本地磁盘使用占比超过指定阈值 | YARN 队列 App 物理节点本地磁盘使用占比在单节点超过一定阈值 | 人工排查 | 队列App m=50 | 一般 | 是 | 否 |
| 队列 APP 物理节点CPU占比超过指定阈值 | YARN 队列 App 物理 CPU 使用在单节点超过一定比例 | 人工排查 | 队列App m=50 | 一般 | 是 | 否 |
| 队列任务执行过零点告警 | YARN 队列任务执行过零点 | 人工排查 | 无 | 一般 | 是 | 否 |
| 队列任务运行时间超过阈值 | YARN 队列中的任务执行时间超过预设阈值(分钟) | 1. 检查任务配置:确认任务的超时阈值设置是否合理。 2. 资源分配:检查队列的资源分配情况,确保任务有足够的资源运行。 3. 日志分析:查看任务日志,定位超时的具体原因。 4. 优化任务:根据分析结果优化任务逻辑或资源配置 | m=10 min | 一般 | 是 | 否 |
YARN (灰度支持需开启相关洞察) | App 物理 CPU 占比超过指定阈值 | App 物理 CPU 使用超过一定比例 | 人工排查 | m=50 | 一般 | 是 | 否 |
| App 物理内存占比超过指定阈值 | App 物理内存使用超过一定比例 | 人工排查 | m=50 | 一般 | 是 | 否 |
| App 物理节点磁盘读写超过指定阈值 | App 物理磁盘读写 IO 在单节点超过一定阈值 | 人工排查 | m=50 (kb/s) | 一般 | 是 | 否 |
| App 物理节点CPU 占比超过指定阈值 | App 物理 CPU 使用在单节点超过一定比例 | 人工排查 | m=50 | 一般 | 是 | 否 |
| App 物理节点内存占比超过指定阈值 | App 物理内存使用在单节点超过一定比例 | 人工排查 | m=50 | 一般 | 是 | 否 |
| App 作业天同比提交量超过指定阈值 | App 作业天同比提交量超过指定阈值 | 人工排查 | m=50 | 一般 | 是 | 否 |
| App 物理节点本地磁盘使用占比超过指定阈值 | App 物理节点本地磁盘使用占比在单节点超过一定阈值 | 人工排查 | m=60 | 一般 | 是 | 否 |
HBase | 集群处于 RIT Region 个数持续高于阈值 | 集群处于 RIT Region 个数 >= m,持续时间 t 秒(300<=t<=2592000) | HBase2.0 版本以下,hbase hbck -fixAssigment | m=1, t=60 | 严重 | 是 | 是 |
| 集群 dead RS 数量持续高于阈值 | 集群 dead RegionServer 数量 >= m,持续时间 t 秒(300<=t<=2592000) | 人工排查 | m=1, t=300 | 一般 | 是 | 是 |
| 集群每个 RS 平均 REGION 数持续高于阈值 | 集群每个 RegionServer 平均 REGION 数 >= m,持续时间 t 秒(300<=t<=2592000) | 节点扩容或升配 | m=300, t=1800 | 一般 | 是 | 是 |
| HMaster 发生 Full GC | HMaster 发生了 Full GC | 参数调优 | m=5, t=300 | 一般 | 是 | 是 |
| HMaster JVM 内存使用率持续高于阈值 | HMaster JVM 内存使用率 >= m,持续时间 t 秒(300<=t<=2592000) | 调整 HMaster 堆内存大小 | m=85, t=1800 | 严重 | 是 | 是 |
| HMaster 当前连接数持续高于阈值 | HMaster 当前连接数 >= m,持续时间 t 秒(300<=t<=2592000) | 人工排查 | m=1000, t=1800 | 一般 | 是 | 否 |
| RegionServer 发生 Full GC | RegionServer 发生 Full GC | 参数调优 | m=5, t=300 | 严重 | 是 | 否 |
| RegionServer JVM 内存使用率持续高于阈值 | RegionServer JVM 内存使用率 >= m,持续时间 t 秒(300<=t<=2592000) | 调整 RegionServer 堆内存大小 | m=85, t=1800 | 一般 | 是 | 否 |
| RegionServer 当前 RPC 连接数持续高于阈值 | RegionServer 当前 RPC 连接数 >= m,持续时间 t 秒(300<=t<=2592000) | 人工排查 | m=1000, t=1800 | 一般 | 是 | 否 |
| RegionServer Storefile 个数持续高于阈值 | RegionServer Storefile 个数 >= m,持续时间 t 秒(300<=t<=2592000) | 建议执行 major compaction | m=50000, t=1800 | 一般 | 是 | 否 |
| HBASE 两个 HMaster 服务状态均为 Standby | 两个 HMaster 角色同时处于 StandBy 状态 | 人工排查 | - | 严重 | 是 | 是 |
| HMaster
发生主备切换 | HMaster发生主备切换 | 通过 HMaster 服务日志进行排查 | - | 严重 | 是 | 是 |
| Hbase Resource Group节点不足 | Hbase资源组(Resource Group)节点不足(小于或等于1) | 人工排查 | - | 一般 | 是 | 是 |
Hive | HiveServer2 发生 Full GC | HiveServer2 发生 Full GC | 参数调优 | m=5, t=300 | 严重 | 是 | 是 |
| HiveServer2 JVM 内存使用率持续高于阈值 | HiveServer2 JVM 内存使用率 >= m,持续时间 t 秒(300<=t<=2592000) | 调整 HiveServer2 堆内存大小 | m=85, t=1800 | 严重 | 是 | 是 |
| HiveMetaStore 发生 full GC | HiveMetaStore 发生 full GC | 参数调优 | m=5, t=300 | 一般 | 是 | 是 |
| HiveWebHcat 发生 full GC | HiveWebHcat 发生 full GC | 参数调优 | m=5, t=300 | 一般 | 是 | 是 |
| HIVE SQL 编译时间高于阈值 | HIVE SQL 编译时间高于阈值 | 人工排查 | t=60 | 一般 | 是 | 否 |
| Hive表BucketVersion不匹配 | Hive表bucket version不一致 | 针对对应的表调整hive.exec.bucketing.version | - | 一般 | 是 | 否 |
| Hive全表扫描分区表 | 全表扫描分区表 | 检查扫描条件 | - | 一般 | 是 | 否 |
| Hive select * | 使用 select *查询数据 | 添加limit条件 | - | 一般 | 是 | 否 |
Zookeeper | Zookeeper 连接数持续高于阈值 | Zookeeper 连接数 >= m,持续时间 t 秒(300<=t<=2592000) | 人工排查 | m=65535, t=1800 | 一般 | 是 | 否 |
| ZNode 节点数量持续高于阈值 | ZNode 节点数 >= m,持续时间 t 秒(300<=t<=2592000) | 人工排查 | m=2000, t=1800 | 一般 | 是 | 否 |
| Zookeeper 发生 leader 切换 | Zookeeper发生leader切换 | 通过 Zookeeper 服务日志进行排查 | - | 严重 | 是 | 是 |
| Zookeeper存储数据量超过阈值 | Zookeeper存储数据量>=阈值(Byte) | 人工排查 | 104857600Byte(100MB) | 一般 | 是 | 否 |
Impala | ImpalaCatalog JVM 内存使用率持续高于阈值 | ImpalaCatalog JVM 内存使用率>=m,持续时间 t秒(300<=t<=604800) | 调整 ImpalaCatalog 堆内存大小 | m=0.85, t=1800 | 一般 | 是 | 否 |
| ImpalaDaemon JVM 内存使用率持续高于阈值 | ImpalaDaemon JVM 内存使用率>=m,持续时间 t秒(300<=t<=604800) | 调整 ImpalaDaemon 堆内存大小 | m=0.85, t=1800 | 一般 | 是 | 否 |
| Impala Beeswax API 客户端连接数高于阈值 | Impala Beeswax API 客户端连接数 >=m | 控制台调整 impalad.flgs 配置 fe_service_threads 数量 | m=64,t=120 | 严重 | 是 | 是 |
| Impala HS2客户端连接数高于阈值 | Impala HS2客户端连接数 >=m | 控制台调整 impalad.flgs 配置 fe_service_threads 数量 | m=64,t=120 | 严重 | 是 | 是 |
| Query 运行时长超过阈值 | Query 运行时长超过阈值>=m(seconds) | 人工排查 | - | 严重 | 是 | 否 |
| 执行 Query 失败总数高于阈值 | 执行 Query 失败率高于阈值>=m,统计时间粒度t秒(300<=t<=604800) | 人工排查 | m=1,t=300 | 严重 | 是 | 否 |
| 提交 Query 总数高于阈值 | 执行 Query 失败总数高于阈值>=m,统计时间粒度t秒(300<=t<=604800) | 人工排查 | m=1,t=300 | 严重 | 是 | 否 |
| 执行 Query 失败率高于阈值 | 提交 Query 总数高于阈值 >=m,统计时间粒度t秒(300<=t<=604800) | 人工排查 | m=1,t=300 | 严重 | 是 | 否 |
| Created 状态总数高于阈值 | Created 状态总数高于阈值 | 人工排查 | m=50,t=300 | 一般 | 是 | 否 |
| Created 状态时长超过阈值 | Created 状态时长超过阈值 | 人工排查 | t=1 | 一般 | 是 | 否 |
| Impala查询返回行数过多 | Impala查询返回行数大于阈值n | 优化查询 | n=100000 | 严重 | 是 | 否 |
| Impala查询扫描行数过多 | Impala查询扫描行数大于阈值n | 优化查询 | n=200000 | 严重 | 是 | 否 |
PrestoSQL | PrestoSQL 当前失败节点数量持续高于阈值 | PrestoSQL 当前失败节点数量>=m,持续时间t秒(300<=t<=604800) | 人工排查 | m=1, t=1800 | 严重 | 是 | 是 |
| PrestoSQL 当前资源组排队资源持续高于阈值 | PrestoSQL 资源组排队任务>=m,持续时间 t秒(300<=t<=604800) | 参数调优 | m=5000, t=1800 | 严重 | 是 | 是 |
| PrestoSQL 每分钟失败查询数量超过阈值 | PrestoSQL 失败查询数量 >=m | 人工排查 | m=1, t=1800 | 严重 | 是 | 否 |
| PrestoSQLCoordinator 发生full GC | PrestoSQLCoordinator 发生full GC | 参数调优 | - | 一般 | 是 | 否 |
| PrestoSQLCoordinator JVM 内存使用率持续高于阈值 | PrestoSQLCoordinator JVM 内存使用率>=m,持续时间 t秒(300<=t<=604800) | 调整 PrestoSQLCoordinator 堆内存大小 | m=0.85, t=1800 | 严重 | 是 | 是 |
| PrestoSQLWorker 发生 full GC | PrestoSQLWorker 发生 full GC | 参数调优 | - | 一般 | 是 | 否 |
| PrestoSQLWorker JVM 内存使用率持续高于阈值 | PrestoSQLWorker JVM 内存使用率>=m,持续时间 t秒(300<=t<=604800) | 调整 PrestoSQLWorker 堆内存大小 | m=0.85, t=1800 | 严重 | 是 | 否 |
| PRESTO 查询消耗CPU时间或累计内存高于指定阈值 | 查询消耗CPU时间或累计内存高于指定阈值 | 人工排查 | m=60,t=1 | 一般 | 是 | 否 |
| PRESTO 执行时长告警 | 查询消耗CPU时间或累计内存高于指定阈值 | 人工排查 | t=1800 | 一般 | 是 | 否 |
Presto | Presto 当前失败节点数量持续高于阈值 | Presto 当前失败节点数量>=m,持续时间t秒(300<=t<=604800) | 人工排查 | m=1, t=1800 | 严重 | 是 | 是 |
| Presto 当前资源组排队资源持续高于阈值 | Presto 资源组排队任务>=m,持续时间 t秒(300<=t<=604800) | 参数调优 | m=5000, t=1800 | 严重 | 是 | 是 |
| Presto 每分钟失败查询数量超过阈值 | Presto 失败查询数量 >=m | 人工排查 | m=1, t=1800 | 严重 | 是 | 否 |
| PrestoCoordinator 发生full GC | PrestoCoordinator 发生full GC | 参数调优 | - | 一般 | 是 | 否 |
| PrestoCoordinator JVM 内存使用率持续高于阈值 | PrestoCoordinator JVM 内存使用率>=m,持续时间 t秒(300<=t<=604800) | 调整 PrestoCoordinator 堆内存大小 | m=0.85, t=1800 | 一般 | 是 | 是 |
| PrestoWorker 发生 full GC | PrestoWorker 发生 full GC | 参数调优 | - | 一般 | 是 | 否 |
| PrestoWorker JVM 内存使用率持续高于阈值 | PrestoWorker JVM 内存使用率>=m,持续时间 t秒(300<=t<=604800) | 调整 PrestoWorker 堆内存大小 | m=0.85, t=1800 | 严重 | 是 | 否 |
| PRESTO 执行时长超过阈值告警 | 执行时长超过阈值(秒) | 人工排查 | t=1800 | 一般 | 是 | 否 |
Trino | TRINO 查询任务指标超过指定阈值 | TRINO 查询任务对应维度指标超过指定阈值 | 调整集群资源配置或者检查修改查询 | m1=9999999 or m2=9999999999 or m3=9999999999999 or m4=9999999999999 | 严重 | 是 | 否 |
| TRINO 查询消耗CPU时间或累计内存高于指定阈值 | 查询消耗 CPU 时间或累计内存高于指定阈值 | 人工排查SPARK任务执行失败 | t=1800 | 一般 | 是 | 否 |
| TRINO 执行时长告警 | 执行时长超过阈值(秒) | 人工排查 | t=1800 | 一般 | 是 | 否 |
| TRINO 全表扫描分区表 | 全表扫描分区表 | 检查扫描条件 | - | 一般 | 是 | 是 |
| TRINO 执行时长超过阈值告警 | 执行时长超过阈值(秒) | 人工排查 | t=1800 | 一般 | 是 | 否 |
| TRINO查询资源使用过多 | Trino查询资源使用过多 | 优化查询 | - | 一般 | 是 | 是 |
Alluxio | Alluxio 当前 Worker 总数持续低于阈值 | Alluxio 当前 Worker 总数持续低于阈值<=m,持续时间 t秒(300<=t<=604800) | 人工排查 | m=1, t=1800 | 严重 | 是 | 否 |
| Alluxio worker 层上资源使用率持续高于阈值 | Alluxio 当前 Worker 的层上容量使用率>=m, 持续时间 t秒(300<=t<=604800) | 参数调优 | m=0.85, t=1800 | 严重 | 是 | 否 |
| AlluxioMaster 发生Full GC | AlluxioMaster 发生Full GC | 人工排查 | - | 一般 | 是 | 否 |
| AlluxioMaster JVM 内存使用率持续高于阈值 | AlluxioMaster JVM 内存使用率 >=m, 持续时间 t秒(300<=t<=604800) | 调整 AlluxioMaster 堆内存大小 | m=0.85, t=1800 | 严重 | 是 | 是 |
| AlluxioWorker 发生 Full GC | AlluxioWorker 发生 Full GC | 人工排查 | - | 一般 | 是 | 否 |
| AlluxioWorker JVM 内存使用率持续高于阈值 | AlluxioWorker JVM 内存使用率 >=m, 持续时间 t秒(300<=t<=604800) | 调整 AlluxioWorker 堆内存大小 | m=0.85, t=1800 | 严重 | 是 | 是 |
Kudu | 集群副本倾斜度高于阈值 | 集群副本倾斜度 >=m,持续时间 t秒(300<=t<=3600) | 使用 rebalance 命令对 replica 进行平衡 | m=100, t=300 | 一般 | 是 | 是 |
| 混合时钟错误高于阈值 | 混合时钟错误 >=m,持续时间 t秒(300<=t<=3600) | 确保 NTP daemon 处于运行状态,确保与 NTP server 的网络通信正常 | m=5000000, t=300 | 一般 | 是 | 是 |
| 处于运行中状态的 tablet 高于阈值 | 处于运行中状态的 tablet 数量 >=m,持续时间 t秒(300<=t<=3600) | 单个节点 tablet 数量太多会影响性能,建议清理不需要的表和分区,或适当扩容 | m=1000, t=300 | 一般 | 是 | 是 |
| 处于失败状态的 tablet 高于阈值 | 处于失败状态的 tablet 数量 >=m,持续时间 t秒(300<=t<=3600) | 检查是否有磁盘不可用或者数据文件损坏 | m=1, t=300 | 一般 | 是 | 是 |
| 处于失败状态的数据目录数量高于阈值 | 处于失败状态的数据目录数量 >=m,持续时间 t秒(300<=t<=3600) | 检查 fs_data_dirs 参数中配置的路径是否可用 | m=1, t=300 | 严重 | 是 | 是 |
| 容量耗尽的数据目录数量高于阈值 | 容量耗尽的数据目录数量 >=m,持续时间 t秒(120<=t<=3600) | 清理不需要的数据文件,或适当扩容 | m=1, t=120 | 严重 | 是 | 是 |
| 因队列过载被拒绝的写请求数高于阈值 | 因队列过载被拒绝的写请求数>=m,持续时间t秒(300<=t<=3600) | 检查是否存在写热点或者工作线程数量偏少 | m=10, t=300 | 一般 | 是 | 否 |
| 过期 scanner 的数量高于阈值 | 过期 scanner 的数量 >=m,持续时间 t秒(300<=t<=3600) | 数据读取完成后,记得调用 scanner 的 close 方法 | m=100, t=300 | 一般 | 是 | 是 |
| 错误日志的数量高于阈值 | 错误日志的数量 >=m,持续时间 t秒(300<=t<=3600) | 人工排查 | m=10, t=300 | 一般 | 是 | 是 |
| 在队列中等待超时的 RPC 请求数量高于阈值 | 在队列中等待超时的 RPC 请求数量 >=m,持续时间 t秒(300<=t<=3600) | 检查系统负载是否过高 | m=100, t=300 | 一般 | 是 | 是 |
Spark | SPARK 任务执行失败 | 集群存在失败 SPARK 任务数>m个 | 人工排查 | m=0 | 一般 | 是 | 否 |
| SparkSQL 全表扫描分区表 | 全表扫描分区表 | 检查扫描条件 | - | 一般 | 是 | 否 |
| 多 Spark App 并发插入相同表 | 写入同表时间交叉的 Spark App | 设置mapreduce.fileoutputcommitter.cleanup.skipped and mapreduce.fileoutputcommitter.task.cleanup.enabled 为 true | - | 一般 | 是 | 是 |
Kerberos | Kerberos 响应时间持续高于阈值 | Kerberos 响应时间>=m(单位毫秒),持续时间t秒(300<=t<=604800) | 人工排查 | m=100,t=1800 | 严重 | 是 | 是 |
StarRocks | STARROCKS 执行时长超过阈值告警 | 执行时长超过阈值(秒) | 人工排查 | m=180 | 一般 | 是 | 否 |
| STARROCKS 全表扫描分区表 | 全表扫描分区表 | 检查扫描条件 | - | 一般 | 是 | 否 |
| StarRocks单查询CPU占用比例过多 | BE/CN节点CPU使用率持续n秒大于阈值m,n秒内查询CPU用量占所有查询比例%大于阈值t,5<=n<=300s | 优化查询 | n=30s,m=80%,t=50% | 一般 | 是 | 否 |
| 同参数化SQL高频提交预警 | 时间周期内(秒) 30<=t<=86400,相同参数化SQL提交次数超过阈值 1<=n<=100000000 | 人工排查 | t=60, n=100 | 一般 | 是 | 否 |
| 执行任务CPU使用过高告警 | 执行任务CPU使用总时间大于(毫秒) n>=1 | 人工排查 | n=200000 | 一般 | 是 | 否 |
| 算子时间占总时间比例过多 | StarRocks查询单算子时间占总时间比例过多 | 优化查询 | - | 一般 | 是 | 是 |
| StarRocks查询返回行数大于阈值 | StarRocks查询返回行数大于阈值n | 优化查询 | n=100000 | 严重 | 是 | 否 |
UNIFFLE | ShuffleServer 应用写入 TopN | 指标来源 shuffle server /metrics topN_of_total_data_size_for_app | 终止 App 或扩容磁盘 | 3分钟内磁盘平均用量超过50 | 一般 | 是 | 否 |
集群 | 自动伸缩策略执行失败 | 1. 集群状态未处于可扩容状态。 2. 账号余额不足,扩容规则执行失败。 3. 预设扩容资源规格售罄,无法触发扩容。 4. 弹性扩容资源发货失败。 5. 当前账户资源剩余配额不足,扩容规则执行失败。 6. 弹性扩容资源磁盘不足。 7. 集群同一节点缩容流程互斥,当前自动缩容的部分task节点(%s)已经在缩容流程中。 8. 集群流程冲突。 9. 集群绑定的子网弹性 IP 不足,扩容规则执行失败。 10. 当前设置过期重试时间过短,规则在过期重试时间内未触发扩缩容。 11. 内部错误。 | 1. 建议稍后重试或 提交工单联系内部研发人员。 2. 进行账户余额充值,保证账号余额充足。 3. 建议尝试更换充足的资源规格。 4. 建议稍后重试或 提交工单联系内部研发人员。 5. 建议调整资源配额或更换配额充足的机型。 6. 建议更换充足的资源规格搭配的磁盘类型或 提交工单联系内部研发人员。 7. - 8. 请稍后重试。 9. 建议更换同 VPC下的其他子网。 10. 建议调长过期重试时间。 11. 建议提交工单 联系内部研发人员。 | - | 严重 | 否 | 是 |
| 自动伸缩策略未触发 | 1. 未设置扩容资源规格,扩容规则无法触发。 2. 弹性资源已达到最大节点数限制,无法触发扩容。 3. 弹性资源已达到最小节点数限制,无法触发缩容。 4. 集群无弹性资源,缩容规则无法触发。 5. 集群无符合要求的弹性资源(剔除定时销毁资源),缩容规则无法触发。 6. 时间伸缩执行时间范围已到期。 7. 集群处于冷却窗口期,暂时无法扩缩容。 | 1. 添加伸缩规格配置,请至少设置一个弹性资源规格。 2. 建议尝试调整最大节点数。 3. 建议尝试调整最小节点数。 4. 建议补充弹性资源后执行缩容规则。 5. 建议补充弹性资源后执行缩容规则。 6. 如需继续使用该规则进行自动伸缩,请修改规则的生效时间范围。 7. 建议调整扩缩容规则的冷却时间。 | - | 一般 | 是 | 是 |
| 自动伸缩扩容部分成功 | 1. 扩容弹性资源已达到最大节点数限制,扩容规则执行部分成功。 2. 预设扩容资源规格库存不足,仅补充部分资源。 3. 实际发货数量小于目标扩容数量,仅补充部分资源。 4. 机型配额不足,仅补充部分资源。 5. 弹性扩容资源磁盘不足。 6. 集群流程冲突。 7. 集群绑定的子网弹性 IP 不足,资源补足失败。 8. 账号余额不足,资源补足失败。 9. 内部错误。 | 1. 如需继续扩容,建议尝试调整最大节点数。 2. 建议手动扩容库存充足资源,用于补充缺少需求资源。 3. 建议手动扩容库存充足资源,用于补充缺少需求资源。 4. 建议调整资源配额或更换配额充足的机型。 5. 建议更换充足的资源规格搭配的磁盘类型或提交工单联系内部研发人员。 6. 请稍后重试。 7. 建议更换同 VPC 下的其他子网。 8. 建议进行账户余额充值,保证账号余额充足。 9. 建议提交工单 联系内部研发人员。 | - | 一般 | 是 | 是 |
| JVM OLD 区异常 | JVM OLD 区异常 | 人工排查 | 1. old 区连续5分钟 80%或者 2. JVM 内存使用率达到90% | 严重 | 是 | 是 |
| 服务角色健康状态超时 | 服务角色健康状态超时,持续时间t秒(180<=t<=604800) | 服务角色健康状态连续分钟级超时。 处理方式:查看对应服务角色日志信息,根据日志处理。 | t=300 | 一般 | 是 | 否 |
| 服务角色健康状态异常 | 服务角色健康状态异常,持续时间t秒(180<=t<=604800) | 服务角色健康状态连续分钟级不可用。 处理方式:查看对应服务角色日志信息,根据日志处理。 | t=300 | 严重 | 是 | 是 |
| 节点角色进程重启 | 节点角色进程重启 | 人工排查 | - | 一般 | 否 | 是 |
| 引导脚本执行失败 | 引导脚本执行失败 | 人工排查 | - | 一般 | 否 | 是 |
| 进程被 OOMKiller kill | 进程被 OOMKiller kill | 1. 检查系统资源使用情况使用 top 或 htop 命令查看系统的 CPU、内存和磁盘使用情况。确认是否存在内存泄漏或者资源竞争的问题。 2. 分析 Java 堆内存使用情况,调整 JVM 参数。 3. 增加节点内存。 | - | 严重 | 是 | 是 |
| 配置文件异常 | 配置文件异常 | 人工排查 | - | 一般 | 是 | 否 |


