操作场景
腾讯云 Elasticsearch Service 对运行中的 ES 集群,提供了多项监控指标,用以监测集群的运行情况,如存储、IO、CPU、内存使用率等。您可以根据这些指标实时了解集群服务的运行状况,针对可能存在的风险及时处理,保障集群的稳定运行。本文为您介绍通过 Elasticsearch Service 控制台查看集群监控的操作。
操作步骤
1. 登录 Elasticsearch Service 控制台,在集群列表单击集群 ID/名称,进入集群详情页。
2. 选择集群监控页,可以查看集群整体的运行情况,选择指标分组,支持拆分查看数据节点、冷数据节点、专用主节点的集群监控指标。
3. 选择节点监控页,可以查看集群内各节点的运行情况和性能指标。
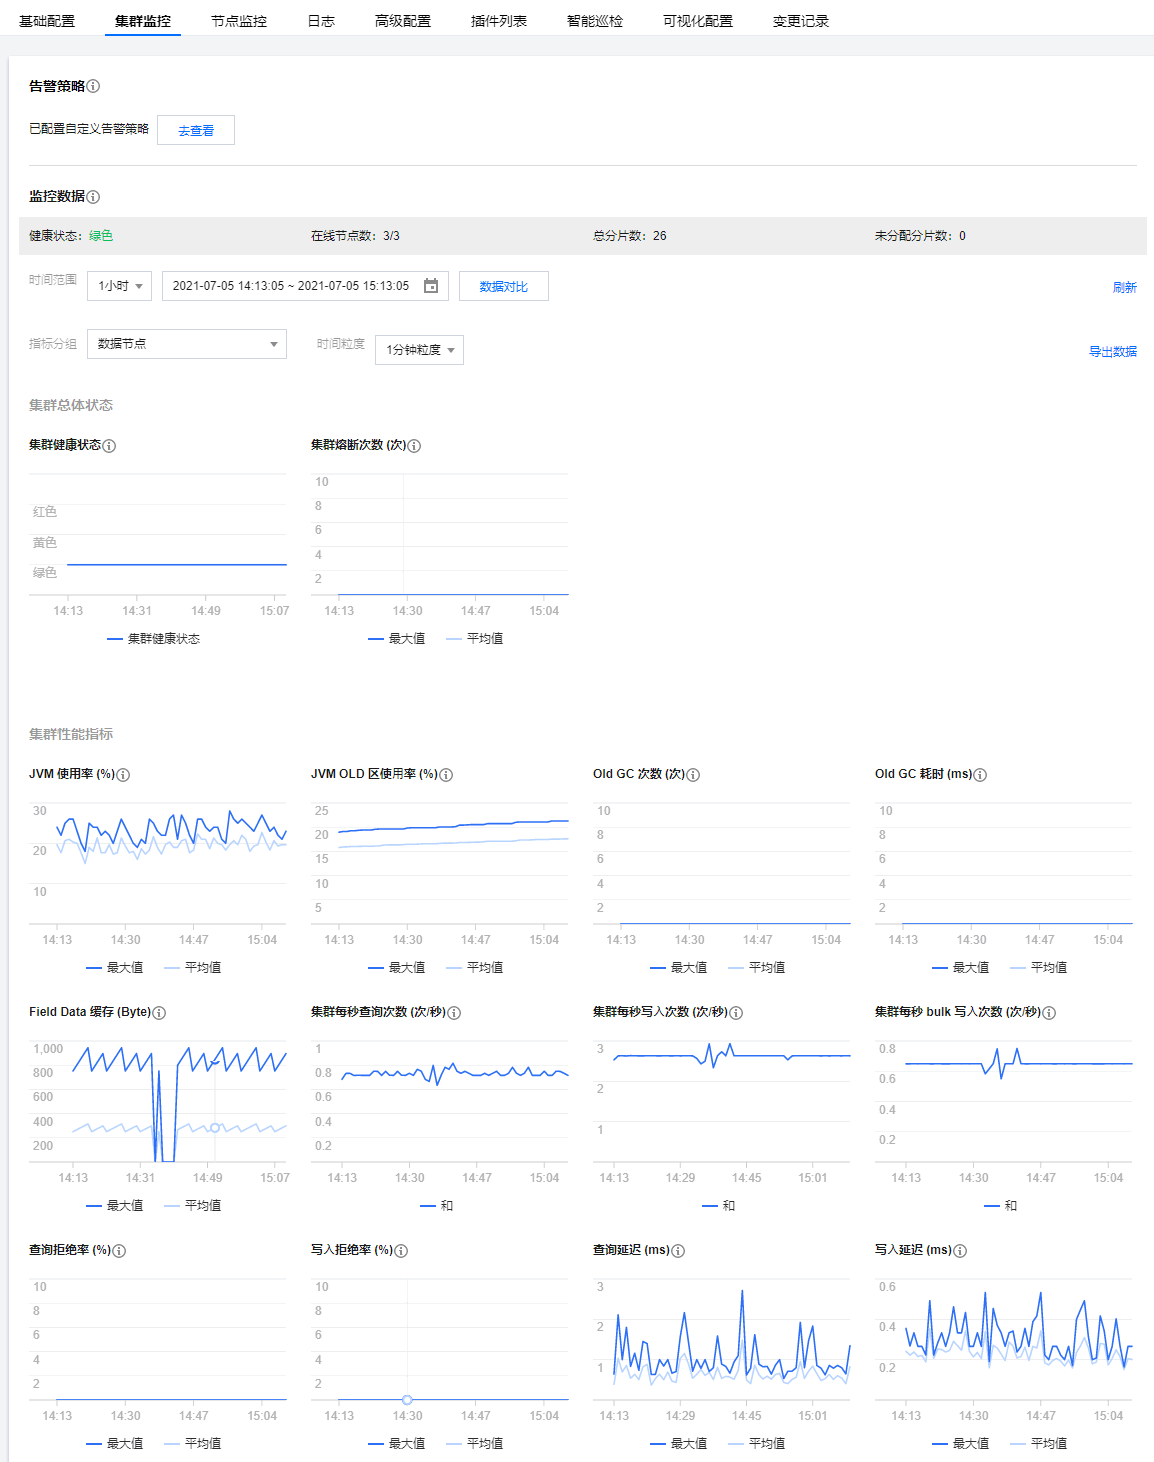
集群监控
在集群监控页,可以进行告警策略设置,同时也可以看到集群的监控数据信息。可通过选择不同的时间范围、指标分组和时间粒度查看集群总体状态和性能指标。
说明
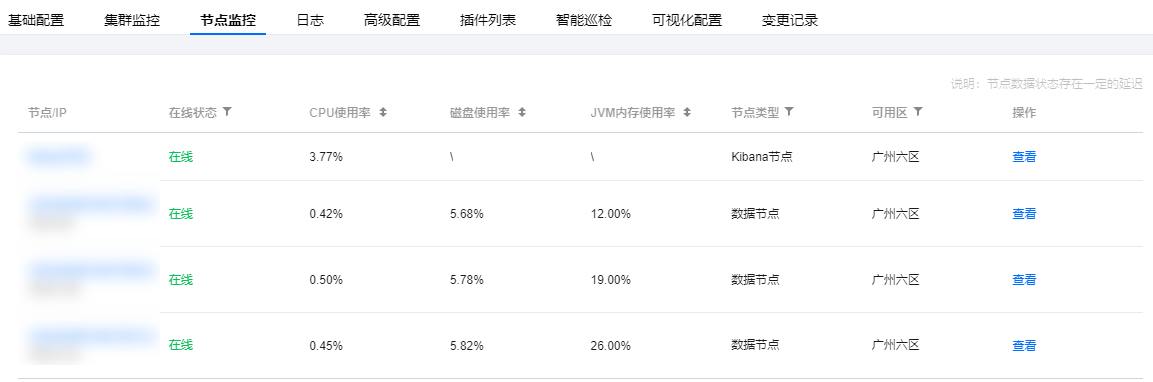
节点监控
节点列表
展示集群各个节点部分实时运行指标。
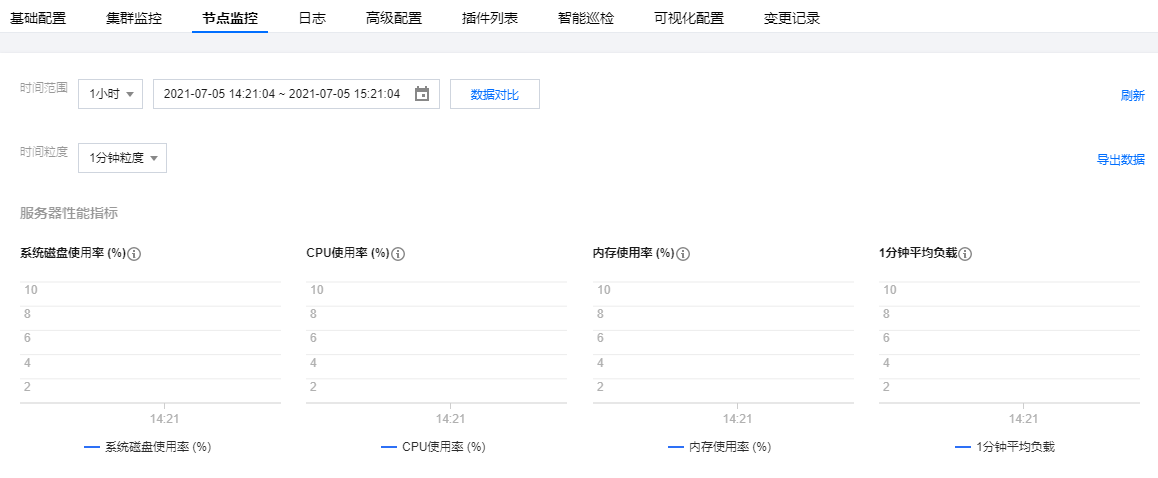
单个节点状态
提供每个节点,各项指标详细的历史运行情况。并支持导出数据到本地。
部分指标含义及说明
ES 集群一般由多个节点构成,为反映集群整体的运行情况,部分监控指标提供了两类值:平均值、最大值。
平均值表示集群所有节点该指标值的平均数。
最大值表示集群所有节点该指标的最大值。
所有指标的统计周期均为1分钟,即每1分钟对集群的指标采集1次。具体各指标含义说明如下:
监控指标 | 统计方式 | 详情 |
集群健康状态 | ES 集群健康状态:0:表示绿色,集群正常;1:表示黄色,告警,部分副本分片不可用;2:表示红色,异常,部分主分片不可用。 | green:表示所有的主分片和副本分片都可用,集群处于最健康的状态。 yellow:表示所有的主分片均可用,但部分副本分片不可用,此时搜索结果仍然是完整的。但集群的高可用性在一定程度上受到影响,数据面临较高的丢失风险。在集群健康状态变为 yellow 后,应及时调查和定位问题,并修复,防止数据丢失。 red:表示至少一个主分片以及它的全部副本均不可用。集群处于 red 状态意味着已有部分数据丢失:搜索只能返回部分数据,而分配到丢失分片上的写入请求会返回异常。在集群健康状态变为 red 后,应及时定位异常分片,并进行修复。 |
平均磁盘使用率 | 每单位统计周期内(1分钟),集群各个节点的磁盘使用率的平均值。 | 磁盘使用率过高会导致数据无法正常写入。解决方法:及时清理无用的索引。对集群进行扩容,增加单节点的磁盘容量或增加节点个数。 |
最大磁盘使用率 | 每单位统计周期内(1分钟),集群各个节点中最大磁盘使用率。 | - |
平均 JVM 内存使用率 | 每单位统计周期内(1分钟),集群各个节点的 JVM 内存使用率的平均值。 | 该值过高会导致集群节点 GC 频繁,甚至有出现 OOM。导致该值过高的原因,一般是节点上 ES 处理任务超出节点 JVM 的负载能力。您需要注意观察集群正在执行的任务,或调整集群的配置。 |
最大 JVM 内存使用率 | 每单位统计周期内(1分钟),集群各个节点中最大 JVM 内存使用率。 | - |
平均 CPU 使用率 | 每单位统计周期内(1分钟),集群各个节点的 CPU 使用率的平均值。 | 当集群各节点处理的读写任务超出节点 CPU 的负载能力时,该指标就会过高,CPU 使用率过高会导致集群节点处理能力下降,甚至宕机。您可以从以下几点解决平均 CPU 使用率过高的问题: 观察该指标是持续性较高,还是临时飙升。若是临时飙升,确定是否有临时性复杂任务正在执行。 若该指标持续较高,分析业务对集群的读写操作是否可以优化,降低读写频率,减小数据量,从而减轻节点负载。 对于节点配置无法满足业务吞吐量的情况,建议对集群节点进行纵向扩容,提高单节点的负载能力。 |
最大 CPU 使用率 | 每单位统计周期内(1分钟),集群各个节点中最大 CPU 使用率。 | - |
集群1分钟平均负载 | 集群1分钟所有节点的平均负载 load_1m,指标来源:ES 节点状态 api:_nodes/stats/os/cpu/load_average/1m。 | load_1m 过高时,建议降低集群负载或调大集群节点规格。 |
集群1分钟最大负载 | 集群1分钟所有节点的最大平均负载 load_1m。 | - |
平均写入延迟 | 写入延迟(index_latency),指单次 index 请求耗时(ms/次),集群平均写入延迟是统计周期内(1分钟)所有节点单次 index 请求耗时的平均值。 节点单次 index 请求耗时计算规则:每隔一个统计周期(1分钟)记录一次节点的两个指标,节点历史 index 总次数(_nodes/stats/indices/indexing/index_total),节点历史 index 总耗时(_nodes/stats/indices/indexing/index_time_in_millis),取相邻两次记录的差值,即一个周期内的绝对值并进行计算:index 耗时 / index 次数,得出统计周期内(1分钟)单次 index 平均耗时。 | 写入延迟,是指单个文档写入平均耗时。集群平均写入延迟,是指统计周期内,所有节点的写入用时的平均值。写入延迟过高时,建议调大节点规格或增加节点个数。 |
最大写入延迟 | 写入延迟(index_latency),指单次 index 请求耗时(ms/次),集群最大写入延迟是统计周期内(1分钟)所有节点中单次 index 请求耗时的最大值。 节点单次 index 请求耗时计算规则:见平均写入延迟。 | - |
平均查询延迟 | 查询延迟(search_latency),指单次查询请求耗时(ms/次),集群平均查询延迟是统计周期内(1分钟)所有节点单次查询请求耗时的平均值。 节点单次查询请求耗时计算规则:每隔一个统计周期(1分钟)记录一次节点的两个指标,节点历史查询总次数(_nodes/stats/indices/search/query_total),节点历史查询总耗时(_nodes/stats/indices/search/query_time_in_millis),取相邻两次记录的差值,即一个周期内的绝对值并进行计算:query 耗时 / query 次数,得出统计周期内(1分钟)单次查询平均耗时。 | 查询延迟,是指单个查询平均耗时。集群平均查询延迟,就是统计周期内,所有节点查询用时的平均值。查询延迟过高时,建议调大节点规格或增加节点个数。 |
最大查询延迟 | 查询延迟(search_latency),指单次查询请求耗时(ms/次),集群最大查询延迟是统计周期内(1分钟)所有节点中单次查询请求耗时的最大值。 节点单次查询请求耗时计算规则:见平均查询延迟。 | - |
平均每秒写入次数 | 集群所有节点接收到的每秒 index 请求次数的平均值。节点每秒 index 请求次数计算规则:每隔一个统计周期(1分钟)记录一次节点历史 index 总次数(_nodes/stats/indices/indexing/index_total),取相邻两次记录的差值,即一个周期内的绝对值并进行计算:index 次数 / 60秒,得出统计周期内每秒 index 请求次数的平均值。 | - |
平均每秒完成查询次数 | 集群所有节点接收到的每秒查询请求次数的平均值。节点每秒查询请求次数计算规则:每个统计周期(1分钟)记录一次节点历史查询总次数(_nodes/stats/indices/search/query_total),取相邻两次记录的差值,即一个周期内的绝对值并进行计算:query 次数 / 60秒,得到统计周期内每秒查询请求次数的平均值。 | - |
写入拒绝率 | 单位周期内,集群写入请求被拒绝次数 ÷ 总写入请求次数,得到的比率。具体计算规则:每隔一个统计周期采集两个指标:历史写入请求被拒绝次数(5.6.4版本:_nodes/stats/thread_pool/bulk/rejected,6.4.3及之后版本: _nodes/stats/thread_pool/write/rejected)、历史写入请求次数(5.6.4版本:_nodes/stats/thread_pool/bulk/completed,6.4.3及之后版本:_nodes/stats/thread_pool/write/completed),取相邻两次记录的差值,即一个周期内的绝对值并进行计算,写入请求拒绝次数 / 写入请求完成次数。 | 写入 QPS 过大,CPU、内存、磁盘使用率过高时,可能会造成集群写入拒绝率会增加。一般地,是集群当前配置无法满足业务写操作需求。对于节点配置过低的场景,可以通过提高节点规格或降低写入操作次数来解决。对于磁盘使用率过高的情况,可以通过扩容集群磁盘或删除无用数据来解决。 |
查询拒绝率 | 单位周期内,集群查询请求被拒绝次数 ÷ 总查询请求次数,得到的比率。具体计算规则:每隔一个统计周期采集两个指标:历史查询请求被拒绝次数(_nodes/stats/thread_pool/search/rejected)、历史查询请求次数(_nodes/stats/thread_pool/search/completed),取相邻两次记录的差值,即一个周期内的绝对值并进行计算:查询请求拒绝次数 / 查询请求完成次数。 | 写入 QPS 过大,CPU、内存使用率过高,可能会造成集群查询拒绝率上升。一般地,是集群当前配置无法满足业务读操作需求,该值过高时建议对集群调大集群节点配置,提高集群节点的处理能力。 |
集群总文档数 | 集群中的文档总数,此数字可能包括来自嵌套字段的文档。计算规则:ES 集群文档数 API:_cluster/stats/indices/docs/count,详情请参见 Cluster stats API。 | - |
自动快照备份状态 | 集群开启自动快照备份后的备份结果:0:未开启自动备份;1:自动备份正常;-1:自动备份失败。 | |
分片中最大文档数 | 集群中全部索引下分片,按文档数统计后的单个分片最大值。 | - |
集群最大分片存储量 | 集群中全部索引分片,按存储量统计后的单个分片最大值。 | - |
集群最大分片文档 delete 次数 | 集群中全部索引下分片文档数中,单个分片中被标记为已删除状态的文档数量经统计后,各个分片中的最大值。 | - |
集群最大分片文档 delete 次数占比 | 集群中全部索引下分片文档数中,单个分片中被标记为已删除状态的文档数量相较于该分片文档总数的比值,各个分片下的比值中的最大值。 | - |
活跃查询 context 数量 | 集群下全部节点统计活跃查询 context 的均值。 | - |
查询任务耗时90分位 | 每单位统计周期内,集群最大节点执行查询任务90分位时延。 | - |
写入任务耗时90分位 | 每单位统计周期内,集群最大节点执行写入任务90分位时延。 | - |


