Google Earth Engine ——数据全解析专辑(世界第 4 版网格化人口 (GPWv4) 修订版30 弧秒1公里格网)人口数量和密度数据集

Google Earth Engine ——数据全解析专辑(世界第 4 版网格化人口 (GPWv4) 修订版30 弧秒1公里格网)人口数量和密度数据集

此星光明
发布于 2024-05-24 08:53:00
发布于 2024-05-24 08:53:00
The Gridded Population of World Version 4 (GPWv4), Revision 11 models the distribution of global human population for the years 2000, 2005, 2010, 2015, and 2020 on 30 arc-second (approximately 1km) grid cells. Population is distributed to cells using proportional allocation of population from census and administrative units. Population input data are collected at the most detailed spatial resolution available from the results of the 2010 round of censuses, which occurred between 2005 and 2014. The input data are extrapolated to produce population estimates for each modeled year.
These population count grids contain estimates of the number of persons per 30 arc-second grid cell consistent with national censuses and population registers. There is one image for each modeled year.
世界第 4 版网格化人口 (GPWv4) 修订版 11 对 2000、2005、2010、2015 和 2020 年在 30 弧秒(约 1 公里)网格单元上的全球人口分布进行建模。使用人口普查和行政单位的人口比例分配将人口分配到单元格。人口输入数据是在 2010 年普查结果中可用的最详细的空间分辨率收集的,普查结果发生在 2005 年和 2014 年之间。输入数据被外推以产生每个建模年份的人口估计值。 这些人口计数网格包含与国家人口普查和人口登记一致的每 30 弧秒网格单元的人数估计值。每个建模年份有一个图像。
Dataset Availability
2000-01-01T00:00:00 - 2020-01-01T00:00:00
Dataset Provider
NASA SEDAC at the Center for International Earth Science Information Network
Collection Snippet
ee.ImageCollection("CIESIN/GPWv411/GPW_Population_Count")
Resolution
30 arc seconds
Bands Table
Name | Description | Min* | Max* |
|---|---|---|---|
population_count | The estimated number of persons per 30 arc-second grid cell. | 0 | 627597 |
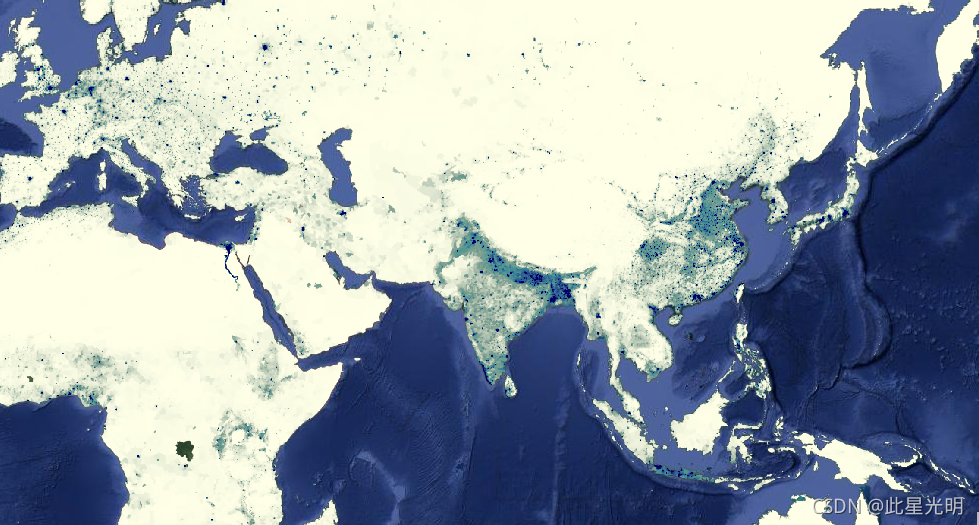
人口数量代码:
var dataset = ee.ImageCollection("CIESIN/GPWv411/GPW_Population_Count").first();
var raster = dataset.select('population_count');
var raster_vis = {
"max": 1000.0,
"palette": [
"ffffe7",
"86a192",
"509791",
"307296",
"2c4484",
"000066"
],
"min": 0.0
};
Map.setCenter(79.1, 19.81, 3);
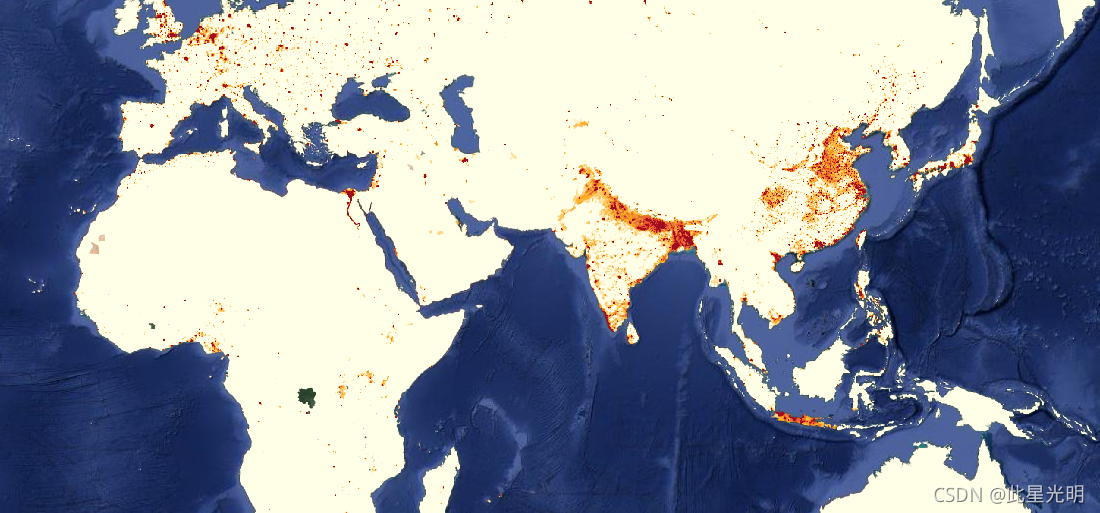
Map.addLayer(raster, raster_vis, 'population_count');人口密度代码:
var dataset = ee.ImageCollection("CIESIN/GPWv411/GPW_Population_Density").first();
var raster = dataset.select('population_density');
var raster_vis = {
  "max": 1000.0,
  "palette": [
    "ffffe7",
    "FFc869",
    "ffac1d",
    "e17735",
    "f2552c",
    "9f0c21"
  ],
  "min": 200.0
};
Map.setCenter(79.1, 19.81, 3);
Map.addLayer(raster, raster_vis, 'population_density');
数量
密度
调整后:
这些人口计数网格包含每 30 弧秒网格单元格中的人数估计值,在相对空间分布方面与国家人口普查和人口登记册一致,但进行了调整以匹配 2015 年联合国世界人口展望国家总数的修订版。每个建模年份有一个图像。
调整后的代码人口数量
var dataset = ee.ImageCollection("CIESIN/GPWv411/GPW_UNWPP-Adjusted_Population_Count").first();
var raster = dataset.select('unwpp-adjusted_population_count');
var raster_vis = {
  "max": 1000.0,
  "palette": [
    "ffffe7",
    "86a192",
    "509791",
    "307296",
    "2c4484",
    "000066"
  ],
  "min": 0.0
};
Map.setCenter(79.1, 19.81, 3);
Map.addLayer(raster, raster_vis, 'unwpp-adjusted_population_count');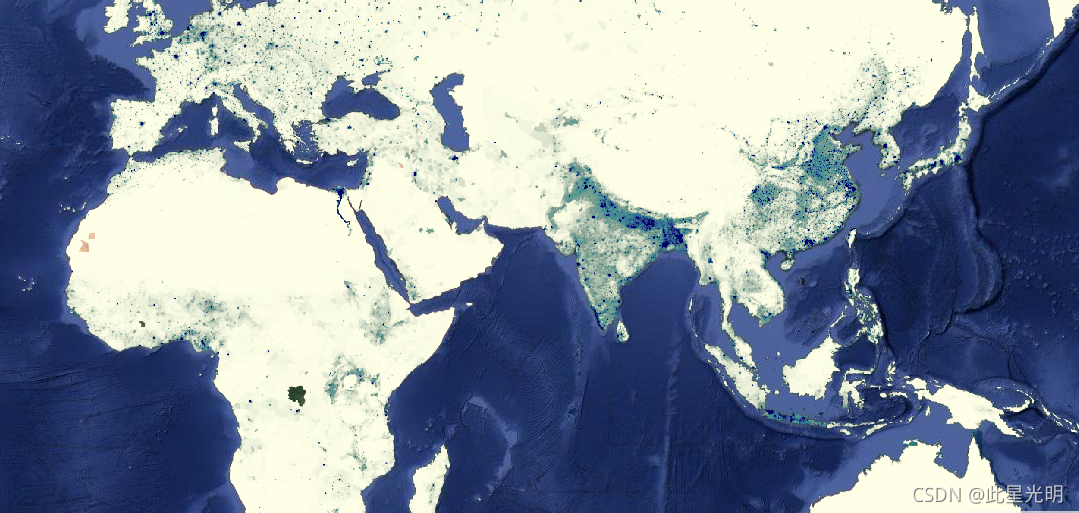
调整后人口密度:
var dataset = ee.ImageCollection("CIESIN/GPWv411/GPW_UNWPP-Adjusted_Population_Density").first();
var raster = dataset.select('unwpp-adjusted_population_density');
var raster_vis = {
  "max": 1000.0,
  "palette": [
    "ffffe7",
    "FFc869",
    "ffac1d",
    "e17735",
    "f2552c",
    "9f0c21"
  ],
  "min": 0.0
};
Map.setCenter(79.1, 19.81, 3);
Map.addLayer(raster, raster_vis, 'unwpp-adjusted_population_density');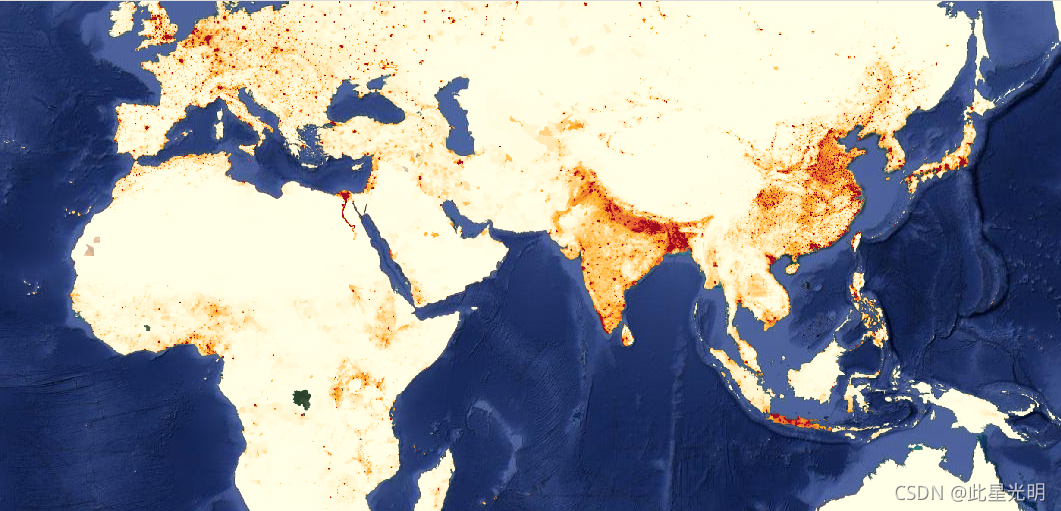
本文参与 腾讯云自媒体同步曝光计划,分享自作者个人站点/博客。
原始发表:2024-05-24,如有侵权请联系 cloudcommunity@tencent.com 删除
评论
登录后参与评论
推荐阅读
腾讯云开发者

Copyright © 2013 - 2026 Tencent Cloud. All Rights Reserved. 腾讯云 版权所有
深圳市腾讯计算机系统有限公司 ICP备案/许可证号:粤B2-20090059 ![]() 粤公网安备44030502008569号
粤公网安备44030502008569号
腾讯云计算(北京)有限责任公司 京ICP证150476号 | 京ICP备11018762号