大模型应用:CLIP 模型全维度解析:理解理论基础强化基础范例.16
原创
大模型应用:CLIP 模型全维度解析:理解理论基础强化基础范例.16
原创
未闻花名
发布于 2026-02-12 08:17:36
发布于 2026-02-12 08:17:36
一、前言
我们经常讨论到的模型大都基于大文本的模型,鲜有谈及视觉这一块,今天我们结合文本模型来梳理探讨一下视觉的模型,计算机视觉(CV)和自然语言处理(NLP)是两个相对独立的研究领域,CV 模型(如 ResNet、ViT)专注于从图像中提取视觉特征,擅长分类、检测等任务,但无法理解图像的语义文本描述;NLP 模型则聚焦于文本的语义理解,却缺乏对视觉信息的感知能力,对单一的传统视觉和文本模型都有很大的局限性。
传统的跨模态任务(如图文检索、图像字幕)通常需要针对特定任务设计专用模型,且依赖大量标注数据,泛化能力差。例如,训练一个图像分类模型需要数万张标注好的图像,换一个分类类别就需要重新标注和训练,成本极高。这种模态割裂和任务专用的模式,限制了 AI 模型的通用能力。
二、CLIP的诞生
CLIP,全称Contrastive Language-Image Pre-training,对比语言-图像预训练,在2021年由OpenAI提出,核心突破在于通过对比学习将图像和文本映射到同一个高维表征空间,让模型能够直接比较图像和文本的语义相似度。其核心思路是:利用互联网上海量的无结构化图文对(如网页中的图片和标题)进行预训练,让模型学习 “图像内容对应的文本描述” 这一通用规律,而非针对特定任务的特征。
CLIP 不再依赖人工标注的任务数据,而是从大规模的图文数据中学习通用的跨模态表征,这使得模型具备了强大的零样本迁移能力,无需针对新任务微调,仅通过文本提示即可完成新类别的识别。CLIP 重新定义了跨模态学习的范式,证明了大规模对比预训练能够实现通用的视觉 - 文本对齐。
CLIP 的零样本能力大幅降低了计算机视觉任务的落地成本:无需标注大量数据,即可快速适配新的分类场景(如商品分类、缺陷检测);同时,CLIP 也被广泛应用于图文检索、AIGC(如文生图的文本编码)、人机交互等场景,成为多模态 AI 的核心基础组件。
三、CLIP核心概念
1. 跨模态学习
跨模态学习旨在建立不同模态数据(如视觉、文本、音频)之间的语义关联,将不同模态的信息映射到统一的表征空间,使得不同模态的特征可以直接进行比较和交互。对于 CLIP 而言,核心模态是图像和文本,其目标是让语义相似的图像和文本在表征空间中距离更近,语义无关的则距离更远。
2. 对比学习
对比学习是 CLIP 的核心训练范式,属于自监督学习的一种。其核心思想是:为每个样本构建“正样本对”和 “负样本对”,通过损失函数让模型学习区分正/负样本,正样本对的表征尽可能接近,负样本对的表征尽可能远离。
在 CLIP 中,一个批次batch内的每张图像对应的文本描述是其“正样本”,批次内其他所有图像和文本都是其“负样本”。例如,批次中有 N 个图文对,对于第 i 张图像,其正样本是第 i 个文本,负样本是其余 N-1 个文本;同理,对于第 i 个文本,其正样本是第 i 张图像,负样本是其余 N-1 张图像。
3. 图文对齐的核心目标
CLIP的"对齐"并非简单的特征匹配,而是语义层面的对齐。例如,图像是“一只猫坐在沙发上”,文本是“a cat on the sofa”,即使图像的像素细节或文本的表述方式略有不同,模型也能识别出二者的语义一致性,并将其表征拉近。
这种语义对齐使得模型能够理解图像的文本语义,也能理解文本的视觉含义,从而实现“用文本描述来定义图像类别”的零样本能力。
4 零样本(Zero-Shot)推理的本质
零样本学习(Zero-Shot Learning, ZSL)指模型在未见过某类别的训练数据时,能够识别该类别的样本。CLIP 的零样本推理核心在于:将新任务的类别转换为文本提示(如 “a photo of a [类别名]”),然后将待识别图像的特征与这些文本提示的特征进行相似度计算,相似度最高的文本对应的类别即为图像的预测类别。
例如,要识别 “熊猫”,只需构造文本 “a photo of a panda”,计算图像特征与该文本特征的余弦相似度,若相似度最高,则判定为熊猫。这种方式无需为 “熊猫” 类别标注任何图像数据,仅通过文本即可定义类别,实现零样本识别。
四、CLIP 基础架构
1. 模型整体框架
CLIP 采用“双编码器”架构,由图像编码器和文本编码器两部分组成,整体流程如下:
- 1. 输入:图像 - 文本对(I, T);
- 2. 图像编码器:将图像 I 转换为固定维度的视觉特征向量 v(维度通常为 512);
- 3. 文本编码器:将文本 T 转换为固定维度的文本特征向量 t(维度与视觉特征一致);
- 4. 特征归一化:对 v 和 t 分别进行 L2 归一化,使得向量的模长为 1;
- 5. 相似度计算:计算 v 和 t 的点积(余弦相似度),衡量图文语义相似度;
- 6. 训练:通过对比损失函数优化两个编码器,让正样本对的相似度最大化,负样本对的相似度最小化。
2. 图像编码器
CLIP 提供了两种图像编码器选型,CNN(ResNet)与 Transformer(ViT)均经过适配改造:
- ResNet 系列:基于经典的 ResNet 架构,移除了最后的分类头,增加了一个投影层(Projection Head),将 ResNet 提取的视觉特征映射到固定维度的表征空间(如 512 维)。CLIP 对 ResNet 做了优化,如使用更大的卷积核、调整池化方式,提升特征提取能力。
- Vision Transformer(ViT)系列:将图像分割为固定大小的补丁(Patch),转换为序列后输入 Transformer 编码器,最后通过 cls token 提取全局特征,再经投影层映射到统一表征空间。ViT 版本的 CLIP 在大尺度数据上表现更优,是目前更常用的选型(如 ViT-B/32、ViT-L/14)。
3. 文本编码器
CLIP 的文本编码器基于简化版的 Transformer Decoder仅保留编码器结构,针对短文本(图文对的文本通常较短)做了优化:
- 1. 文本预处理:使用 OpenAI 的 Byte-level BPE 分词器将文本转换为 token,添加特殊 token(<|startoftext|> 和 <|endoftext|>)标识文本起止;
- 2. 位置编码:使用可学习的位置编码,而非正弦位置编码;
- 3. 编码过程:输入 token 序列经嵌入层后,通过多层 Transformer 编码器,最后取 <|endoftext|> token 对应的特征作为文本的全局表征,再经投影层映射到 512 维空间。
文本编码器的输出维度与图像编码器完全一致,确保二者的特征可以直接计算相似度。
五、CLIP 重点逻辑
1. 批量对比学习的实现逻辑
CLIP 的对比学习依赖 “批次内负样本”,批次大小(batch size)是影响训练效果的关键参数:批次越大,负样本越多,模型学习的对比信号越充分。OpenAI 的 CLIP 预训练使用了 32768 的超大批次,结合分布式训练实现。
批量对比的核心逻辑:
- 1. 每个批次包含 N 个独立的图文对,无重复;
- 2. 对每个图像,负样本是批次内所有其他文本(共 N-1 个);
- 3. 对每个文本,负样本是批次内所有其他图像(共 N-1 个);
- 4. 损失函数通过 softmax 对批次内的相似度进行归一化,让模型聚焦于正样本。
这种方式无需额外构造负样本,仅通过批次内的样本即可实现对比学习,大幅降低了训练成本。
2. 零样本分类的核心原理
CLIP 的零样本分类流程可概括为 “文本提示工程 + 相似度匹配”,具体步骤:
- 1. 构造类别文本提示模板:例如 “a photo of a {class}”,将待分类的类别(如 cat、dog、bird)代入模板,生成多个文本提示(可使用多个模板提升鲁棒性);
- 2. 文本编码:将所有类别对应的文本提示输入文本编码器,得到文本特征矩阵;
- 3. 图像编码:将待分类图像输入图像编码器,得到图像特征向量;
- 4. 相似度计算:计算图像特征与每个类别文本特征的余弦相似度;
- 5. 分类决策:取相似度最高的文本对应的类别作为预测结果。
例如,分类类别为 “猫、狗、汽车”,构造文本提示:
- "a photo of a cat"
- "a photo of a dog"
- "a photo of a car"
计算图像特征与这三个文本特征的相似度,若 “a photo of a cat” 的相似度最高,则预测为猫。
CLIP 的零样本能力本质是 “将分类任务转换为图文相似度匹配任务”,利用预训练学到的图文语义对齐能力,无需微调即可适配新类别。
六、CLIP 示例解析
1. 示例:图文相似度计算
以下示例实现 “输入一张图像和多个文本,计算图像与每个文本的语义相似度”,计算机环境配置我们选择的是ViT-B/32模型并指定在CPU上运行,分别通过“一只猫”、“一只狗”、“一只趴在沙发上的猫”来体现相似度。
import torch
import clip
from PIL import Image
import matplotlib.pyplot as plt
# 1. 加载模型和预处理函数
# 可选模型:ViT-B/32, ViT-B/16, ViT-L/14, RN50, RN101等
device = "cuda" if torch.cuda.is_available() else "cpu"
model, preprocess = clip.load("ViT-B/32", device=device)
# 2. 加载并预处理图像
# 替换为自己的图像路径
# image_path = "cat.jpg"
# image_path = "dog.jpg"
image_path = "cat2.jpg"
image = preprocess(Image.open(image_path)).unsqueeze(0).to(device)
# 3. 定义待匹配的文本列表
texts = [
"a photo of a cat",
"a photo of a dog",
"a photo of a bird",
"a cat sitting on the sofa"
]
# 文本预处理
text = clip.tokenize(texts).to(device)
# 4. 模型推理:提取特征并计算相似度
with torch.no_grad():
# 提取图像和文本特征
image_features = model.encode_image(image)
text_features = model.encode_text(text)
# L2归一化(CLIP模型内部已做归一化,此处可省略,但显式归一化更稳妥)
image_features /= image_features.norm(dim=-1, keepdim=True)
text_features /= text_features.norm(dim=-1, keepdim=True)
# 计算相似度(图像特征与每个文本特征的点积)
similarity = (100.0 * image_features @ text_features.T).softmax(dim=-1)
# 5. 输出结果
print("图像与各文本的相似度:")
for i, txt in enumerate(texts):
print(f"{txt}: {similarity[0][i].item():.4f}")
# 6. 可视化图像和相似度结果
plt.figure(figsize=(10, 5))
# 显示图像
plt.subplot(1, 2, 1)
plt.imshow(Image.open(image_path))
plt.axis("off")
plt.title("Input Image")
# 显示相似度柱状图
plt.subplot(1, 2, 2)
plt.bar(texts, similarity[0].cpu().numpy())
plt.xticks(rotation=45, ha="right")
plt.ylabel("Similarity")
plt.title("Text Similarity")
plt.tight_layout()
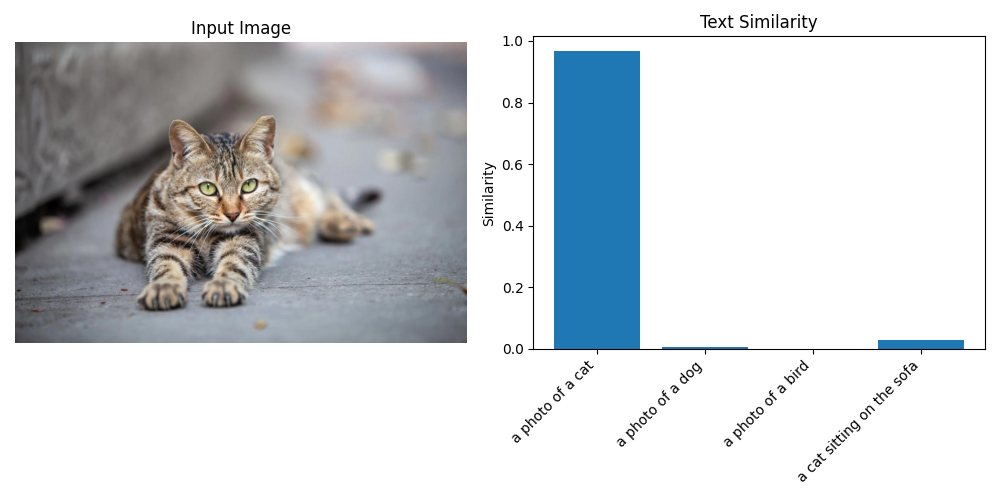
plt.show()原图图像:cat.jpg
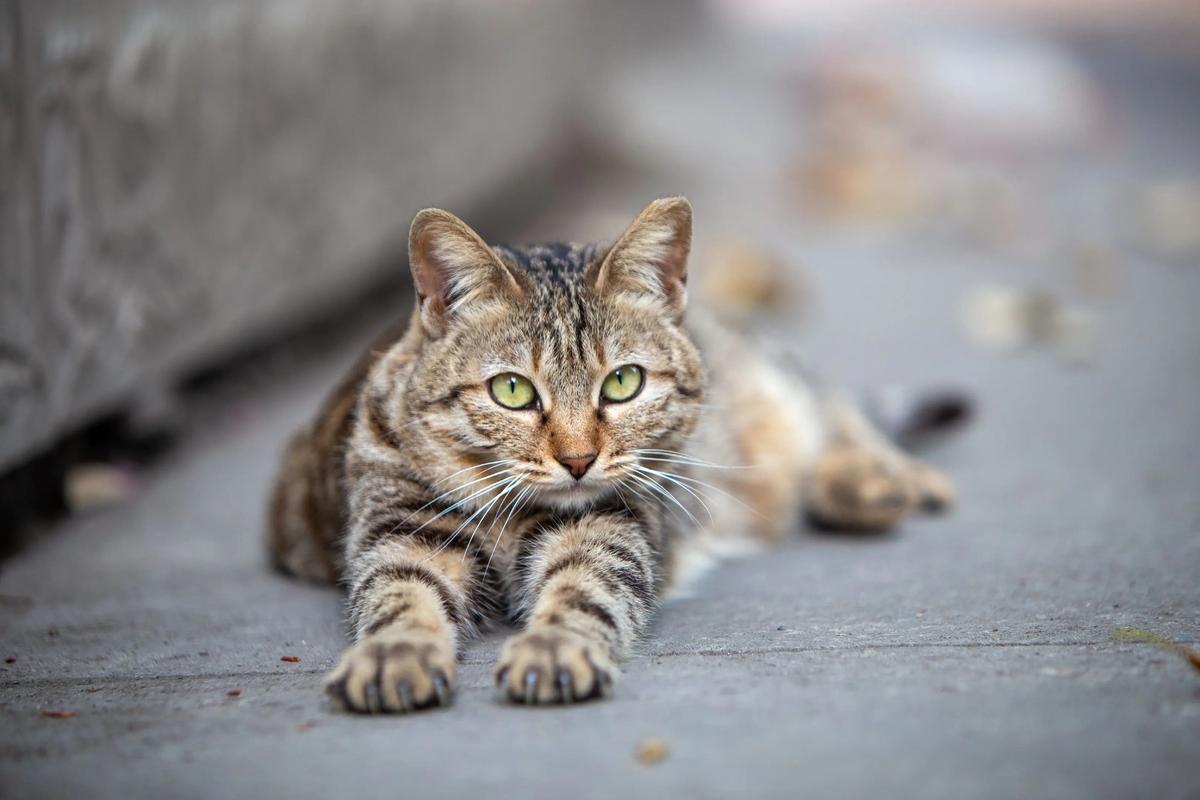
图像的识别结果匹配度结果输出:
图像与各文本的相似度: a photo of a cat: 0.9666 a photo of a dog: 0.0048 a photo of a bird: 0.0005 a cat sitting on the sofa: 0.0281
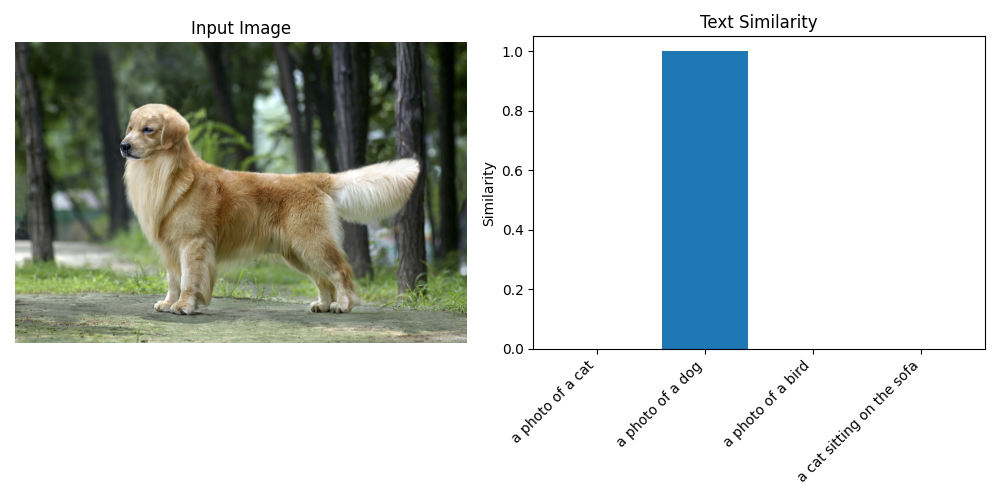
原图图像:dog.jpg
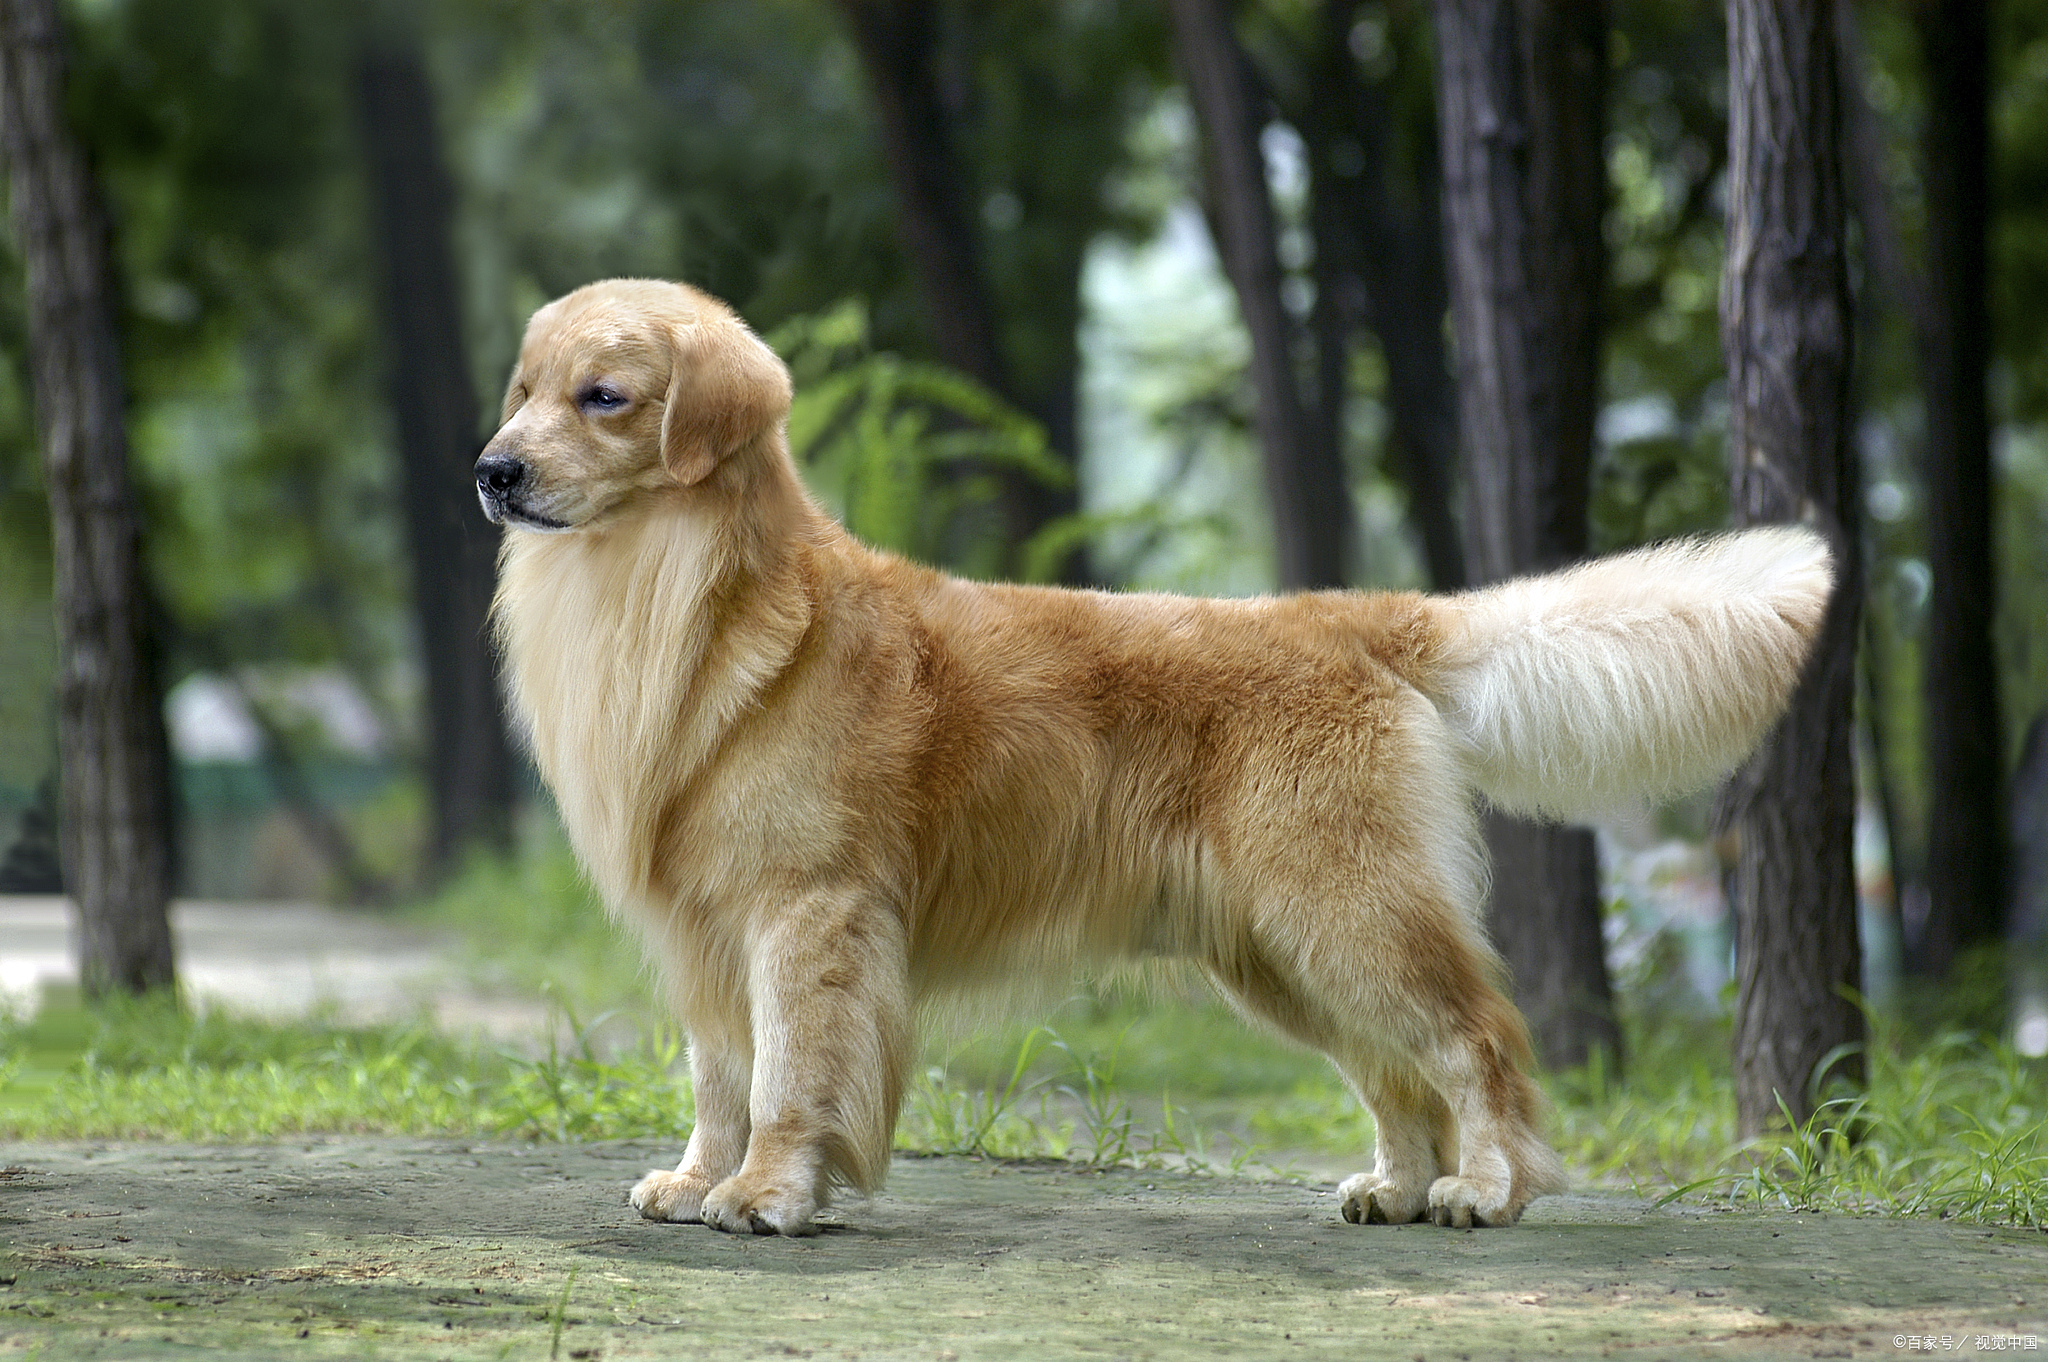
图像的识别结果匹配度结果输出:
图像与各文本的相似度: a photo of a cat: 0.0005 a photo of a dog: 0.9994 a photo of a bird: 0.0001 a cat sitting on the sofa: 0.0000
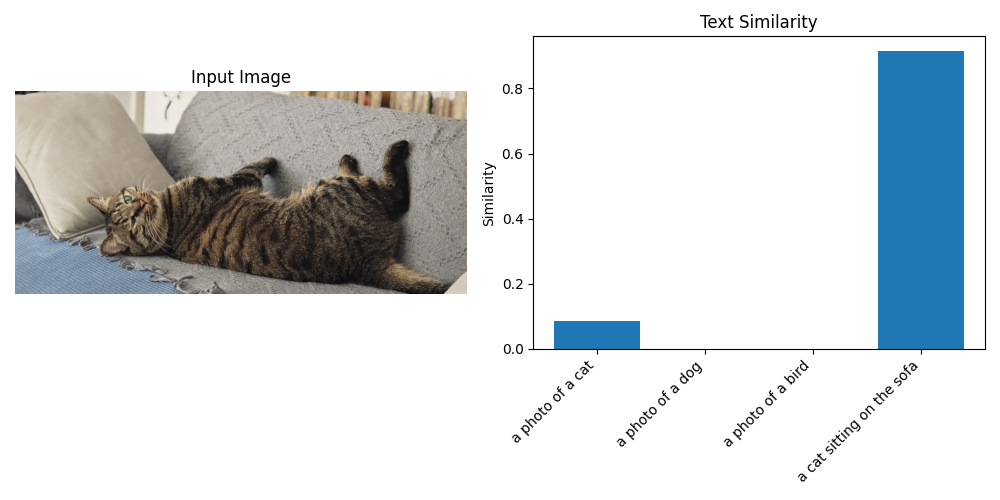
原图图像:cat2.jpg

图像的识别结果匹配度结果输出:
图像与各文本的相似度: a photo of a cat: 0.0845 a photo of a dog: 0.0008 a photo of a bird: 0.0002 a cat sitting on the sofa: 0.9145
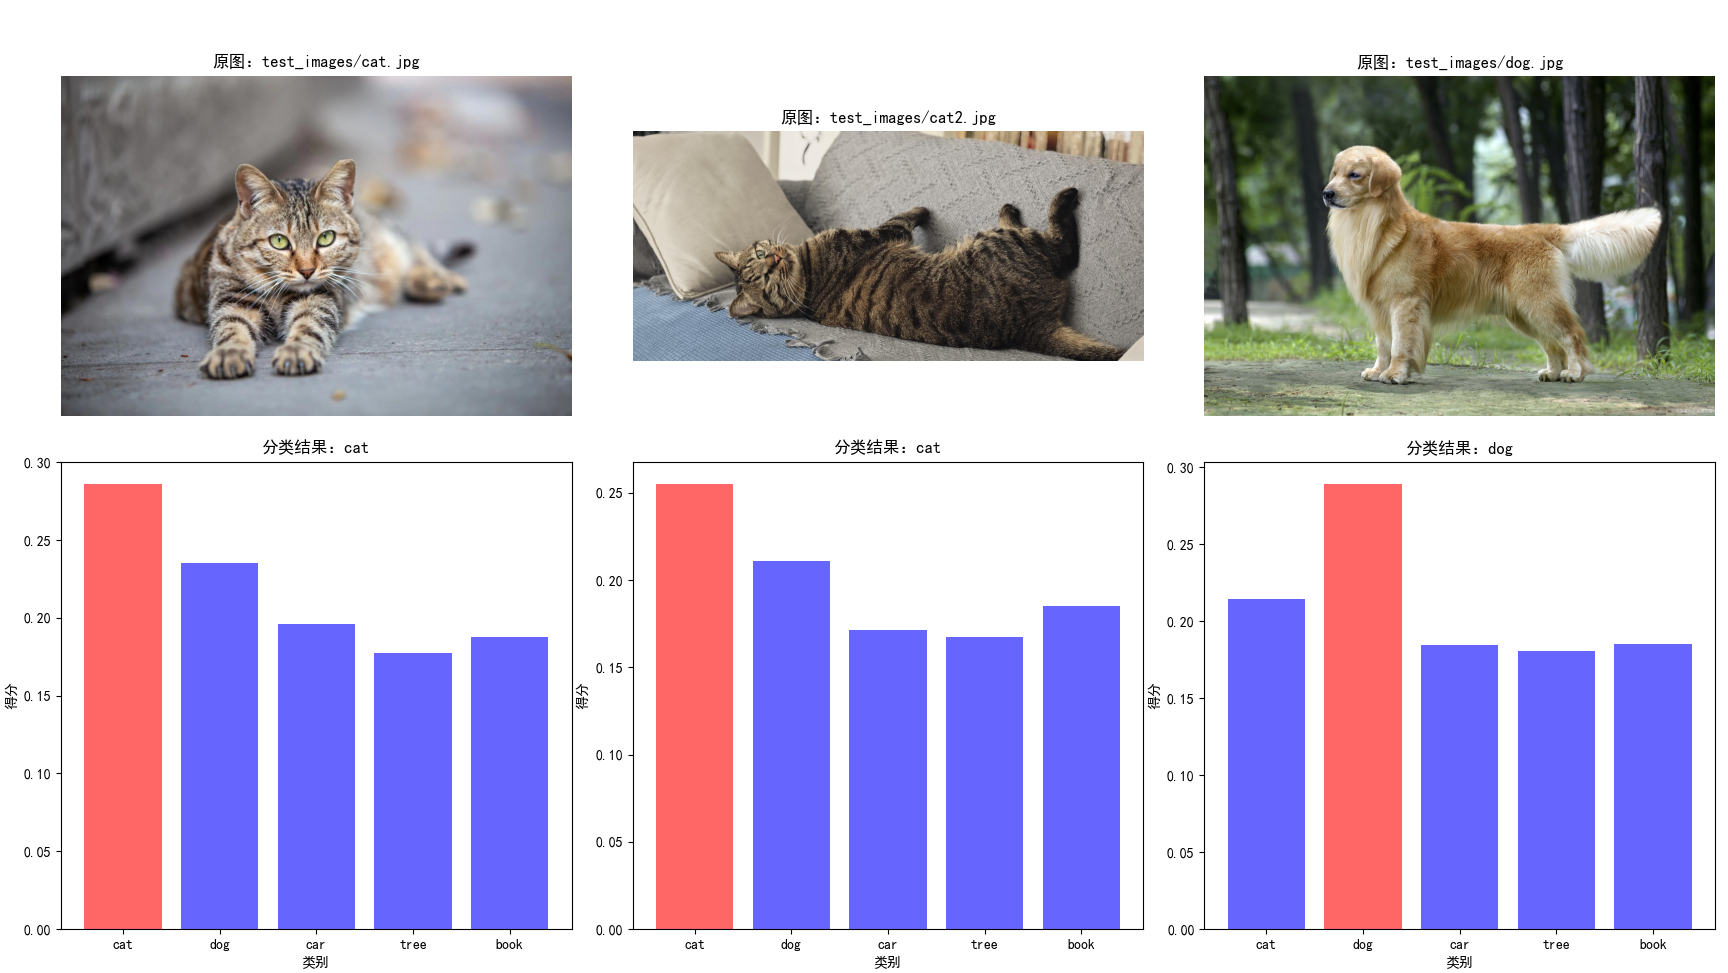
2. 示例:零样本图像分类
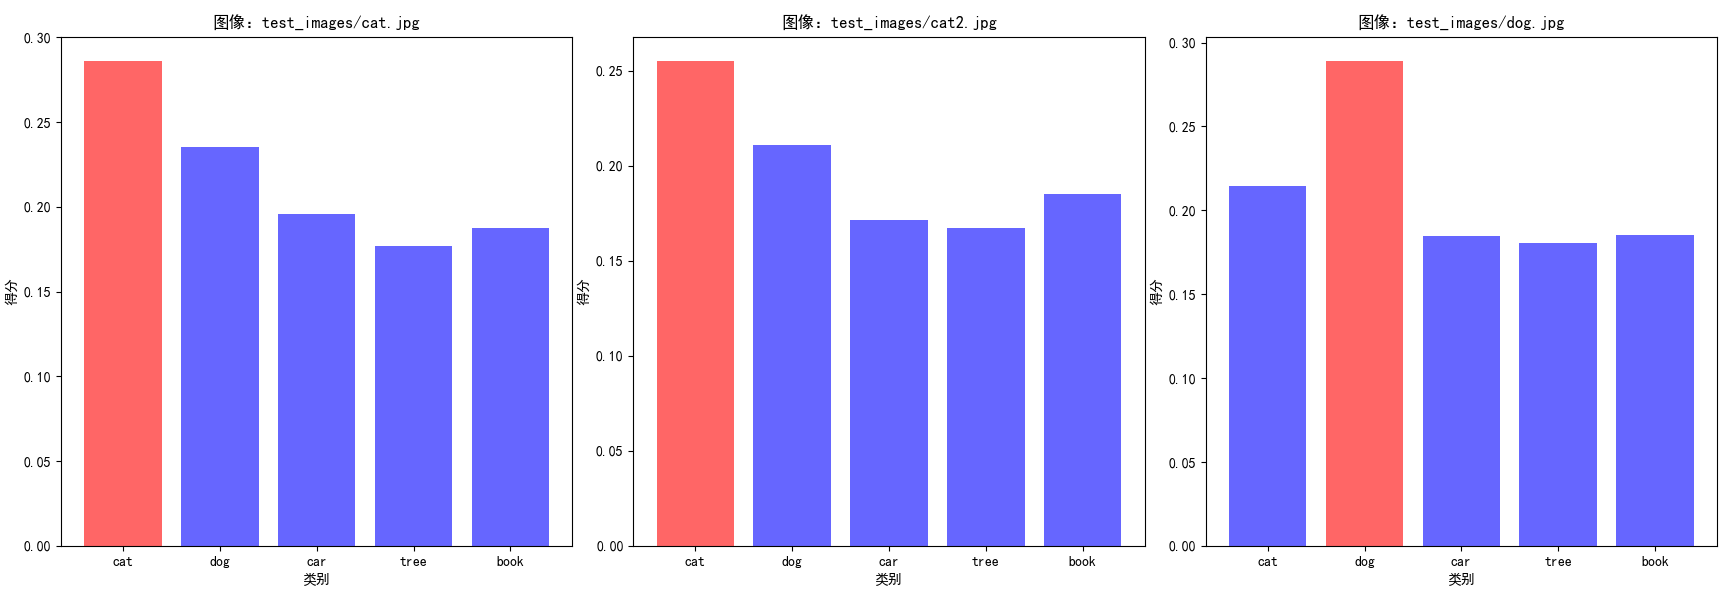
以下示例实现 “基于 CLIP 的零样本图像分类”,支持自定义分类类别,图片以上个示例中的图片为主,统一放置在test_images目录下,会根据 ["cat", "dog", "car", "tree", "book"] 这几个类别判断,每张图片属于每个属性的概览是多少,匹配最符合的那个类型。
import torch
import clip
from PIL import Image
import os
import matplotlib.pyplot as plt

# 设置中文字体
plt.rcParams['font.sans-serif'] = ['SimHei', 'Arial Unicode MS']
plt.rcParams['axes.unicode_minus'] = False

# 1. 初始化模型
device = "cuda" if torch.cuda.is_available() else "cpu"
model, preprocess = clip.load("ViT-B/32", device=device)

# 2. 定义分类类别和提示模板
# 自定义分类类别
categories = ["cat", "dog", "car", "tree", "book"]
# 提示模板(可使用多个模板提升鲁棒性)
templates = [
    "a photo of a {}",
    "a picture of a {}",
    "an image of a {}"
]

# 3. 生成所有类别对应的文本提示
text_prompts = []
for category in categories:
    for template in templates:
        text_prompts.append(template.format(category))

# 4. 加载并预处理待分类图像
# 批量处理示例:遍历文件夹中的图像
image_dir = "test_images/"
image_paths = [os.path.join(image_dir, f) for f in os.listdir(image_dir) if f.endswith((".jpg", ".png"))]
print(image_paths)

# 5. 批量推理
with torch.no_grad():
    # 编码文本提示
    text_tokens = clip.tokenize(text_prompts).to(device)
    text_features = model.encode_text(text_tokens)
    text_features /= text_features.norm(dim=-1, keepdim=True)

    # 存储所有图像的结果
    all_results = []

    # 对每张图像进行分类
    for img_path in image_paths:
        # 预处理图像
        image = preprocess(Image.open(img_path)).unsqueeze(0).to(device)
        # 编码图像
        image_features = model.encode_image(image)
        image_features /= image_features.norm(dim=-1, keepdim=True)

        # 计算图像与每个文本提示的相似度
        similarity = image_features @ text_features.T

        # 按类别聚合相似度(多个模板取平均)
        category_scores = []
        for i in range(len(categories)):
            # 每个类别对应len(templates)个文本提示
            start = i * len(templates)
            end = start + len(templates)
            avg_score = similarity[:, start:end].mean(dim=-1)
            category_scores.append(avg_score.item())

        # 预测类别(取分数最高的)
        pred_idx = torch.argmax(torch.tensor(category_scores)).item()
        pred_category = categories[pred_idx]

        # 输出结果
        print(f"图像:{img_path}")
        print(f"分类结果:{pred_category}")
        print(f"各类别得分:{dict(zip(categories, category_scores))}")
        print("-" * 50)

        # 保存结果
        all_results.append({
            "image_path": img_path,
            "category_scores": category_scores,
            "pred_category": pred_category
        })

    # 绘制分区块的条形图和原图
    fig, axes = plt.subplots(2, 3, figsize=(20, 12))
    for idx, result in enumerate(all_results[:3]):  # 仅显示前三张图像的结果
        # 显示原图
        img_ax = axes[0, idx]
        img = Image.open(result["image_path"])
        img_ax.imshow(img)
        img_ax.axis("off")
        img_ax.set_title(f"原图:{result['image_path']}")

        # 显示条形图
        bar_ax = axes[1, idx]
        # 为每个类别设置颜色,最高分标记为红色
        colors = ["blue" if score != max(result["category_scores"]) else "red" for score in result["category_scores"]]
        bar_ax.bar(categories, result["category_scores"], color=colors, alpha=0.6)
        bar_ax.set_title(f"分类结果:{result['pred_category']}")
        bar_ax.set_xlabel("类别")
        bar_ax.set_ylabel("得分")

    plt.tight_layout()
    plt.show()
图像的识别结果匹配度结果输出:
['test_images/cat.jpg', 'test_images/cat2.jpg', 'test_images/dog.jpg'] 图像:test_images/cat.jpg 分类结果:cat 各类别得分:{'cat': 0.285944402217865, 'dog': 0.2351067066192627, 'car': 0.19606192409992218, 'tree': 0.177148699760437, 'book': 0.1877281665802002} -------------------------------------------------- 图像:test_images/cat2.jpg 分类结果:cat 各类别得分:{'cat': 0.25495773553848267, 'dog': 0.21104760468006134, 'car': 0.1713184267282486, 'tree': 0.16746394336223602, 'book': 0.18521058559417725} -------------------------------------------------- 图像:test_images/dog.jpg 分类结果:dog 各类别得分:{'cat': 0.21453171968460083, 'dog': 0.2888471782207489, 'car': 0.18455737829208374, 'tree': 0.1804695874452591, 'book': 0.18529771268367767} --------------------------------------------------
代码解析与关键参数说明:
- 模型加载:clip.load("ViT-B/32", device=device) 加载预训练模型,ViT-B/32是平衡速度和性能的首选,若追求更高精度可选择ViT-L/14,但需更多显存;
- 预处理函数:preprocess是 CLIP 内置的图像预处理函数,包含 Resize、CenterCrop、ToTensor、Normalize 等步骤,严格匹配预训练时的图像处理方式,不可修改;
- 文本分词:clip.tokenize()是 CLIP 专用的文本分词器,需使用该函数处理文本,否则会导致特征不匹配;
- 特征归一化:CLIP 模型的encode_image和encode_text输出已做 L2 归一化,但若手动调整特征(如拼接、加权),需重新归一化;
- 温度系数:在相似度计算时,可乘以温度系数(如 1/0.07)放大相似度差异,提升分类稳定性;
- 提示模板:使用多个模板(如 "a photo of a {}"、"a picture of a {}")并取平均,可显著提升零样本分类准确率。
3. 统计:零样本分类比例分析
以下示例对批量处理的图片做一个简单的分类报告,由于样本数量极少,统计的指标比较简单,包括各类别平均置信度、图像宽高比例分布、各类别平均相似度得分等,根据时机需要可以调整统计指标。
import torch
import clip
from PIL import Image
import os
import numpy as np
import matplotlib.pyplot as plt
import pandas as pd
from matplotlib.font_manager import FontProperties  # 解决中文显示问题

# 解决matplotlib中文显示问题(可选,根据系统调整)
plt.rcParams["font.sans-serif"] = ["SimHei"]  # 中文黑体
plt.rcParams["axes.unicode_minus"] = False    # 正常显示负号

def get_image_aspect_ratio(image_path):
    """
    计算图像宽高比,返回详细比例信息
    :param image_path: 图像路径
    :return: 包含分辨率、宽高比、比例类型的字典
    """
    try:
        with Image.open(image_path) as img:
            width, height = img.size
            # 计算最简整数比
            gcd_val = np.gcd(width, height)
            ratio_w = width // gcd_val
            ratio_h = height // gcd_val
            aspect_ratio = f"{ratio_w}:{ratio_h}"

            # 定义常见比例类型
            ratio_type = "其他"
            if (ratio_w, ratio_h) == (1, 1):
                ratio_type = "正方形 (1:1)"
            elif (ratio_w, ratio_h) == (4, 3):
                ratio_type = "标准屏 (4:3)"
            elif (ratio_w, ratio_h) == (16, 9):
                ratio_type = "宽屏 (16:9)"
            elif (ratio_w, ratio_h) == (3, 2):
                ratio_type = "照片 (3:2)"

            return {
                "path": img_path,
                "width": width,
                "height": height,
                "aspect_ratio": aspect_ratio,
                "ratio_type": ratio_type,
                "ratio_value": width / height  # 宽高比值
            }
    except Exception as e:
        print(f"计算{image_path}比例失败:{e}")
        return None

# 1. 初始化模型
device = "cuda" if torch.cuda.is_available() else "cpu"
model, preprocess = clip.load("ViT-B/32", device=device)
print(f"使用设备:{device}")

# 2. 定义分类类别和提示模板
categories = ["cat", "dog", "car", "tree", "book"]
templates = [
    "a photo of a {}",
    "a picture of a {}",
    "an image of a {}"
]

# 3. 生成所有类别对应的文本提示
text_prompts = []
for category in categories:
    for template in templates:
        text_prompts.append(template.format(category))

# 4. 加载并预处理待分类图像
image_dir = "test_images/"
if not os.path.exists(image_dir):
    os.makedirs(image_dir)
    print(f"创建空文件夹:{image_dir},请放入测试图像后重新运行")
    exit()

image_paths = [os.path.join(image_dir, f) for f in os.listdir(image_dir)
               if f.lower().endswith((".jpg", ".png", ".jpeg"))]

if not image_paths:
    print(f"{image_dir} 中未找到jpg/png/jpeg格式图像")
    exit()

print(f"找到{len(image_paths)}张图像:")
for path in image_paths:
    print(f" - {path}")

# 5. 批量推理 + 数据收集
# 存储所有结果的列表
all_results = []
# 比例统计字典
ratio_stats = {
    "正方形 (1:1)": 0,
    "标准屏 (4:3)": 0,
    "宽屏 (16:9)": 0,
    "照片 (3:2)": 0,
    "其他": 0
}

with torch.no_grad():
    # 编码文本提示
    text_tokens = clip.tokenize(text_prompts).to(device)
    text_features = model.encode_text(text_tokens)
    text_features /= text_features.norm(dim=-1, keepdim=True)

    # 对每张图像进行分类
    for img_path in image_paths:
        # 计算图像比例
        ratio_info = get_image_aspect_ratio(img_path)
        if not ratio_info:
            continue

        # 更新比例统计
        ratio_stats[ratio_info["ratio_type"]] += 1

        # 预处理图像
        image = preprocess(Image.open(img_path)).unsqueeze(0).to(device)
        # 编码图像
        image_features = model.encode_image(image)
        image_features /= image_features.norm(dim=-1, keepdim=True)

        # 计算相似度
        similarity = image_features @ text_features.T

        # 按类别聚合相似度(多个模板取平均)
        category_scores = []
        for i in range(len(categories)):
            start = i * len(templates)
            end = start + len(templates)
            avg_score = similarity[:, start:end].mean(dim=-1)
            category_scores.append(avg_score.item())

        # 预测类别
        pred_idx = torch.argmax(torch.tensor(category_scores)).item()
        pred_category = categories[pred_idx]

        # 收集结果
        result = {
            "image_name": os.path.basename(img_path),
            "width": ratio_info["width"],
            "height": ratio_info["height"],
            "aspect_ratio": ratio_info["aspect_ratio"],
            "ratio_type": ratio_info["ratio_type"],
            "pred_category": pred_category,
            "scores": dict(zip(categories, category_scores)),
            "max_score": max(category_scores)
        }
        all_results.append(result)

        # 输出结果
        print(f"\n图像:{img_path}")
        print(f"分辨率:{ratio_info['width']}×{ratio_info['height']} | 比例:{ratio_info['aspect_ratio']}")
        print(f"分类结果:{pred_category} (置信度:{result['max_score']:.4f})")
        print("各类别得分:")
        for cat, score in result["scores"].items():
            print(f"  - {cat}: {score:.4f}")
        print("-" * 80)

# 6. 生成可视化图表
fig, ((ax1, ax2), (ax3, ax4)) = plt.subplots(2, 2, figsize=(16, 12))
fig.suptitle("CLIP零样本分类 + 图像比例分析报告", fontsize=16, fontweight="bold")

# 子图1:图像比例分布(饼图)
ratio_labels = list(ratio_stats.keys())
ratio_counts = [ratio_stats[label] for label in ratio_labels]
# 过滤掉数量为0的类别
ratio_labels_filtered = [l for l, c in zip(ratio_labels, ratio_counts) if c > 0]
ratio_counts_filtered = [c for c in ratio_counts if c > 0]

ax1.pie(
    ratio_counts_filtered,
    labels=ratio_labels_filtered,
    autopct="%1.1f%%",
    startangle=90,
    colors=["#FF6B6B", "#4ECDC4", "#45B7D1", "#96CEB4", "#FFEAA7"]
)
ax1.set_title("图像比例分布", fontsize=14, pad=20)

# 子图2:分类结果分布(柱状图)
if all_results:
    pred_categories = [r["pred_category"] for r in all_results]
    cat_count = pd.Series(pred_categories).value_counts()
    bars = ax2.bar(
        cat_count.index,
        cat_count.values,
        color=["#3498DB", "#E74C3C", "#2ECC71", "#F39C12", "#9B59B6"]
    )
    ax2.set_title("分类结果分布", fontsize=14, pad=20)
    ax2.set_xlabel("类别", fontsize=12)
    ax2.set_ylabel("数量", fontsize=12)
    # 为柱状图添加数值标签
    for bar in bars:
        height = bar.get_height()
        ax2.text(
            bar.get_x() + bar.get_width()/2.,
            height + 0.05,
            f"{int(height)}",
            ha="center",
            va="bottom",
            fontsize=11
        )

# 子图3:各类别平均置信度(柱状图)
if all_results:
    cat_avg_scores = {}
    for cat in categories:
        scores = [r["scores"][cat] for r in all_results]
        cat_avg_scores[cat] = np.mean(scores)

    bars = ax3.bar(
        list(cat_avg_scores.keys()),
        list(cat_avg_scores.values()),
        color=["#8E44AD", "#1ABC9C", "#F1C40F", "#E67E22", "#34495E"]
    )
    ax3.set_title("各类别平均置信度", fontsize=14, pad=20)
    ax3.set_xlabel("类别", fontsize=12)
    ax3.set_ylabel("平均相似度得分", fontsize=12)
    # 添加数值标签
    for bar in bars:
        height = bar.get_height()
        ax3.text(
            bar.get_x() + bar.get_width()/2.,
            height + 0.01,
            f"{height:.3f}",
            ha="center",
            va="bottom",
            fontsize=10
        )

# 子图4:宽高比值分布(直方图)
if all_results:
    ratio_values = [r["width"]/r["height"] for r in all_results]
    ax4.hist(
        ratio_values,
        bins=8,
        color="#74B9FF",
        edgecolor="#2C3E50",
        alpha=0.7
    )
    ax4.set_title("图像宽高比值分布", fontsize=14, pad=20)
    ax4.set_xlabel("宽/高比值", fontsize=12)
    ax4.set_ylabel("数量", fontsize=12)
    # 添加均值线
    mean_ratio = np.mean(ratio_values)
    ax4.axvline(mean_ratio, color="red", linestyle="--", linewidth=2, label=f"均值:{mean_ratio:.2f}")
    ax4.legend()

# 调整布局并保存图表
plt.tight_layout()
plt.savefig("clip_classification_ratio_analysis.png", dpi=150, bbox_inches="tight")
plt.show()

# 7. 导出结果到CSV(可选)
if all_results:
    # 整理CSV数据格式
    csv_data = []
    for res in all_results:
        row = {
            "图像名称": res["image_name"],
            "宽度": res["width"],
            "高度": res["height"],
            "宽高比": res["aspect_ratio"],
            "比例类型": res["ratio_type"],
            "预测类别": res["pred_category"],
            "最高置信度": res["max_score"]
        }
        # 添加各类别得分
        for cat in categories:
            row[f"{cat}_得分"] = res["scores"][cat]
        csv_data.append(row)

    # 保存CSV
    csv_path = "clip_classification_results.csv"
    pd.DataFrame(csv_data).to_csv(csv_path, index=False, encoding="utf-8-sig")
    print(f"\n结果已导出到:{csv_path}")

# 8. 输出统计总结
print("\n=== 统计总结 ===")
print(f"处理图像总数:{len(all_results)}")
print("图像比例统计:")
for ratio_type, count in ratio_stats.items():
    if count > 0:
        print(f"  - {ratio_type}: {count}张 ({count/len(all_results)*100:.1f}%)")

print("分类结果统计:")
if all_results:
    pred_categories = [r["pred_category"] for r in all_results]
    for cat in categories:
        count = pred_categories.count(cat)
        if count > 0:
            print(f"  - {cat}: {count}张 ({count/len(all_results)*100:.1f}%)")
图像的识别结果匹配度结果输出:
使用设备:cpu 找到3张图像: - test_images/cat.jpg - test_images/cat2.jpg - test_images/dog.jpg 图像:test_images/cat.jpg 分辨率:1200×800 | 比例:3:2 分类结果:cat (置信度:0.2859) 各类别得分: - cat: 0.2859 - dog: 0.2351 - car: 0.1961 - tree: 0.1771 - book: 0.1877 -------------------------------------------------------------------------------- 图像:test_images/cat2.jpg 分辨率:4080×1836 | 比例:20:9 分类结果:cat (置信度:0.2550) 各类别得分: - cat: 0.2550 - dog: 0.2110 - car: 0.1713 - tree: 0.1675 - book: 0.1852 -------------------------------------------------------------------------------- 图像:test_images/dog.jpg 分辨率:2048×1362 | 比例:1024:681 分类结果:dog (置信度:0.2888) 各类别得分: - cat: 0.2145 - dog: 0.2888 - car: 0.1846 - tree: 0.1805 - book: 0.1853 -------------------------------------------------------------------------------- 结果已导出到:clip_classification_results.csv === 统计总结 === 处理图像总数:3 图像比例统计: - 照片 (3:2): 1张 (33.3%) - 其他: 2张 (66.7%) 分类结果统计: - cat: 2张 (66.7%) - dog: 1张 (33.3%)

七、CLIP 应用场景
1. 零样本图像/视频分类
CLIP 最直接的应用是零样本分类,无需标注数据即可完成新类别的识别。例如:
- 电商商品分类:将商品类别(如 “T 恤”、“裤子”、“鞋子”)转换为文本提示,实现商品自动分类;
- 工业缺陷检测:构造 “normal”、“crack”、“scratch” 等文本提示,检测产品缺陷;
- 视频分类:对视频帧提取特征后取平均,再与文本提示计算相似度,实现零样本视频分类。
2. 图文检索与生成
- 图文检索:构建图像特征库和文本特征库,通过相似度匹配实现“以文搜图”或“以图搜文”,应用于相册检索、电商商品检索等场景;
- 文生图/图生文:CLIP 的文本编码器可作为文生图模型(如 Stable Diffusion)的文本特征输入,提升文本到图像的语义对齐;图像编码器可用于图生文模型的视觉特征提取。
3. 多模态下游任务微调
CLIP 的预训练特征具有强通用性,可作为下游多模态任务的初始化权重:
- 图文匹配任务(如 VQA、图像字幕):冻结 CLIP 的编码器,仅训练下游任务头;
- 视觉分类任务:使用 CLIP 的图像特征作为输入,训练轻量级分类器,大幅减少标注数据需求;
- 跨模态生成:基于 CLIP 的表征空间,构建文本到图像、图像到文本的生成模型。
八、总结
CLIP提出了通用的跨模态预训练范式,通过大规模图文对比学习实现了视觉 - 文本的语义对齐;证明了零样本学习在计算机视觉任务中的可行性,大幅降低了视觉任务的标注成本;为多模态 AI 奠定了基础,推动了后续图文、视觉 - 语言交互模型的发展。
但由于预训练数据主要来自互联网,存在一些不可预知的错误,导致模型在特定场景下表现不佳,所以预训练做一些必要的处理是继续下一步的关键。虽然零样本能力强大,但在特定任务上仍不如微调后的专用模型。所以在使用过程中,做何种抉择也会是一种困扰,需要结合我们的经验和业务场景进行合理选择。
原创声明:本文系作者授权腾讯云开发者社区发表,未经许可,不得转载。
如有侵权,请联系 cloudcommunity@tencent.com 删除。
原创声明:本文系作者授权腾讯云开发者社区发表,未经许可,不得转载。
如有侵权,请联系 cloudcommunity@tencent.com 删除。
评论
登录后参与评论
推荐阅读
目录
腾讯云开发者

Copyright © 2013 - 2026 Tencent Cloud. All Rights Reserved. 腾讯云 版权所有
深圳市腾讯计算机系统有限公司 ICP备案/许可证号:粤B2-20090059 ![]() 粤公网安备44030502008569号
粤公网安备44030502008569号
腾讯云计算(北京)有限责任公司 京ICP证150476号 | 京ICP备11018762号