如何在ggplot2中包围极坐标限制?
如何在ggplot2中包围极坐标限制?
提问于 2017-12-11 11:29:07
我有一个圆形的空间,其中角0和360是相等的。我想在这个空间中绘制矩形,这样矩形就可以与这个值相交。然而,我在ggplot2上遇到了麻烦。
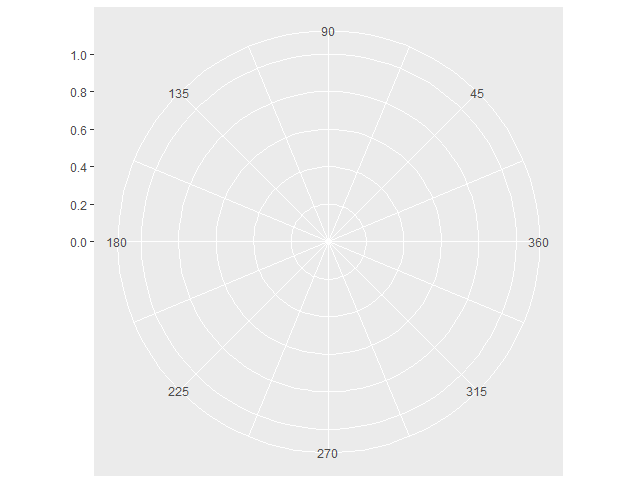
base <- ggplot() +
  scale_x_continuous(breaks = seq(45, 360, 45), limits = c(0, 360)) +
  scale_y_continuous(breaks = seq(0, 1, 0.2), limits = c(0, 1)) +
  coord_polar(theta = "x", start = 1.5 * pi, direction = -1)
1.试图绘制超过xlim:的值
base + geom_rect(aes(xmin = 340, xmax = 380, ymin = 0.4, ymax = 0.6),
  color = "darkblue", fill = "steelblue")
#> Warning message:
#> Removed 1 rows containing missing values (geom_rect).
xlim之外的所有值都会被移除,因此这不起作用。
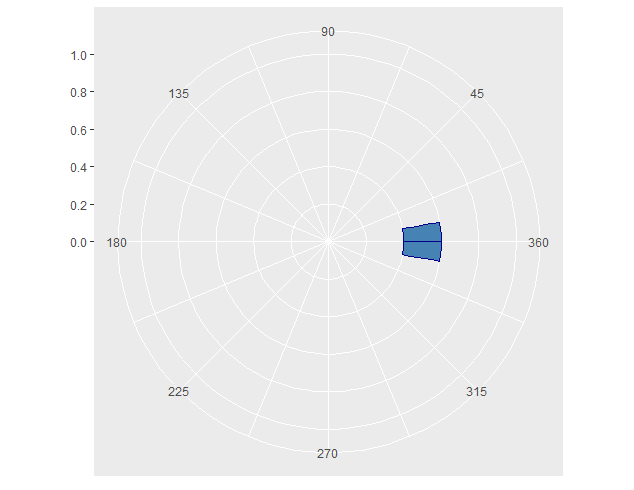
2.尝试用重标度值绘图
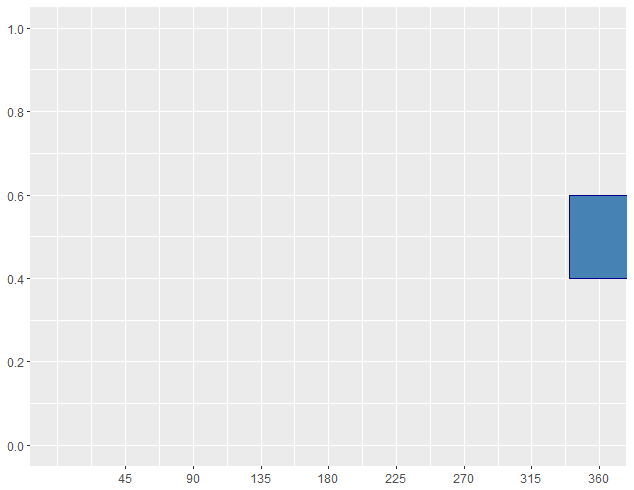
base + geom_rect(aes(xmin = 340, xmax = 380 %% 360, ymin = 0.4, ymax = 0.6),
  color = "darkblue", fill = "steelblue")
这至少产生了一个情节,但情节与我想要的正好相反。这个地块不是340到380“特定常规武器公约”,而是340至20化学武器。
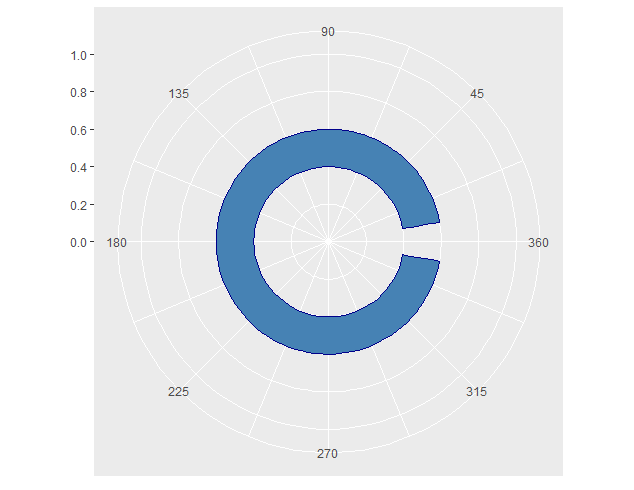
3.试图将两个相邻的元素绘制成
  base + geom_rect(aes(xmin = c(350, 0), xmax = c(360, 10), ymin = 0.4, ymax = 0.6),
    color = "darkblue", fill = "steelblue")
这里显示了我想要的矩形,但作为一个解决方案,这并不令人满意,因为在0/360角度上的笔画线,而且我现在必须将每个矩形表示为两个矩形。
4.尝试1使用缩放而不是裁剪
ggplot() +
  scale_x_continuous(breaks = seq(45, 360, 45)) +
  scale_y_continuous(breaks = seq(0, 1, 0.2), limits = c(0, 1)) +
  coord_cartesian(xlim = c(0, 360)) +
  coord_polar(theta = "x", start = 1.5 * pi, direction = -1) +
  geom_rect(aes(xmin = 340, xmax = 380, ymin = 0.4, ymax = 0.6),
    color = "darkblue", fill = "steelblue")
这似乎失去了放大和限制。
5.尝试2使用缩放而不是裁剪
ggplot() +
  scale_x_continuous(breaks = seq(45, 360, 45)) +
  scale_y_continuous(breaks = seq(0, 1, 0.2), limits = c(0, 1)) +
  coord_polar(theta = "x", start = 1.5 * pi, direction = -1) +
  coord_cartesian(xlim = c(0, 360)) +
  geom_rect(aes(xmin = 340, xmax = 380, ymin = 0.4, ymax = 0.6),
    color = "darkblue", fill = "steelblue")
这正确地完成了缩放,但覆盖了极坐标系统。
如果有人能为这个问题提供一个解决方案或想法,我会非常感激的。再次,我正在寻找的东西,看上去像#3,但没有内在的笔画,不需要使用两个矩形。
编辑:这个question是相关的,也是没有答案的。
回答 1
Stack Overflow用户
回答已采纳
发布于 2017-12-11 20:29:02
底层坐标系是否是极坐标系?geom_arc_bar()来自ggforce包的行为与您所期望的一样,因此您可以使用它以任意角度绘制弧线。但是下面有一个笛卡儿坐标系,所以如果你需要的话,你可能需要自己绘制坐标线。
library(ggforce)
library(dplyr)
data_deg <- data.frame(xmin = 340,
xmax = 380,
ymin = 0.4,
ymax = 0.6)
offset = 90 # by how much are angles offset
dir = 1 # should we go counterclockwise (1) or clockwise (-1)
# convert angles from degrees into radians, apply offset and direction
data_rad <- mutate(data_deg,
xmin = dir*2*pi*(xmin + offset)/360,
xmax = dir*2*pi*(xmax + offset)/360)
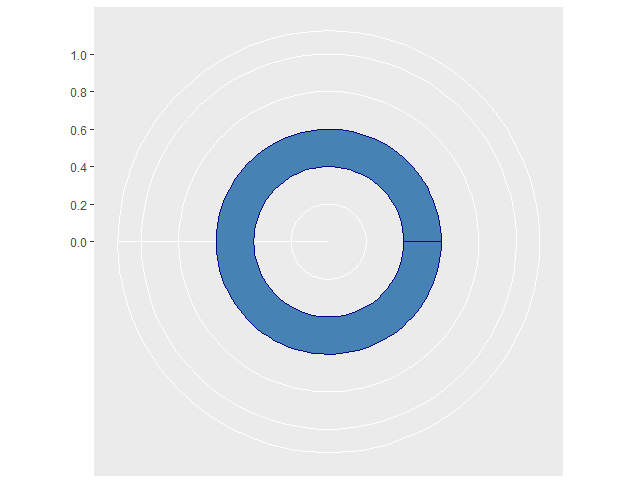
ggplot(data_rad) + geom_arc_bar(aes(x0 = 0, y0 = 0, r0 = ymin, r = ymax,
start = xmin, end = xmax),
color = "darkblue", fill = "steelblue") +
scale_x_continuous(limits = c(-1, 1)) +
scale_y_continuous(limits = c(-1, 1)) +
coord_fixed()
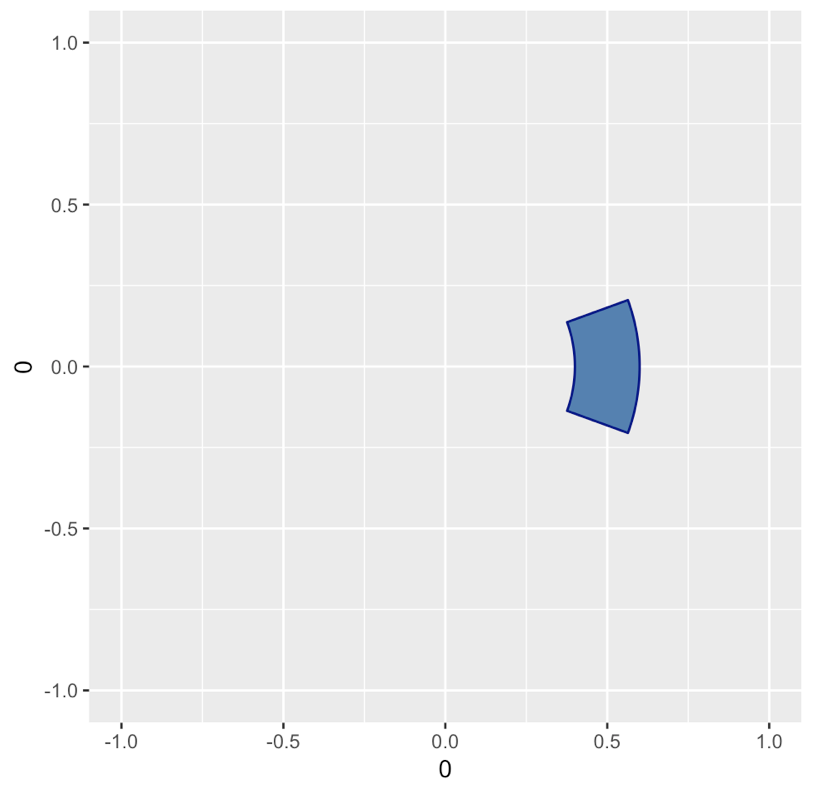
这并不能解决你链接到的另一个问题,但一般来说,你可能会发现,把坐标从极坐标转换到欧几里得,会给你提供更多的灵活性,让你的图形看起来像你想要的那样。
页面原文内容由Stack Overflow提供。腾讯云小微IT领域专用引擎提供翻译支持
原文链接:
https://stackoverflow.com/questions/47760020
复制


相似问题
使用angularjs在分隔页中加载外部库
AngularJS & Bootstrap模式加载模板外部控制器
在angularjs中重新加载外部控制器
AngularJS控制器工作,但不加载html页。
angularjs控制器模块参考加载空白页
添加站长 进交流群
领取专属 10元无门槛券
AI混元助手 在线答疑

关注 腾讯云开发者公众号
洞察 腾讯核心技术
剖析业界实践案例

腾讯云开发者
