in图中geom_rect的geom_rect等价
in图中geom_rect的geom_rect等价
提问于 2018-10-15 08:10:10
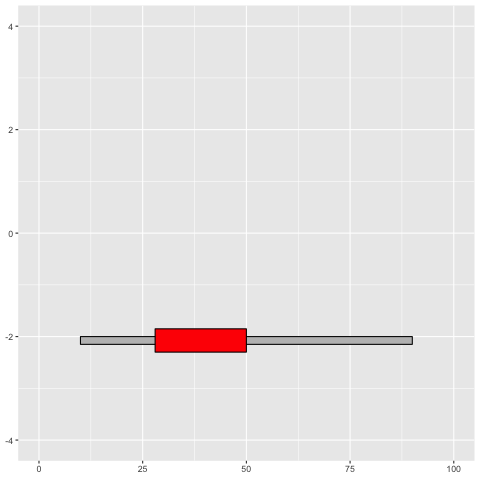
我试图在后台蛋白质主干(使用geom_rect()函数绘制)上添加图表。是否有任何方法来创建圆边矩形而不是基本矩形(特别是红色矩形)。这是我用过的代码。
我尝试过从roundrectGrob()函数grid中获得错误Error: Don't know how to add roundrectGrob(x = 28, y = -2.3, width = 22, height = 0.45) to a plot
library(ggplot2)
p <- ggplot() +
ylim(-4, 4) +
xlim(0, 100)
## First rect
p <- p + geom_rect(mapping=aes(xmin=10,
xmax=90,
ymin=-2.15,
ymax=-2.00),
colour = "black",
fill = "grey")
## Second rect
p <- p + geom_rect(mapping=aes(xmin=28,
xmax=50,
ymin=-2.30,
ymax=-1.85),
colour = "black",
fill = "red")
# print
p
dev.off()
回答 1
Stack Overflow用户
回答已采纳
发布于 2018-10-15 09:40:02
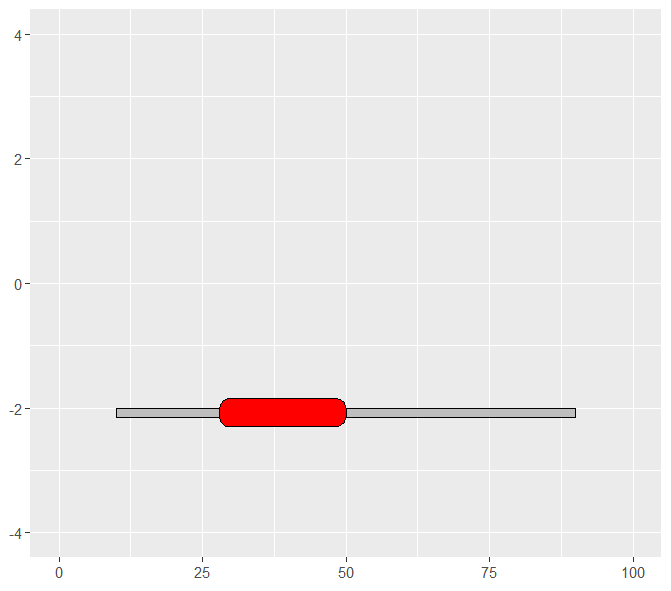
按照@hrbrmstr的建议,在安装statebins之后
devtools::install_github("hrbrmstr/statebins")尝尝这个
library(ggplot2)
p <- ggplot() + ylim(-4, 4) + xlim(0, 100)
## First rect
p <- p + geom_rect(mapping=aes(xmin=10,
         xmax=90, ymin=-2.15,  ymax=-2.00),
         colour = "black", fill = "grey")
## Second rect
p <- p + statebins:::geom_rrect(mapping=aes(xmin=28,
         xmax=50, ymin=-2.30, ymax=-1.85),
         colour = "black", fill = "red")
# Print
p
页面原文内容由Stack Overflow提供。腾讯云小微IT领域专用引擎提供翻译支持
原文链接:
https://stackoverflow.com/questions/52820756
复制相关文章
相似问题
腾讯云开发者
