操作场景
Aerospike Exporter 是一个用于 Aerospike 数据库的 Prometheus 指标导出工具,允许用户监视和收集 Aerospike 数据库的性能指标和统计信息。它可以帮助用户实时监控 Aerospike 集群的健康状况、性能表现和负载情况,有助于进行故障排除、性能优化和规划容量。通过将这些指标导出到 Prometheus,用户可以利用 Prometheus 的强大功能进行数据可视化、报警和分析。腾讯云可观测平台 Prometheus 提供了 Aerospike Exporter 集成及开箱即用的 Grafana 监控大盘。
接入方式
方式一:一键安装(推荐)
操作步骤
1. 登录 Prometheus 监控服务控制台。
2. 在实例列表中,选择对应的 Prometheus 实例。
3. 进入实例详情页,选择数据采集 > 集成中心。
4. 在集成中心找到并单击 Aerospike,即会弹出一个安装窗口,在安装页面填写指标采集名称和地址等信息,并单击保存即可。
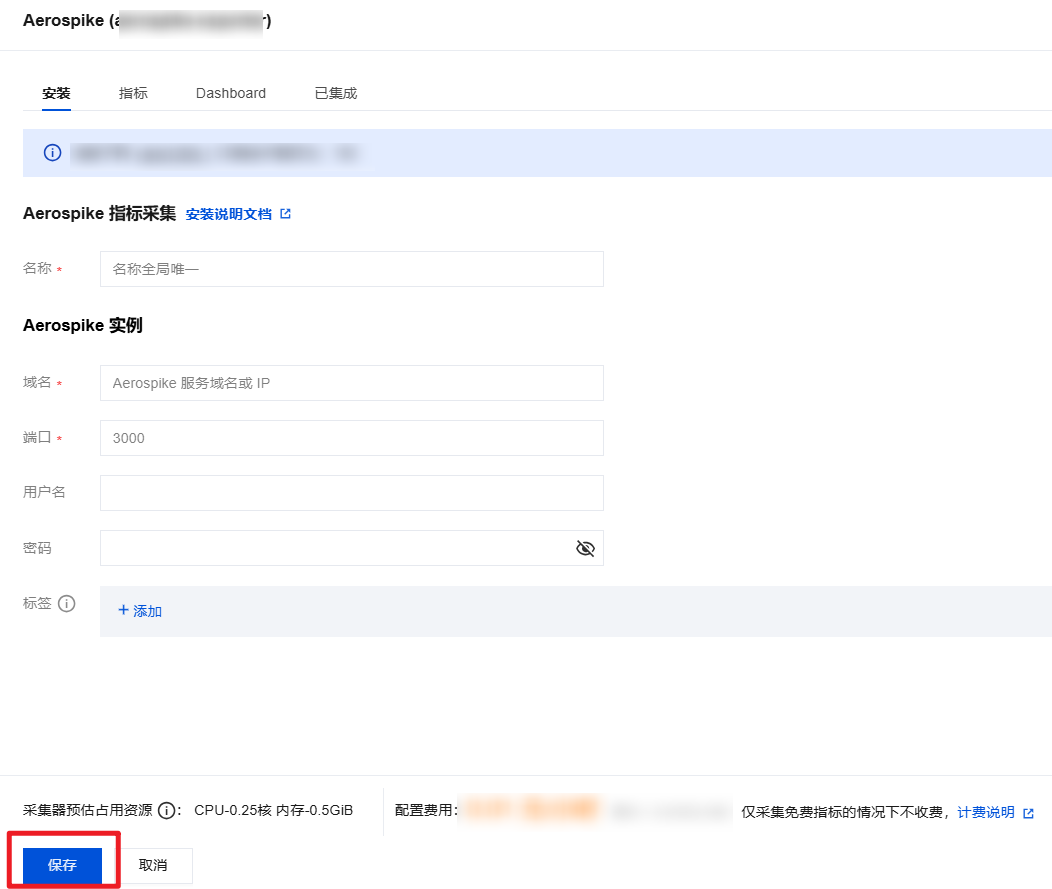
配置说明
参数 | 说明 |
名称 | 集成名称,命名规范如下: 名称具有唯一性。 名称需要符合下面的正则:'^[a-z0-9]([-a-z0-9]*[a-z0-9])?(\\.[a-z0-9]([-a-z0-9]*[a-z0-9])?)*$'。 |
域名 | Aerospike 数据库域名。 |
地址 | Aerospike 数据库端口。 |
用户名 | |
密码 | Aerospike 数据库密码。 |
标签 | 给指标添加自定义 Label。 |
方式二:自定义安装
说明
前提条件
在 Prometheus 实例对应地域及私有网络(VPC)下,创建腾讯云容器服务 Kubernetes 集群,并为集群创建 命名空间。
在 Prometheus 监控服务控制台 选择对应的 Prometheus 实例,然后在数据采集 > 集成容器服务中找到对应容器集群完成关联集群操作。可参见指引 关联集群。
操作步骤
步骤1:Exporter 部署
1. 登录 容器服务控制台。
2. 在左侧菜单栏中单击集群。
3. 单击需要获取集群访问凭证的集群 ID/名称,进入该集群的管理页面。
4. 执行以下 部署 Exporter 配置 > 部署 Aerospike Exporter > 验证 步骤完成 Exporter 部署。
步骤2:部署 Exporter 配置
1. 在左侧菜单中选择工作负载 > Deployment,进入 Deployment 管理页面。
2. 在页面右上角单击 YAML 创建资源,创建 YAML 配置,选择对应的命名空间来进行部署服务,可以通过控制台的方式创建。如下以 YAML 的方式部署 Exporter, 配置示例如下:
apiVersion: v1kind: Secretmetadata:name: aerospike-secret-test # 根据业务需要调整成相应名称namespace: aerospike-demo # 根据业务需要调整到相应命名空间type: OpaquestringData: ape.toml: |- [Agent] # metrics server timeout in seconds timeout = 30 # support system statistics also refresh_system_stats = true # prometheus binding port bind = ":8080" # 暴露指标端口 [Aerospike] db_host = "127.0.0.1" # 根据业务需要调整成对应的 IP 或域名 db_port = 3000 # 根据业务需要调整成对应的端口 user = "admin" # 根据业务需要调整成对应的用户名 password = "admin" # 根据业务需要调整成对应的密码 # timeout for sending commands to the server node in seconds timeout = 30 gauge_stats_list.toml: |- # This file represents a list of metrics which are treated as Gauges while exporting to Prometheus or some other Observability tool. # to know more about these stats, please visit https://docs.aerospike.com # # SETS: below section define all Sets stats which are treated as Gauges # sets_gauge_stats = [ "device_data_bytes", "index_populating", "memory_data_bytes", "objects", "sindexes", "tombstones", "truncate_lut", # 7.0 changes "data_used_bytes", "truncating", ] # # XDR: below section define all XDR stats which are treated as Gauges # xdr_gauge_stats = [ "compression_ratio", "in_progress", "in_queue", "lag", "lap_us", "latency_ms", "nodes", "recoveries_pending", "throughput", "uncompressed_pct", ] # # Sindex: below section define all Sindex stats which are treated as Gauges # sindex_gauge_stats = [ "entries_per_bval", "entries_per_rec", "entries", "histogram", # removed in server6.0 "ibtr_memory_used", # removed in server6.0 "keys", # removed in server6.0 "load_pct", "load_time", "loadtime", # removed in server6.0 "memory_used", # deprecated in server6.3 version and replaced by used_bytes "nbtr_memory_used", # removed in server6.0 "query_basic_avg_rec_count", # removed in server6.0 "used_bytes", # added in server6.3 represents memory used by data (aka memory_used) ] # # Node: below section define all Node stats which are treated as Gauges # node_gauge_stats = [ "batch_index_proto_compression_ratio", "batch_index_proto_uncompressed_pct", "batch_index_queue", "batch_index_unused_buffers", "client_connections", "cluster_clock_skew_ms", "cluster_clock_skew_stop_writes_sec", "cluster_integrity", "cluster_is_member", "cluster_max_compatibility_id", "cluster_min_compatibility_id", "cluster_size", "fabric_bulk_recv_rate", "fabric_bulk_send_rate", "fabric_connections", "fabric_ctrl_recv_rate", "fabric_ctrl_send_rate", "fabric_meta_recv_rate", "fabric_meta_send_rate", "fabric_rw_recv_rate", "fabric_rw_send_rate", "failed_best_practices", "heap_active_kbytes", "heap_allocated_kbytes", "heap_efficiency_pct", "heap_mapped_kbytes", "heap_site_count", "heartbeat_connections", "info_queue", "migrate_partitions_remaining", "objects", "process_cpu_pct", "proxy_in_progress", "queries_active", "rw_in_progress", "scans_active", "sindex_gc_list_creation_time", "sindex_gc_list_deletion_time", "system_free_mem_pct", "system_kernel_cpu_pct", "system_total_cpu_pct", "system_user_cpu_pct", "threads_detached", "threads_joinable", "threads_pool_active", "threads_pool_total", "time_since_rebalance", "tombstones", "tree_gc_queue", "tsvc_queue", # # 4.x XDR stats "dlog_free_pct", "dlog_used_objects", "xdr_active_failed_node_sessions", "xdr_active_link_down_sessions", "xdr_global_lastshiptime", "xdr_read_active_avg_pct", "xdr_read_idle_avg_pct", "xdr_read_latency_avg", "xdr_read_reqq_used_pct", "xdr_read_reqq_used", "xdr_read_respq_used", "xdr_read_txnq_used_pct", "xdr_read_txnq_used", "xdr_ship_compression_avg_pct", "xdr_ship_inflight_objects", "xdr_ship_latency_avg", "xdr_ship_outstanding_objects", "xdr_throughput", "xdr_timelag", ] # # Namespace: below section define all Namespace stats which are treated as Gauges # namespace_gauge_stats =[ "appeals_rx_active", "appeals_tx_active", "appeals_tx_remaining", "available_bin_names", "cache_read_pct", "clock_skew_stop_writes", "dead_partitions", "defrag_q", "device_available_pct", "device_compression_ratio", "device_free_pct", "device_total_bytes", "device_used_bytes", "effective_is_quiesced", "effective_prefer_uniform_balance", "effective_replication_factor", "evict_ttl", "hwm_breached", "index_flash_alloc_bytes", "index_flash_alloc_pct", "index_flash_used_bytes", "index_flash_used_pct", "index_pmem_used_bytes", "index_pmem_used_pct", "master_objects", "master_tombstones", "memory_free_pct", "memory_used_bytes", "memory_used_data_bytes", "memory_used_index_bytes", "memory_used_set_index_bytes", "memory_used_sindex_bytes", "migrate_rx_instances", "migrate_rx_partitions_active", "migrate_rx_partitions_initial", "migrate_rx_partitions_remaining", "migrate_signals_active", "migrate_signals_remaining", "migrate_tx_instances", "migrate_tx_partitions_active", "migrate_tx_partitions_imbalance", "migrate_tx_partitions_initial", "migrate_tx_partitions_lead_remaining", "migrate_tx_partitions_remaining", "n_nodes_quiesced", "non_expirable_objects", "non_replica_objects", "non_replica_tombstones", "ns_cluster_size", "nsup_cycle_deleted_pct", "nsup_cycle_duration", "nsup_cycle_sleep_pct", "objects", "pending_quiesce", "pmem_available_pct", "pmem_compression_ratio", "pmem_free_pct", "pmem_total_bytes", "pmem_used_bytes", "prole_objects", "prole_tombstones", "query_aggr_avg_rec_count", "query_basic_avg_rec_count", "query_proto_compression_ratio", "query_proto_uncompressed_pct", "record_proto_compression_ratio", "record_proto_uncompressed_pct", "scan_proto_compression_ratio", "scan_proto_uncompressed_pct", "shadow_write_q", "stop_writes", "storage-engine.device.defrag_q", "storage-engine.device.free_wblocks", "storage-engine.device.shadow_write_q", "storage-engine.device.used_bytes", "storage-engine.device.write_q", "storage-engine.device.age", "storage-engine.file.defrag_q", "storage-engine.file.free_wblocks", "storage-engine.file.shadow_write_q", "storage-engine.file.used_bytes", "storage-engine.file.write_q", "storage-engine.file.age", "storage-engine.stripe.defrag_q", "storage-engine.stripe.free_wblocks", "storage-engine.stripe.shadow_write_q", "storage-engine.stripe.used_bytes", "storage-engine.stripe.write_q", "storage-engine.stripe.age", "storage-engine.stripe.backing_write_q", "migrate_fresh_partitions", "tombstones", "truncate_lut", "unavailable_partitions", "unreplicated_records", "write_q", "xdr_bin_cemeteries", "xdr_tombstones", # added in 7.0 "data_avail_pct", "data_compression_ratio", "data_total_bytes", "data_used_bytes", "data_used_pct", "index_mounts_used_pct", "index_used_bytes", "indexes_memory_used_pct", "set_index_used_bytes", "sindex_mounts_used_pct", "sindex_used_bytes", "truncating", ] # System Info Gauge metrics list # system_info_gauge_stats = [ "", ]
步骤3:部署 Aerospike Exporter
1. 在左侧菜单中选择工作负载 > Deployment,进入 Deployment 管理页面。
2. 在页面右上角单击 YAML 创建资源,创建 YAML 配置,选择对应的命名空间来进行部署服务,可以通过控制台的方式创建。如下以 YAML 的方式部署 Exporter, 配置示例如下:
apiVersion: apps/v1kind: Deploymentmetadata:labels:k8s-app: aerospike-exporter # 根据业务需要调整成对应的名称,建议加上 Aerospike 实例的信息name: aerospike-exporter # 根据业务需要调整成对应的名称,建议加上 Aerospike 实例的信息namespace: aerospike-demo # 根据业务需要调整成对应的命名空间spec:replicas: 1selector:matchLabels:k8s-app: aerospike-exporter # 根据业务需要调整成对应的名称,建议加上 Aerospike 实例的信息template:metadata:labels:k8s-app: aerospike-exporter # 根据业务需要调整成对应的名称,建议加上 Aerospike 实例的信息spec:volumes:- name: secsecret:defaultMode: 420secretName: aerospike-secret-test # 对应 步骤二 配置名称containers:- name: aerospike-exporterimage: ccr.ccs.tencentyun.com/rig-agent/common-image:aerospike-exporter-1.18.0imagePullPolicy: IfNotPresent ports: - containerPort: 8080 # 对应 步骤二 配置中的指标导出端口 name: metrics livenessProbe: tcpSocket: port: metrics readinessProbe: tcpSocket: port: metrics volumeMounts: - mountPath: /etc/aerospike-prometheus-exporter name: sec readOnly: true
步骤4:验证
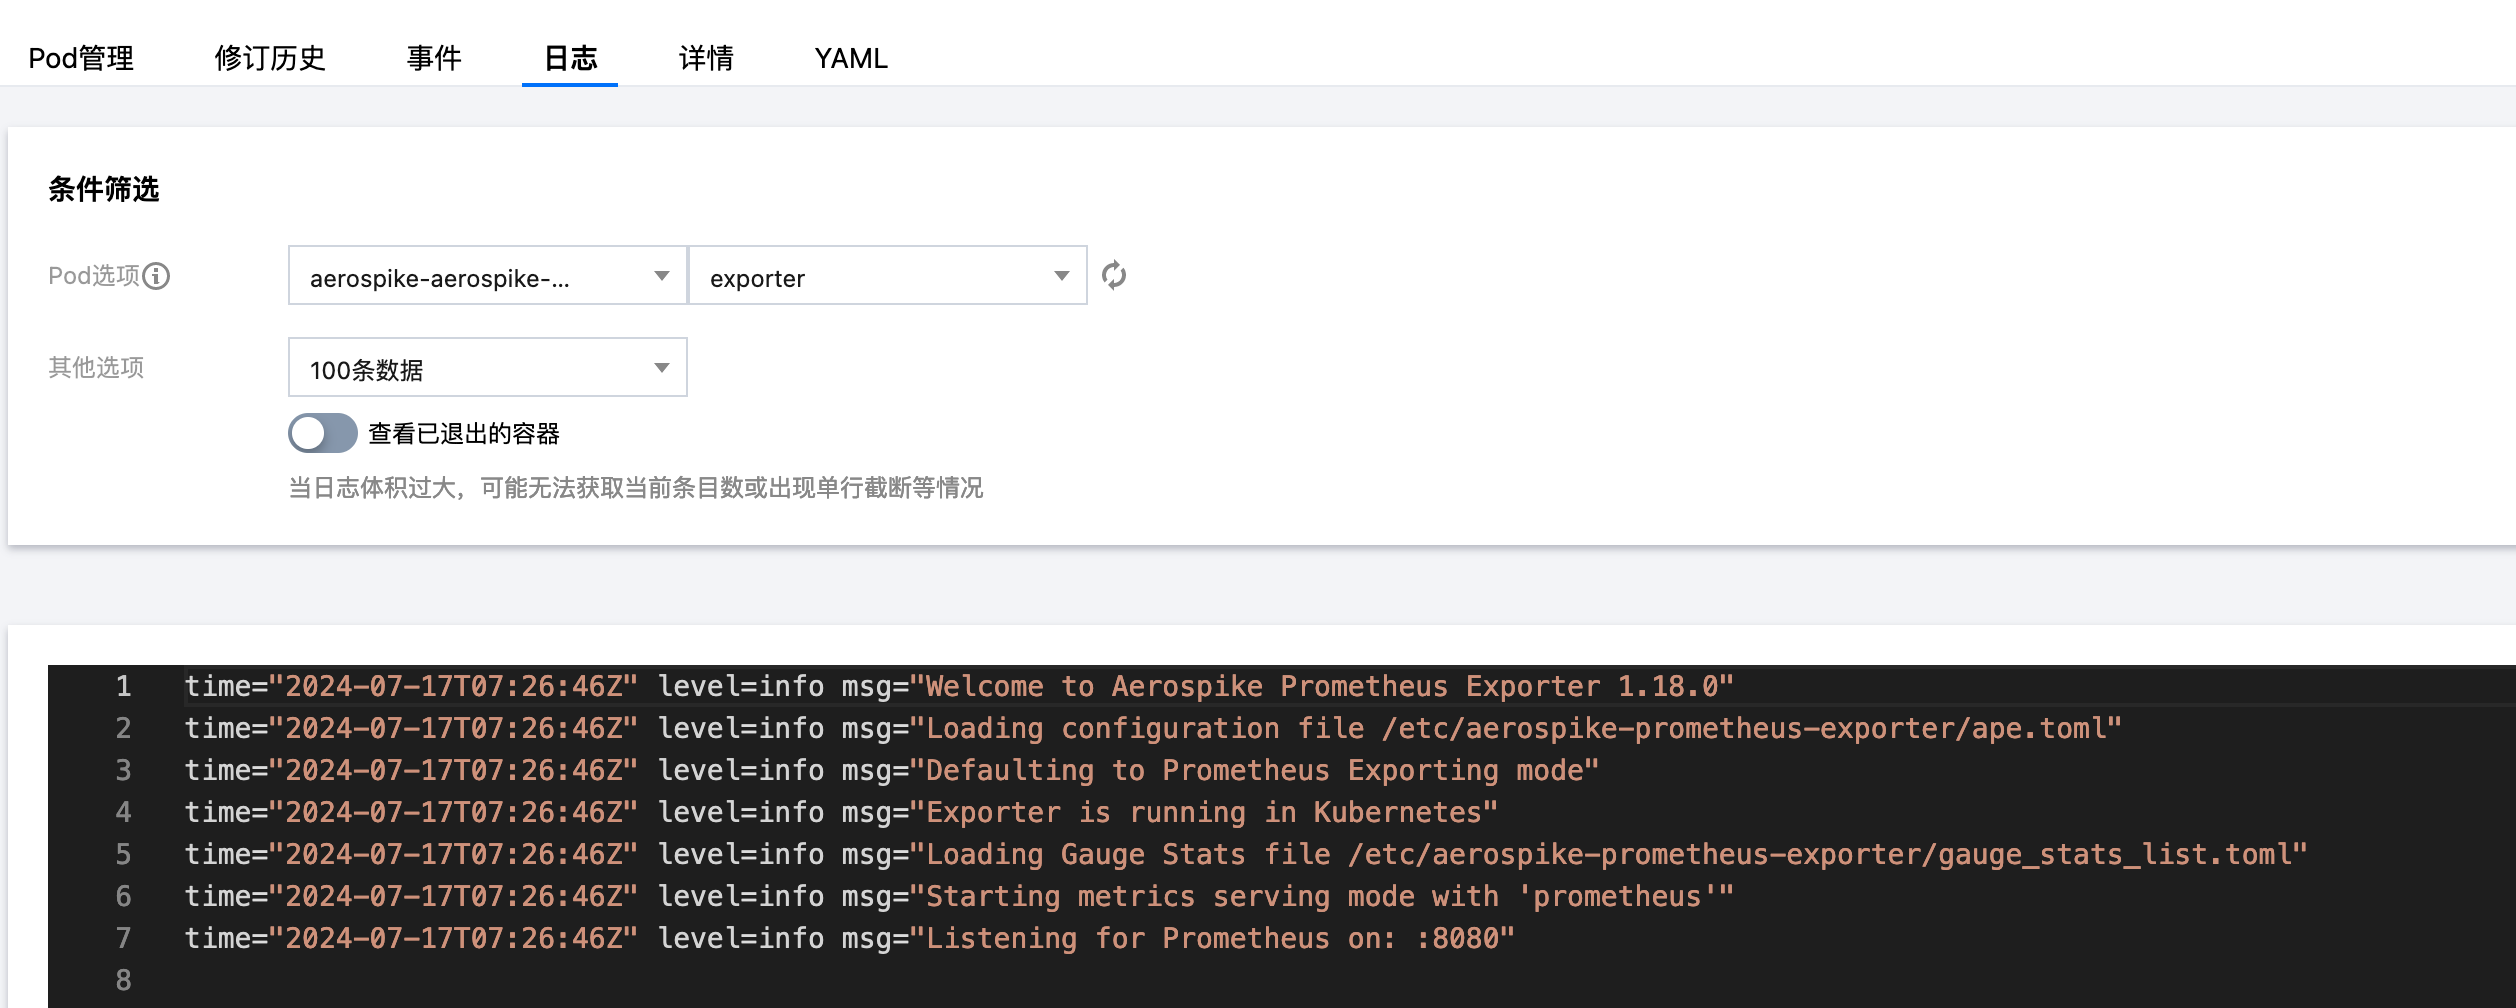
1. 在 Deployment 页面单击上述步骤创建的 Deployment,进入 Deployment 管理页面。
2. 单击日志页签,无报错信息输出即可,如下图所示:
3. 单击 Pod 管理页签进入 Pod 页面。
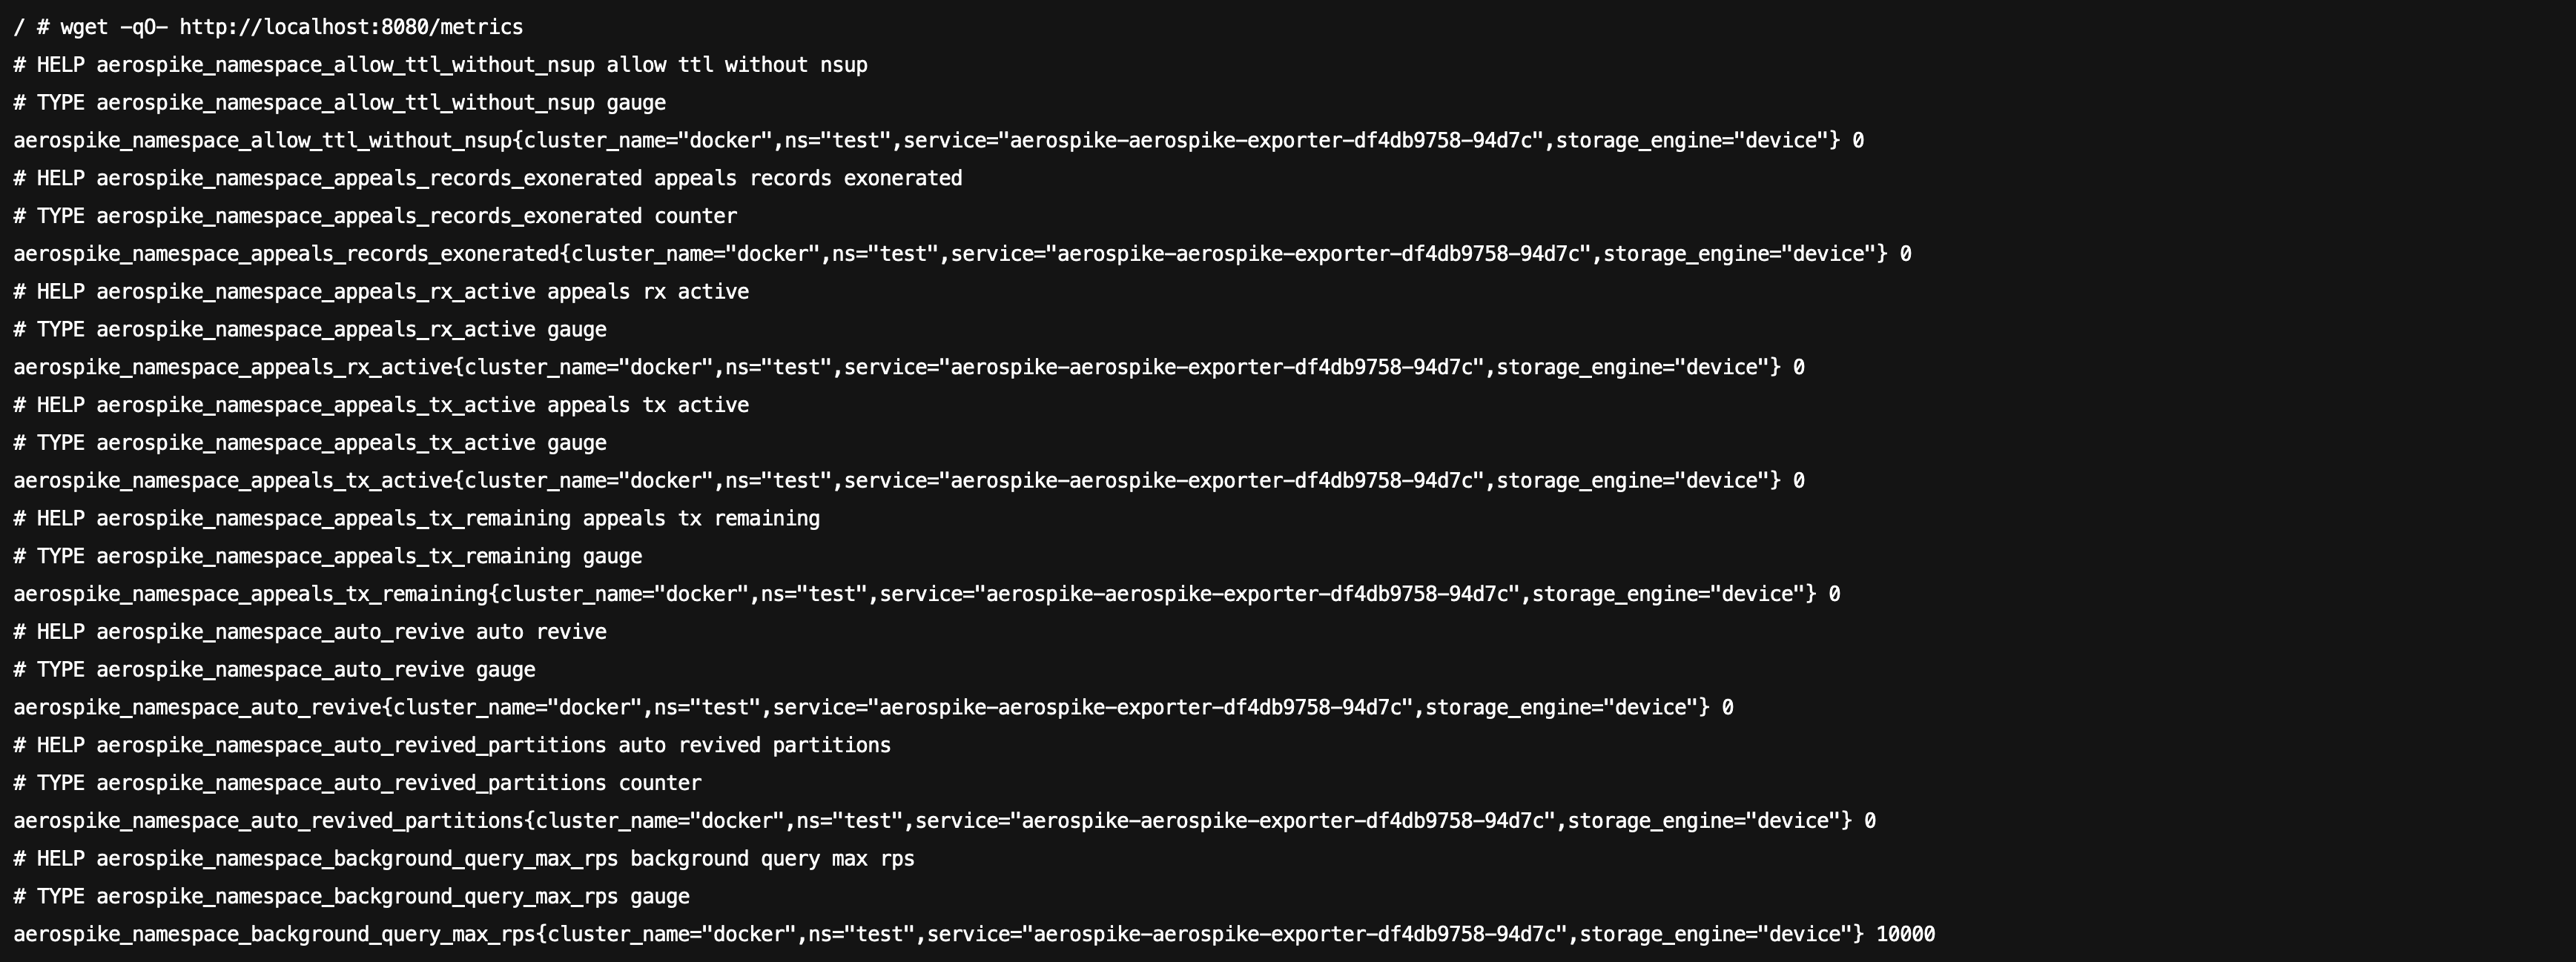
4. 在右侧的操作项下单击远程登录,即可登录 Pod,在命令行窗口中执行以下 wget 命令对应 Exporter 暴露的地址,可以正常得到对应的 Aerospike 指标。如发现未能得到对应的数据,请检查连接串是否正确,具体如下:
wget -qO- http://localhost:8080/metrics
执行结果如下图所示:
步骤5:添加采集任务
1. 登录 Prometheus 控制台,选择对应 Prometheus 实例进入管理页面。
2. 单击数据采集 > 集成容器服务,选择已经关联的集群,通过数据采集配置 > 新建自定义监控 > YAML 编辑来添加采集配置。
3. 通过服务发现添加
PodMonitors 来定义 Prometheus 抓取任务,YAML 配置示例如下:apiVersion: monitoring.coreos.com/v1kind: PodMonitormetadata:name: aerospike-exporter # 填写一个唯一名称namespace: cm-prometheus # 按量实例: 集群的 namespace; 包年包月实例(已停止售卖): namespace 固定,不要修改spec:podMetricsEndpoints:- interval: 30sport: metric-port # 填写pod yaml中Prometheus Exporter对应的Port的Namepath: /metrics # 填写Prometheus Exporter对应的Path的值,不填默认/metricsrelabelings:- action: replacesourceLabels:- instanceregex: (.*)targetLabel: instancereplacement: 'crs-xxxxxx' # 调整成对应的 Aerospike 实例 IDnamespaceSelector: # 选择要监控 aerospike exporter pod 所在的 namespacematchNames:- aerospike-demoselector: # 填写要监控pod的Label值,以定位目标podmatchLabels:k8s-app: aerospike-exporter
账号创建及授权
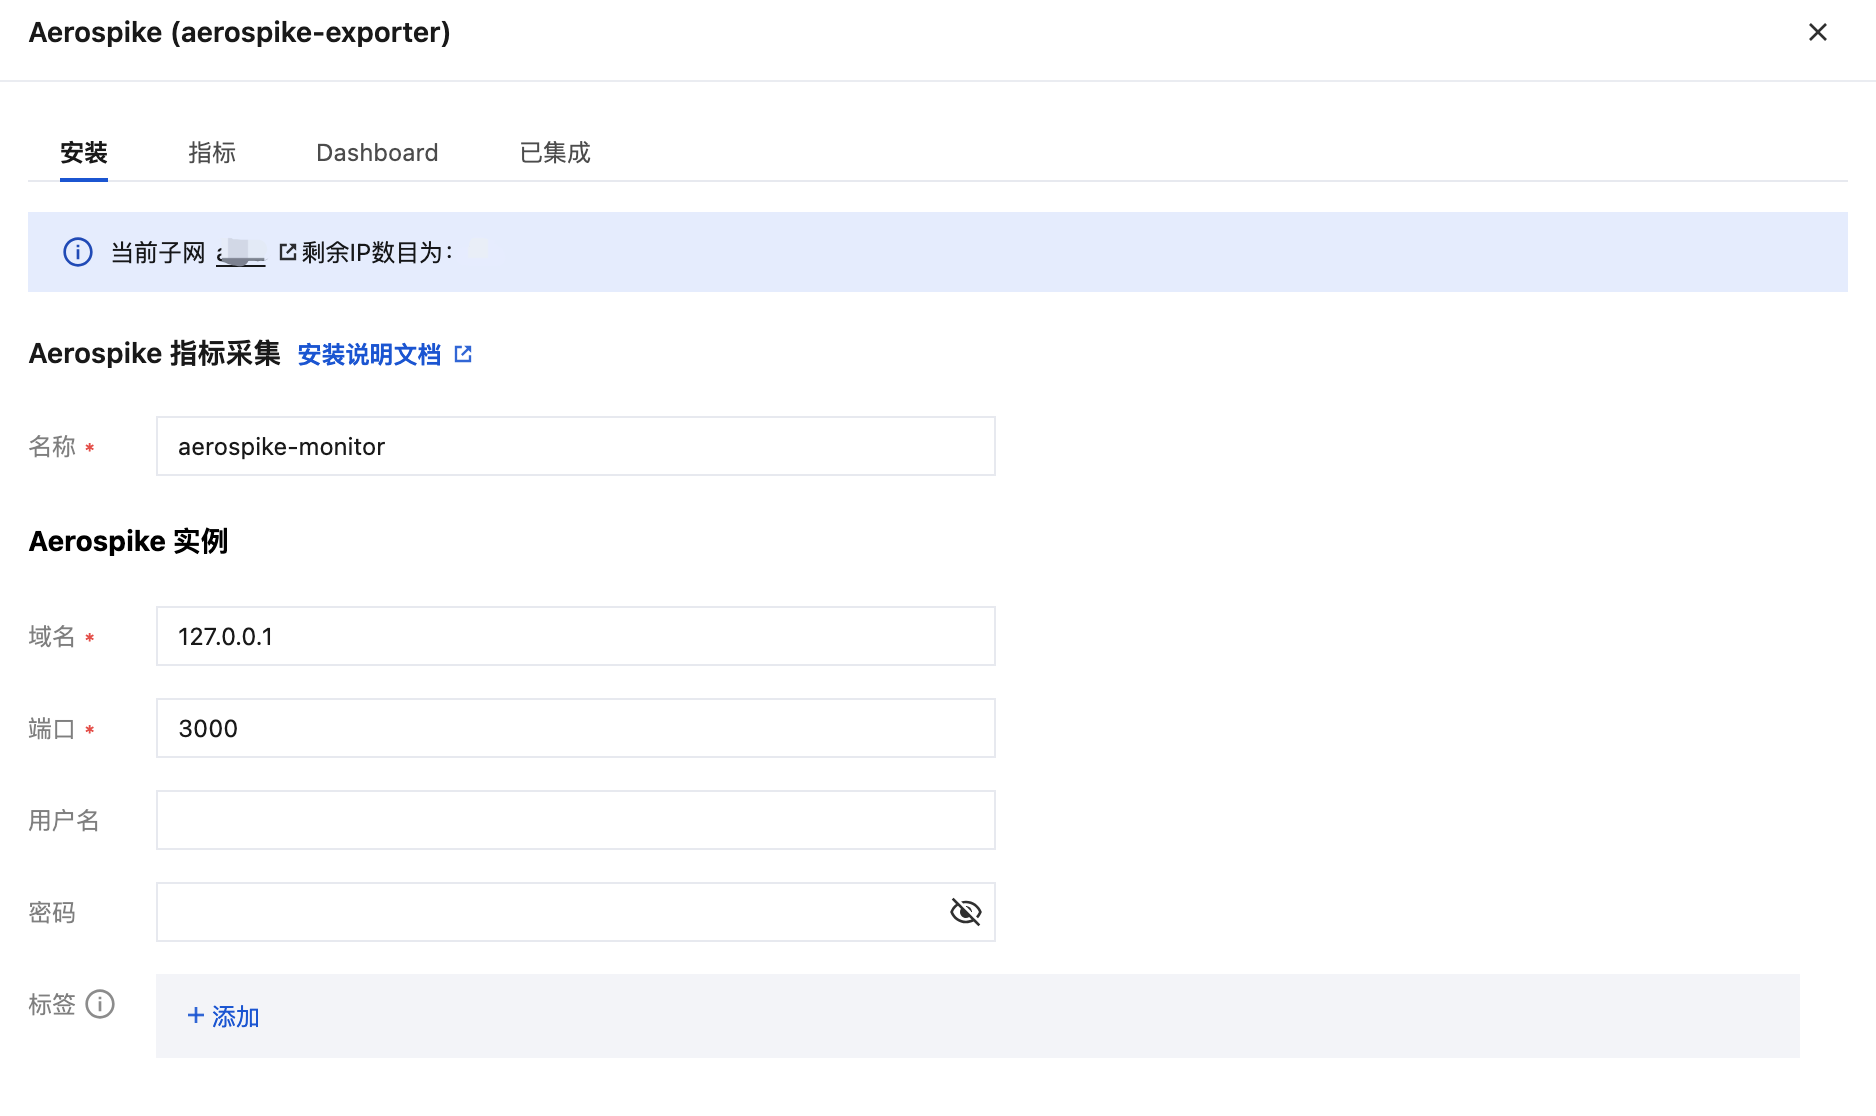
Aerospike 监控账号不需要分配任何额外权限。在未开启 ACL 权限认证的情况下,仅通过实例的域名和端口即可实现监控,无需在 Prometheus 实例的 Aerospike 集成填写用户名和密码。要确认 Aerospike 是否已开启 ACL 权限认证,可以检查 Aerospike 的配置文件 aerospike.conf 中的以下配置。
......security {# 在某些版本中,只需存在 security 配置即可默认启用 ACL 权限认证,无需设置 enable-security 为 true。enable-security true}......
如未开启 ACL 权限认证 ,可直接使用 Aerospike 实例的域名和端口进行监控,无需在 Prometheus 实例的 Aerospike 集成填写用户名和密码,如下图所示。
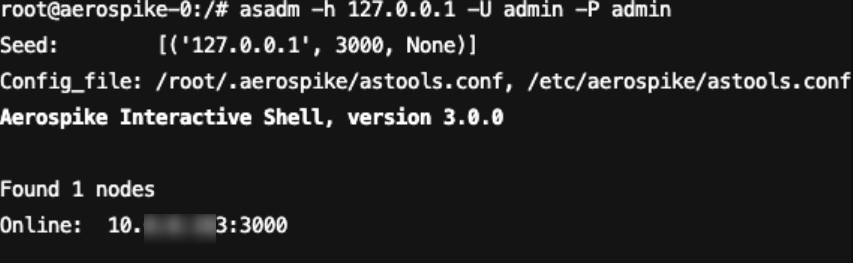
1. 在确保客户端机器与 Aerospike 数据库服务器连通的前提下,使用 admin 账号连接到 Aerospike 数据库服务器。具体的连接 Aerospike 数据库服务器会因所用工具或数据库版本而有所不同,以下示例命令展示了如何使用 asadm 命令行工具连接到 Aerospike 数据库服务器。
asadm -h 127.0.0.1 -U admin -P admin
命令执行结果如下图所示:
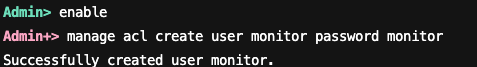
2. 打开 admin 账号的特权模式,创建用户需要在 admin 账号的特权模式下创建,随后执行创建用户命令。以下示例命令展示了如何创建一个账号名和密码均为 monitor 的监控账号。
enablemanage acl create user monitor password monitor
命令执行结果如下图所示:
查看监控
前提条件
Prometheus 实例已绑定 Grafana 实例。
操作步骤
1. 登录 腾讯云可观测平台 Prometheus 控制台,选择对应 Prometheus 实例进入管理页面。
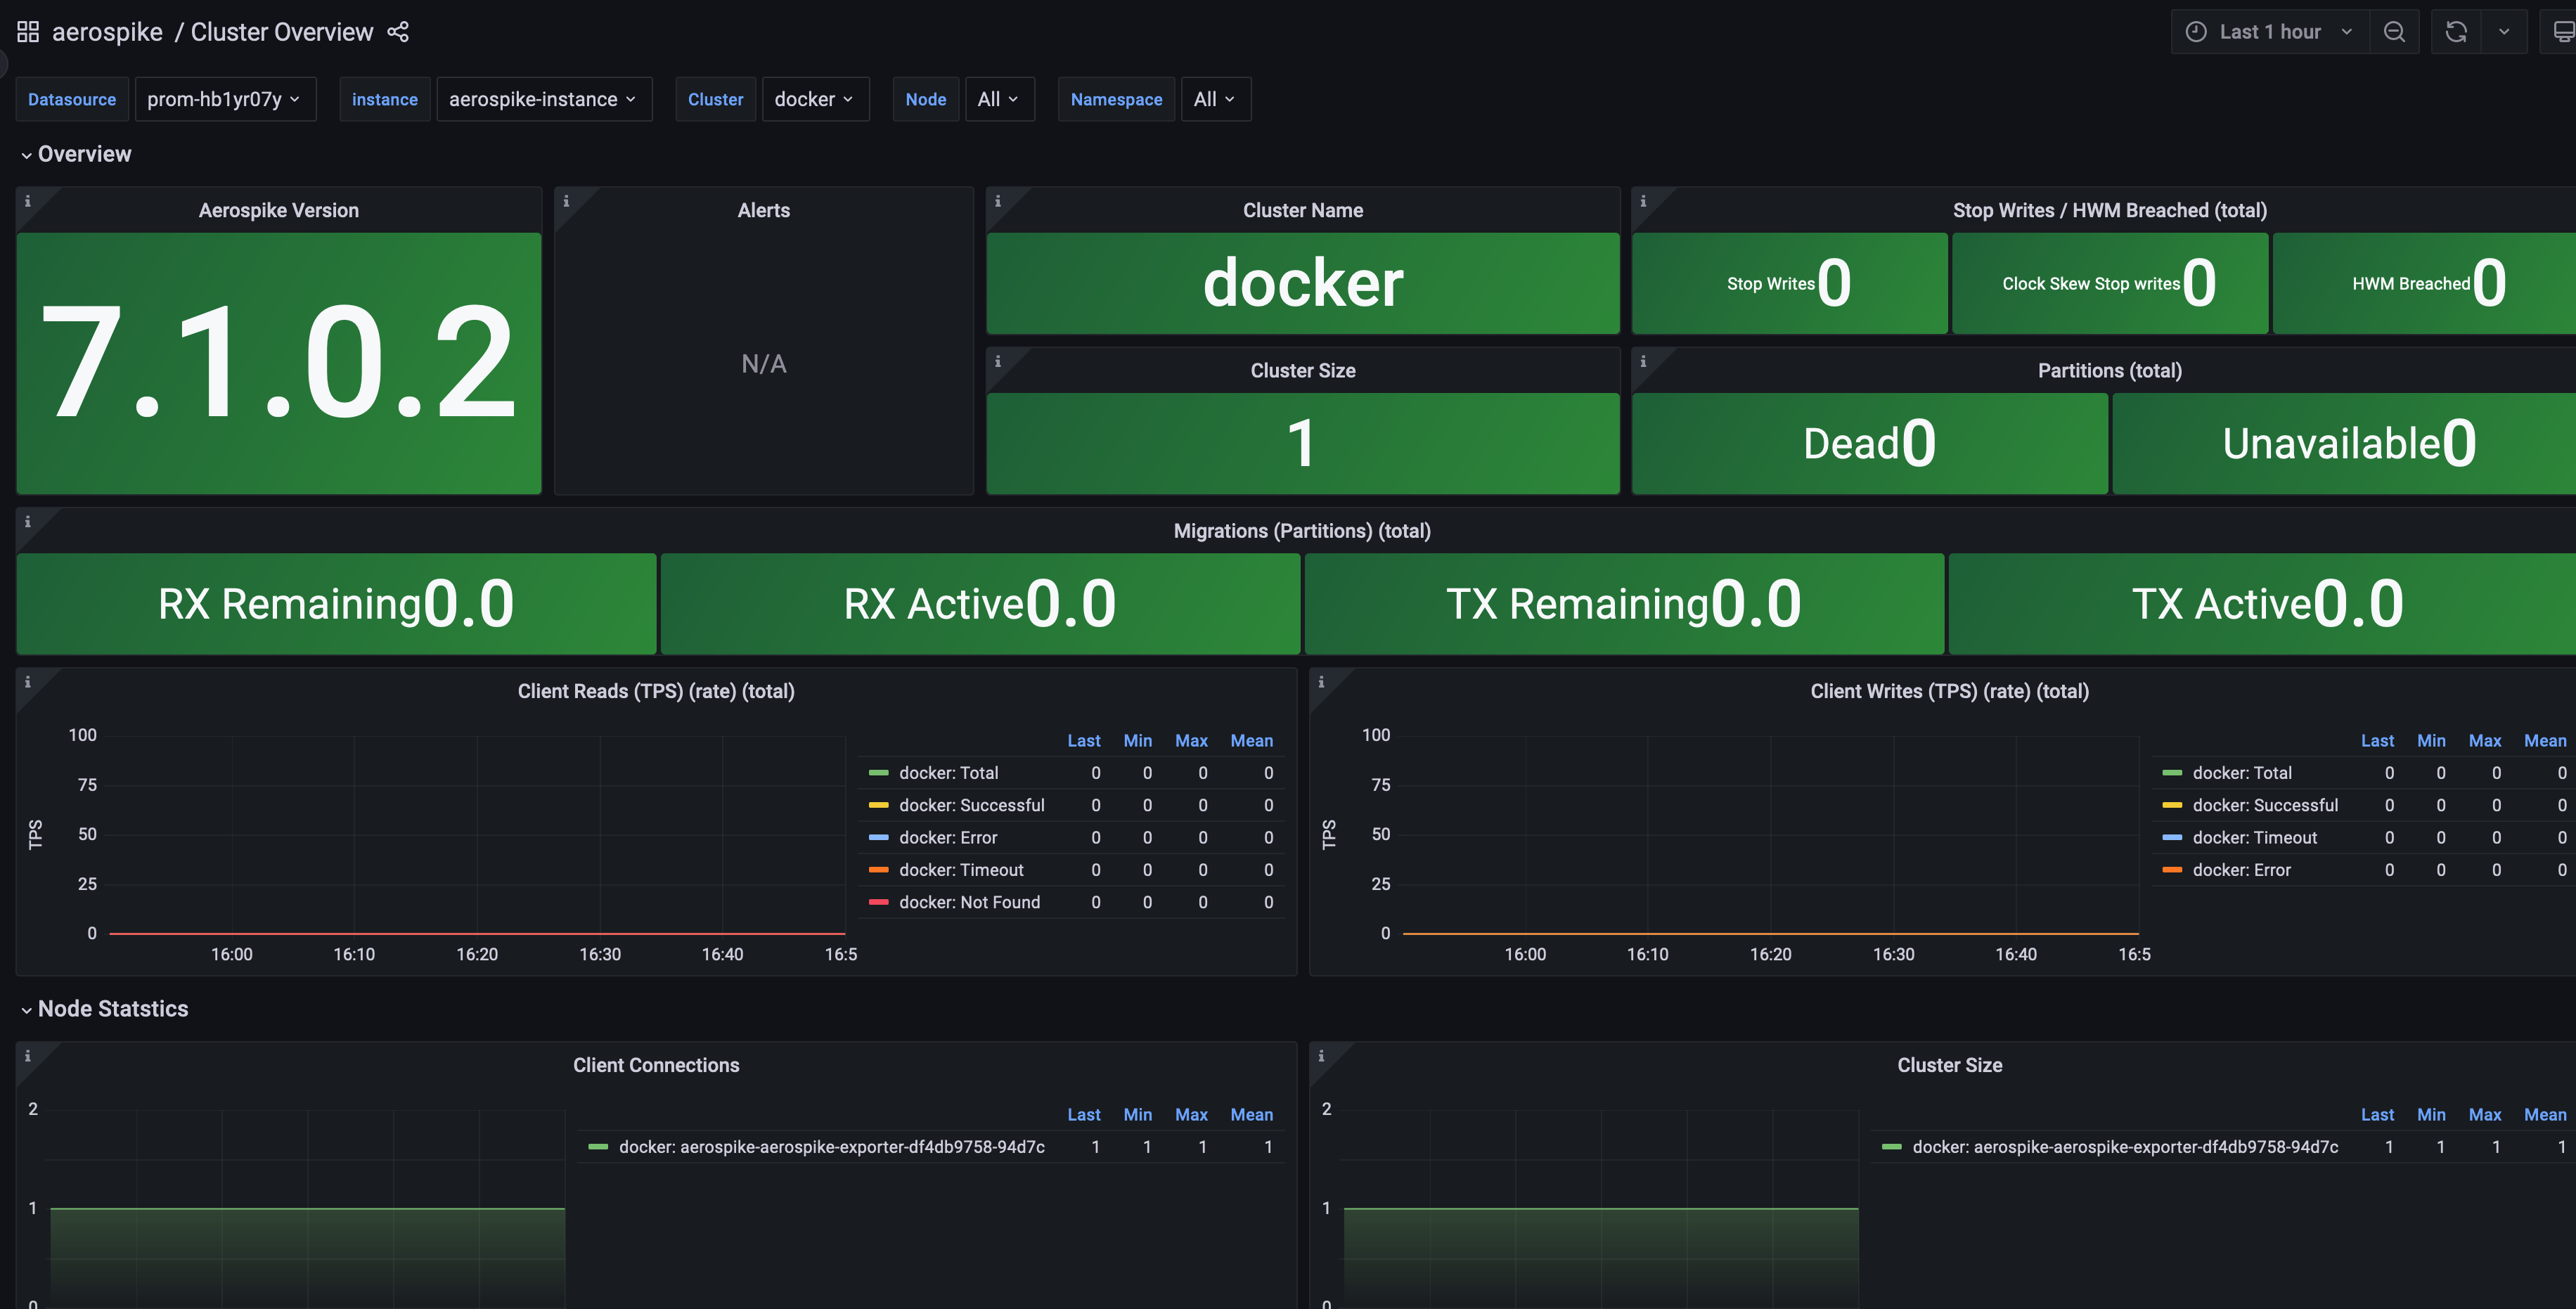
2. 在实例基本信息页面,找到绑定的 Grafana 地址,打开并登录,然后在 aerospike 文件夹中找到 Aerospike 实例相关监控面板,查看实例相关监控数据,如下图所示:
配置告警
附录:Aerospike Exporter 配置文件主要配置项
Agent 配置项
名称 | 描述 |
bind | 指标导出端口,默认":9145" |
cert_file | 签名用证书文件 |
key_file | 签名用证书文件 |
root_ca | 签名用证书文件 |
basic_auth_username | http auth 验证用户名 |
basic_auth_password | http auth 验证密码 |
timeout | 指标拉取超时 |
labels | 自定义标签值 |
refresh_system_stats | 支持系统数据统计 |
Aerospike 配置项
名称 | 描述 |
db_host | Aerospike 数据库域名或 IP |
db_port | Aerospike 数据库服务端口 |
auth_mode | Aerospike 校验模式,默认 internal,取值有 "external","internal","pki","" |
user | Aerospike 数据库用户名 |
password | Aerospike 数据库密码 |
timeout | Aerospike 数据库连接超时 |


