The SCF console now supports the Online Debugging feature, enabling you to troubleshoot and pinpoint issues directly through the console.
Note
Currently, the Online Debugging feature is exclusively compatible with the Chrome browser and only supports the Node.js 10.15 and Node.js 12.16 programming languages.
Enable debugging mode
Note
Before utilizing the Online Debugging feature, you must manually enable the debugging mode for the function. Enabling debugging mode will alter certain function configurations, which will be restored upon disabling the debugging mode. This may impact your operations, so please ensure you understand the following:
This function will transition into single-instance mode, where all versions of the function can only respond to one event at a time. Any concurrent events exceeding this limit will result in a failed call.
The execution timeout period is adjusted to 900 seconds. The execution timeout period cannot be set during the debugging phase.
Multiple pre-set instances will be reduced to a single instance.
Enabling debugging mode will reduce the function's performance. This function will transition into single-instance mode, where all versions of the function can only respond to one event at a time. Any concurrent events exceeding this limit will result in a failed call.
1. Log in to the SCF console and select Function Service on the left sidebar.
2. At the top of the Function Service page, select the region of the function you wish to enable debugging mode for. Then, click on the name of the function you wish to debug to enter its details page.
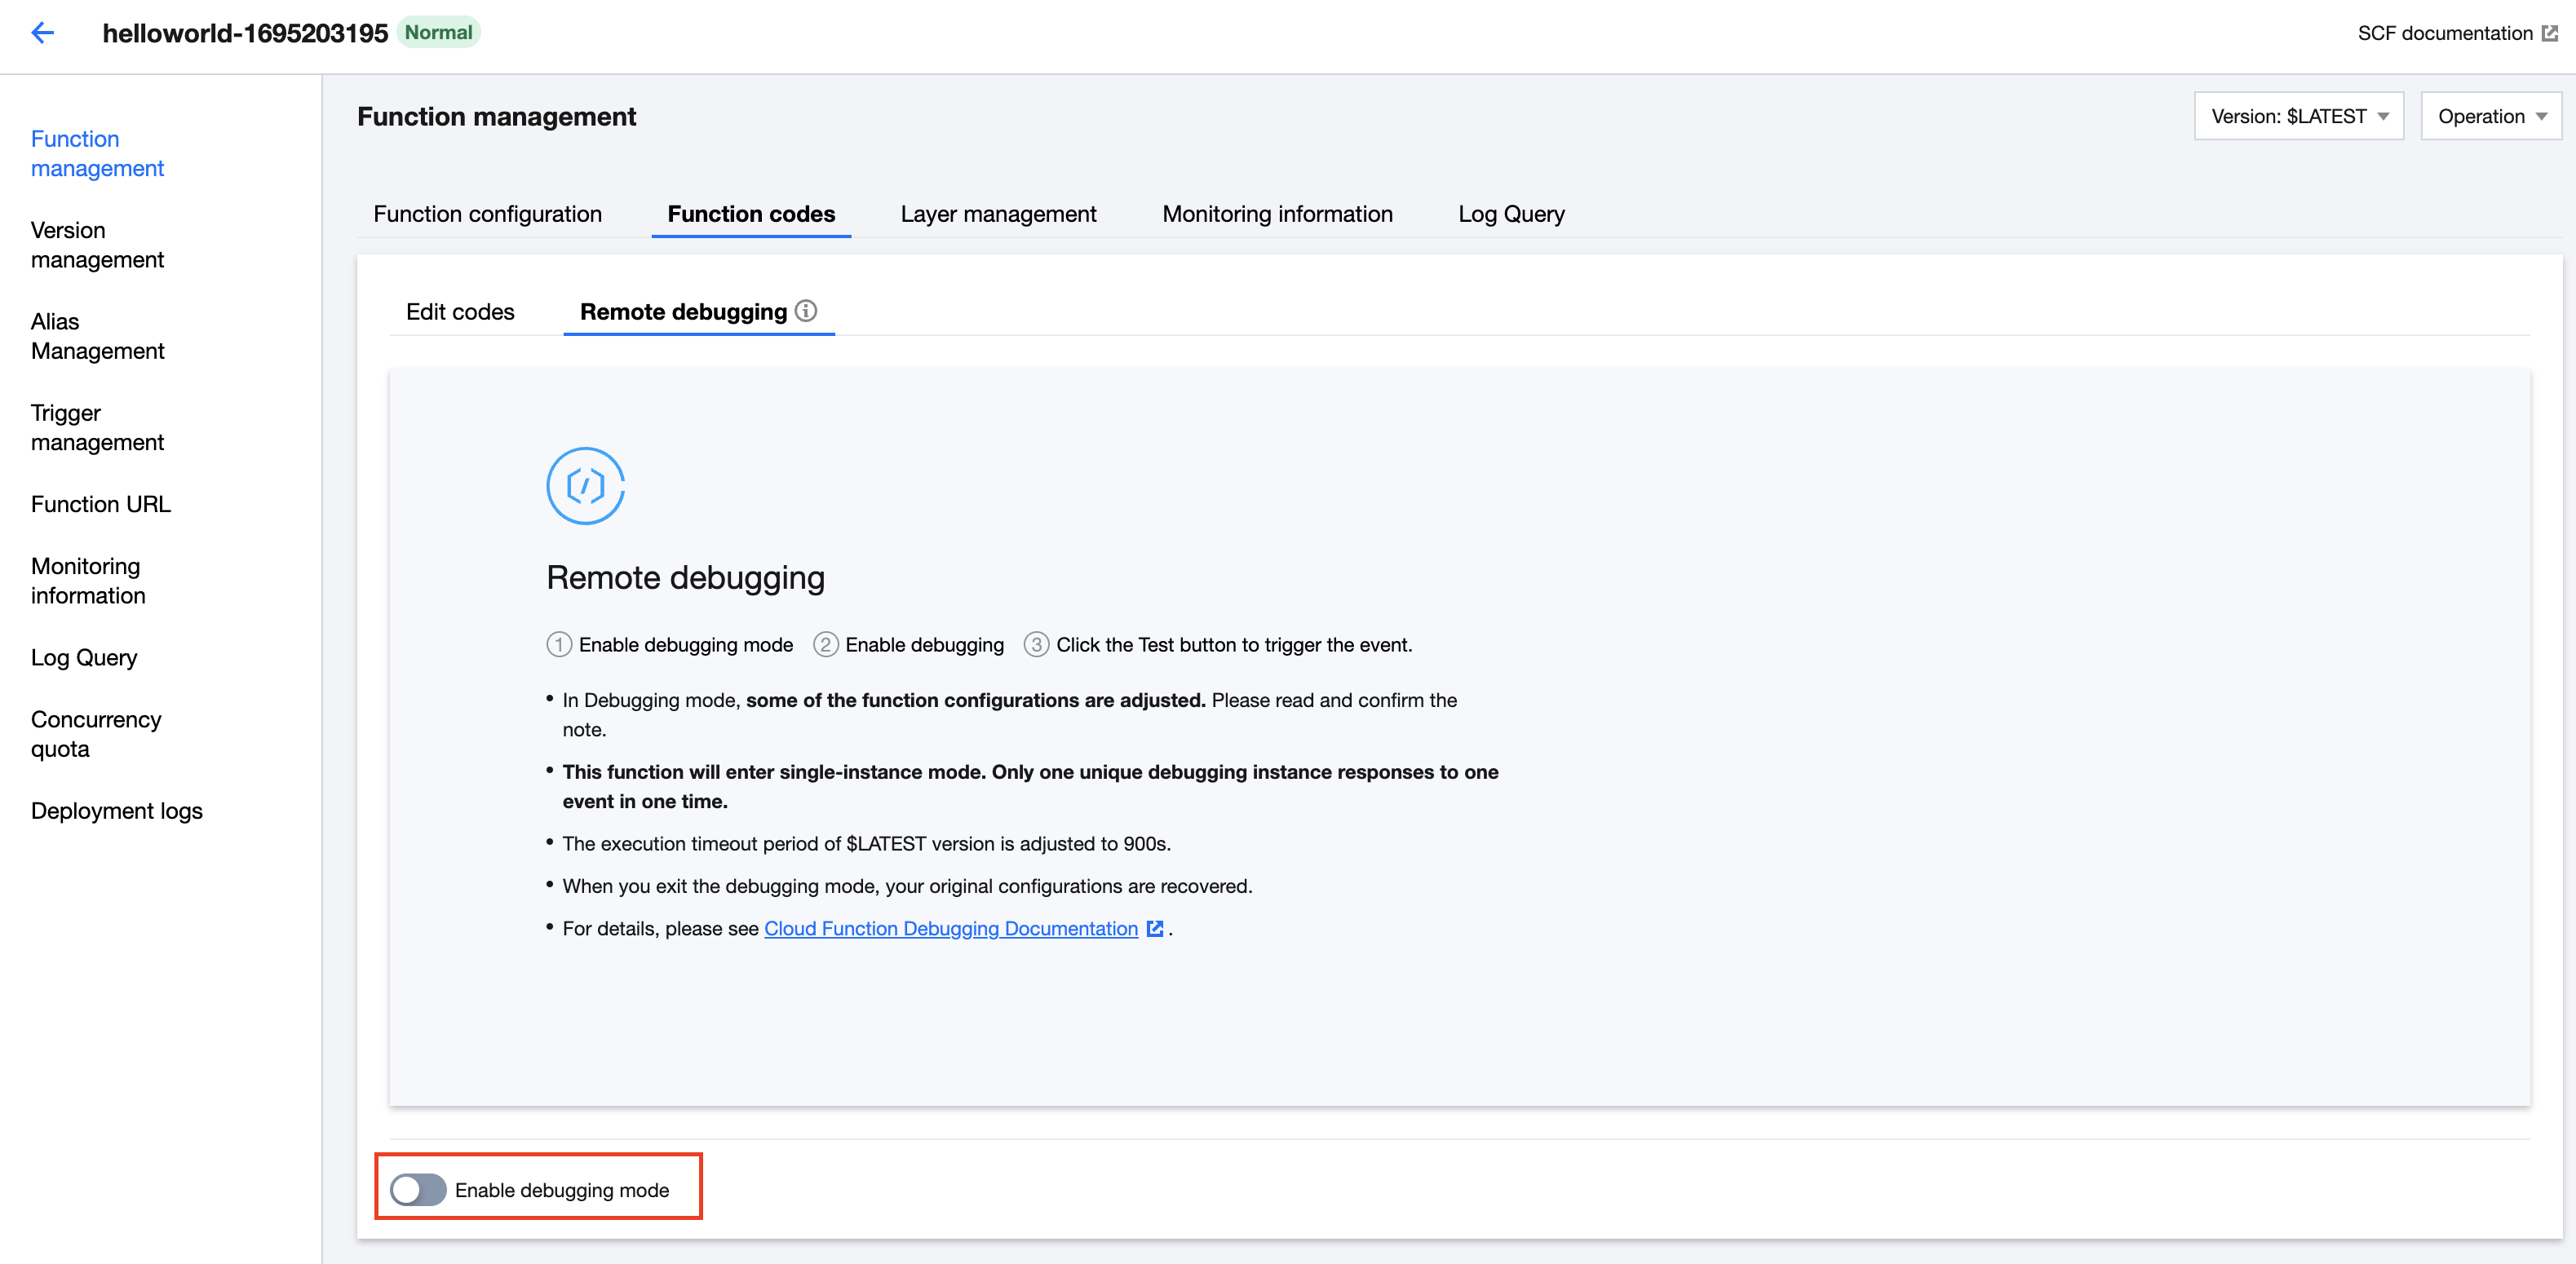
3. On the Function management page, select Function codes > Remote debugging, and click Enable debugging mode. As shown in the figure below:
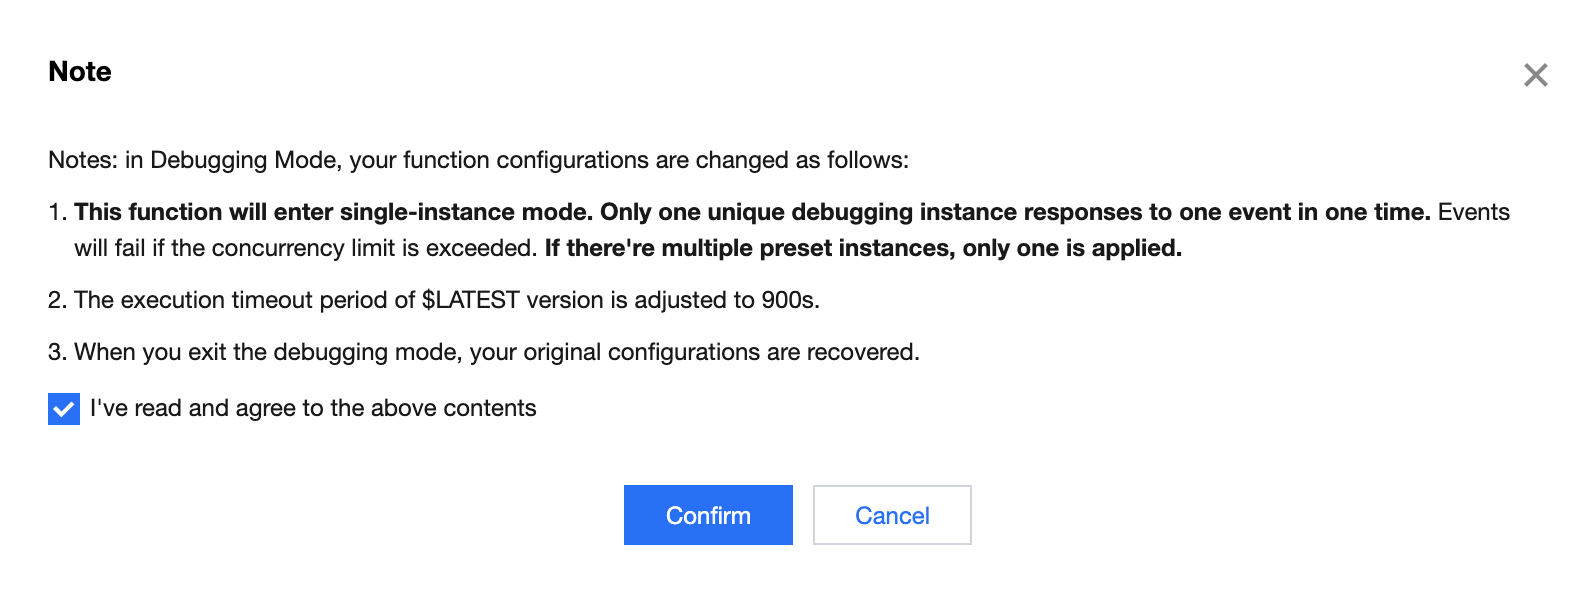
4. In the pop-up window, click Confirm to complete the activation of debugging mode. As shown in the figure below:
Debugging Steps
1. After Enabling Debugging Mode, the function will automatically initiate debugging upon update.
Note
If debugging mode is already enabled, you will need to manually select Start Debugging when you re-enter the debugging interface.
2. Once the loading is complete, the entry file will be automatically displayed. To open any file you need, you can use the shortcut Cmd + P (Mac) or Ctrl + P (Windows).
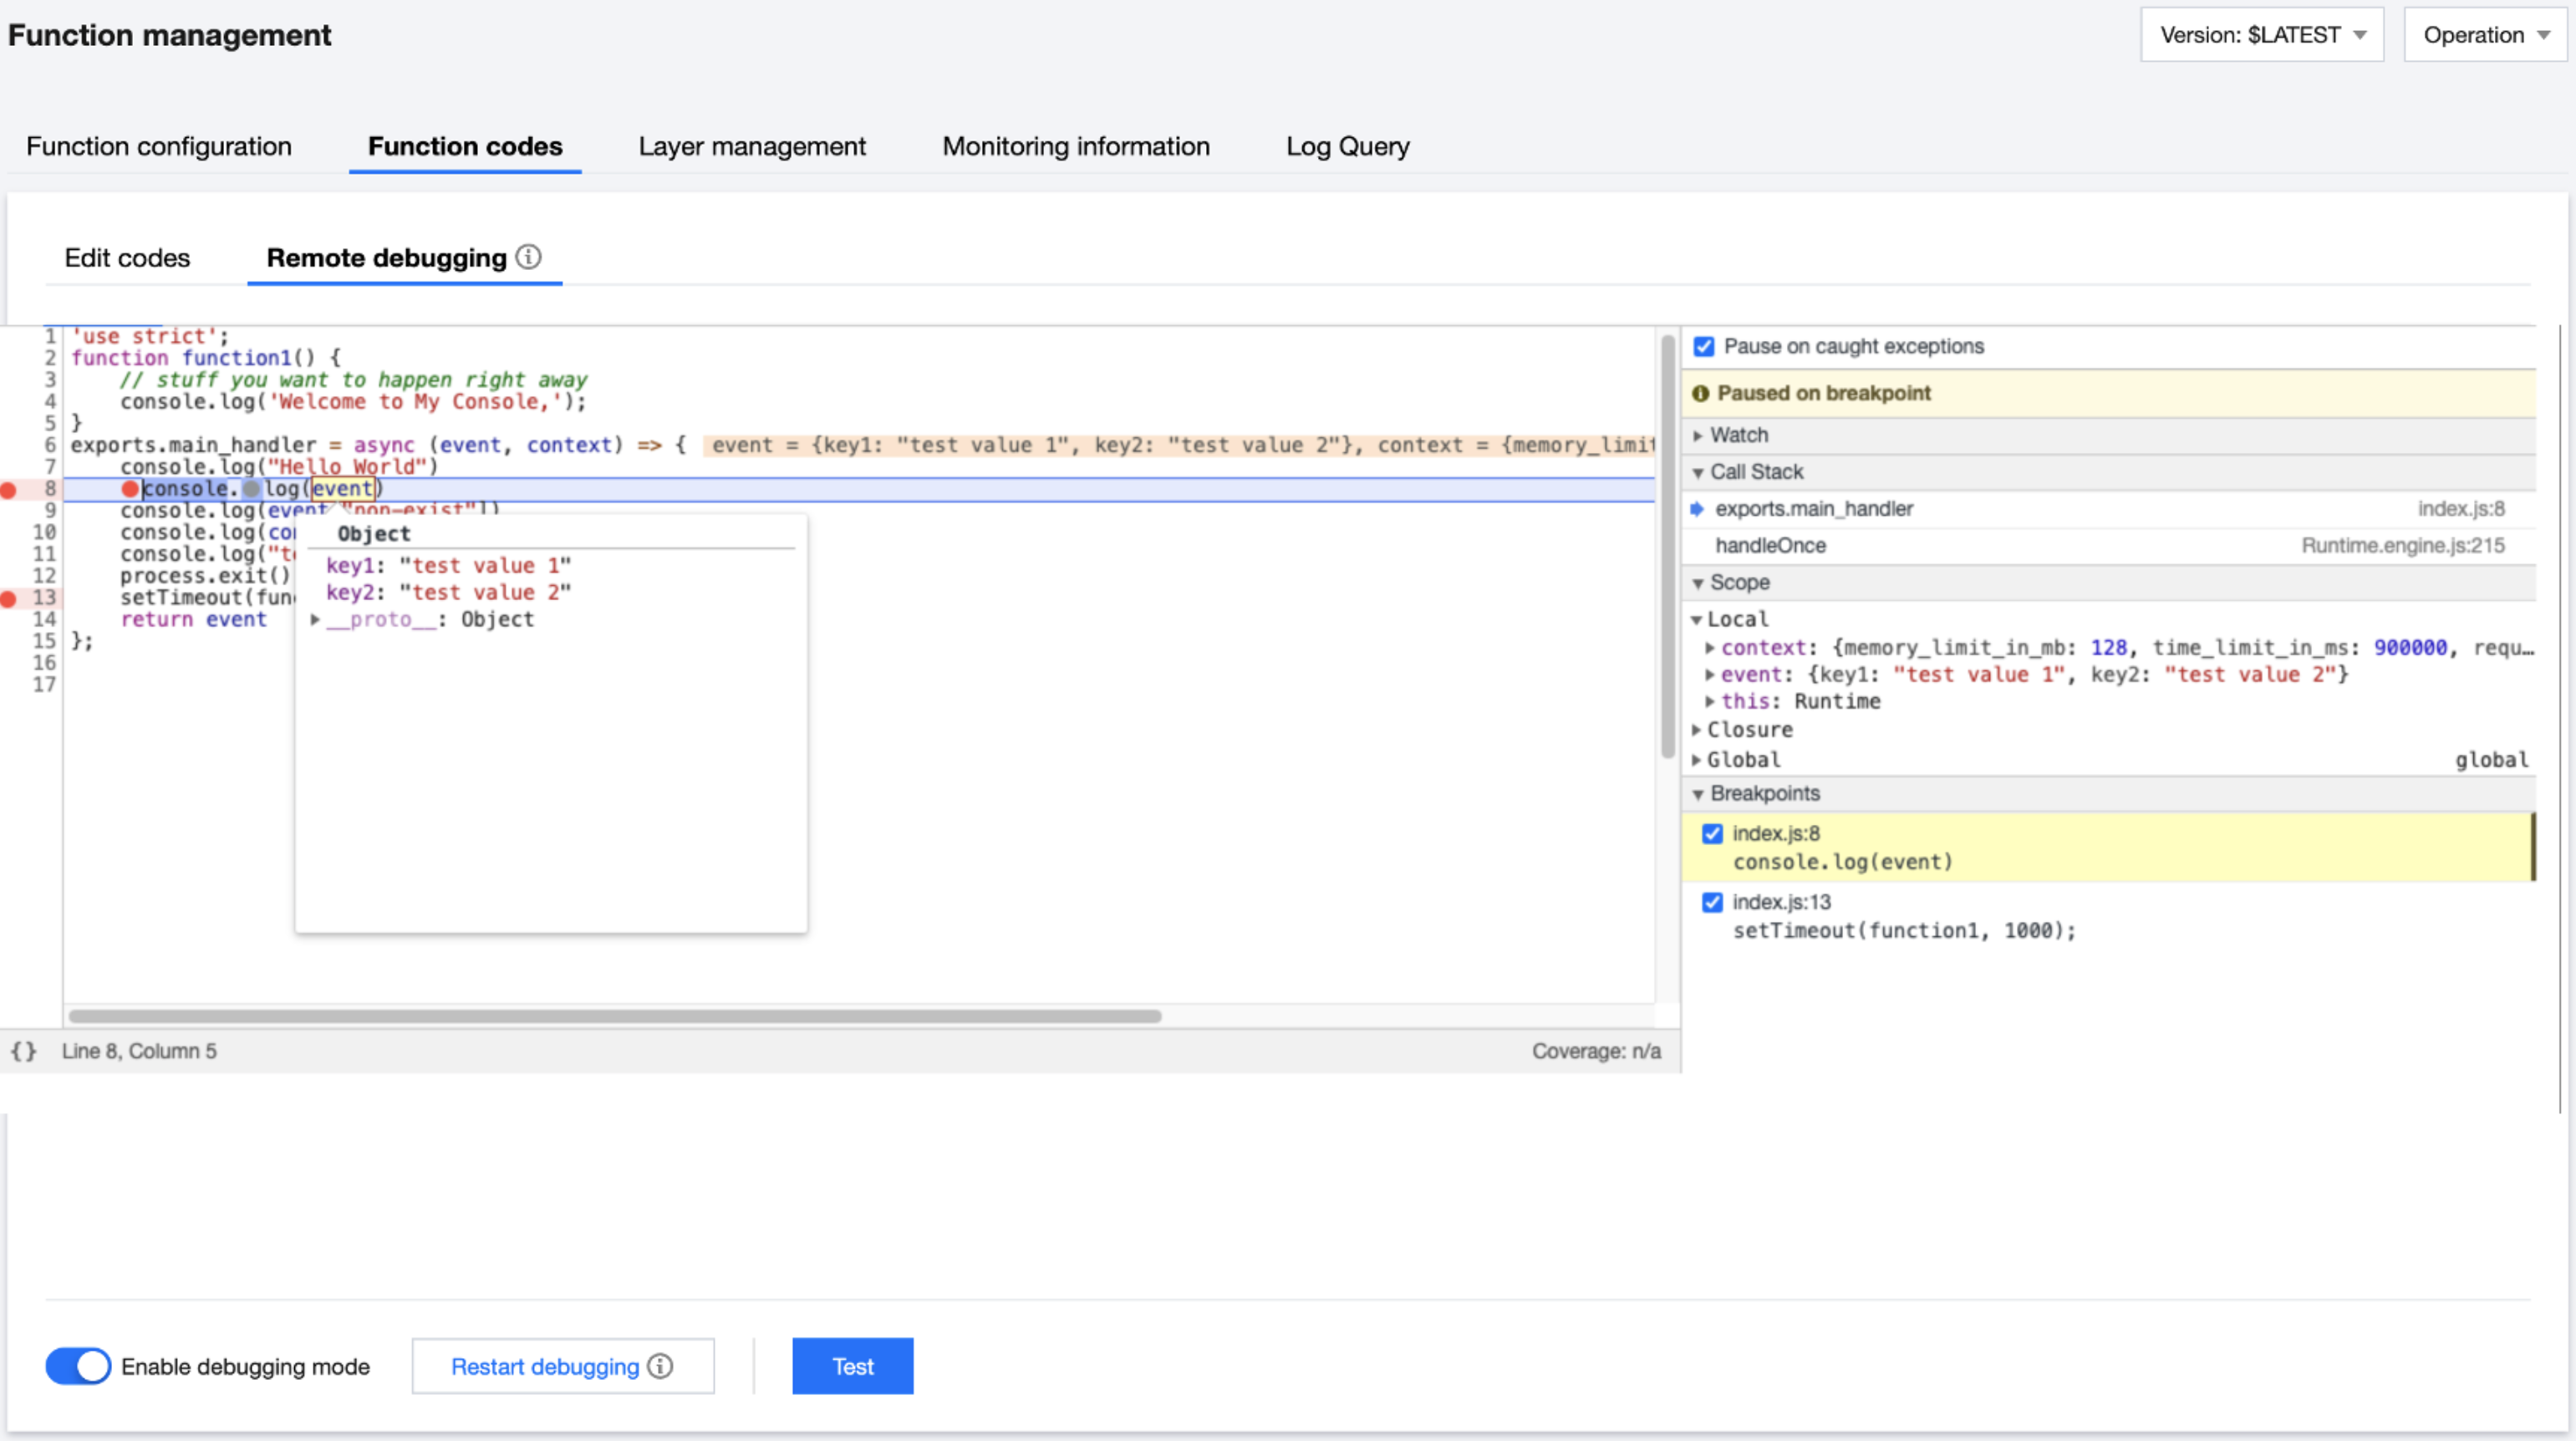
3. You can set breakpoints as needed and click Test to trigger a test based on the test template. As shown in the figure below:
Explanation
For more information about debugging tools, refer to Chrome DevTools.
Exit Debug Mode
1. In the Function management page, select Function codes > Remote debugging.
2. By turning off the Enable debugging mode button, you can exit the debug mode and the function configurations will be restored.
Note
Modifications made to the code on the debugging page will not be synchronized to the cloud. If you need to save the modified code, please save it and use the online code editing feature.
Troubleshooting
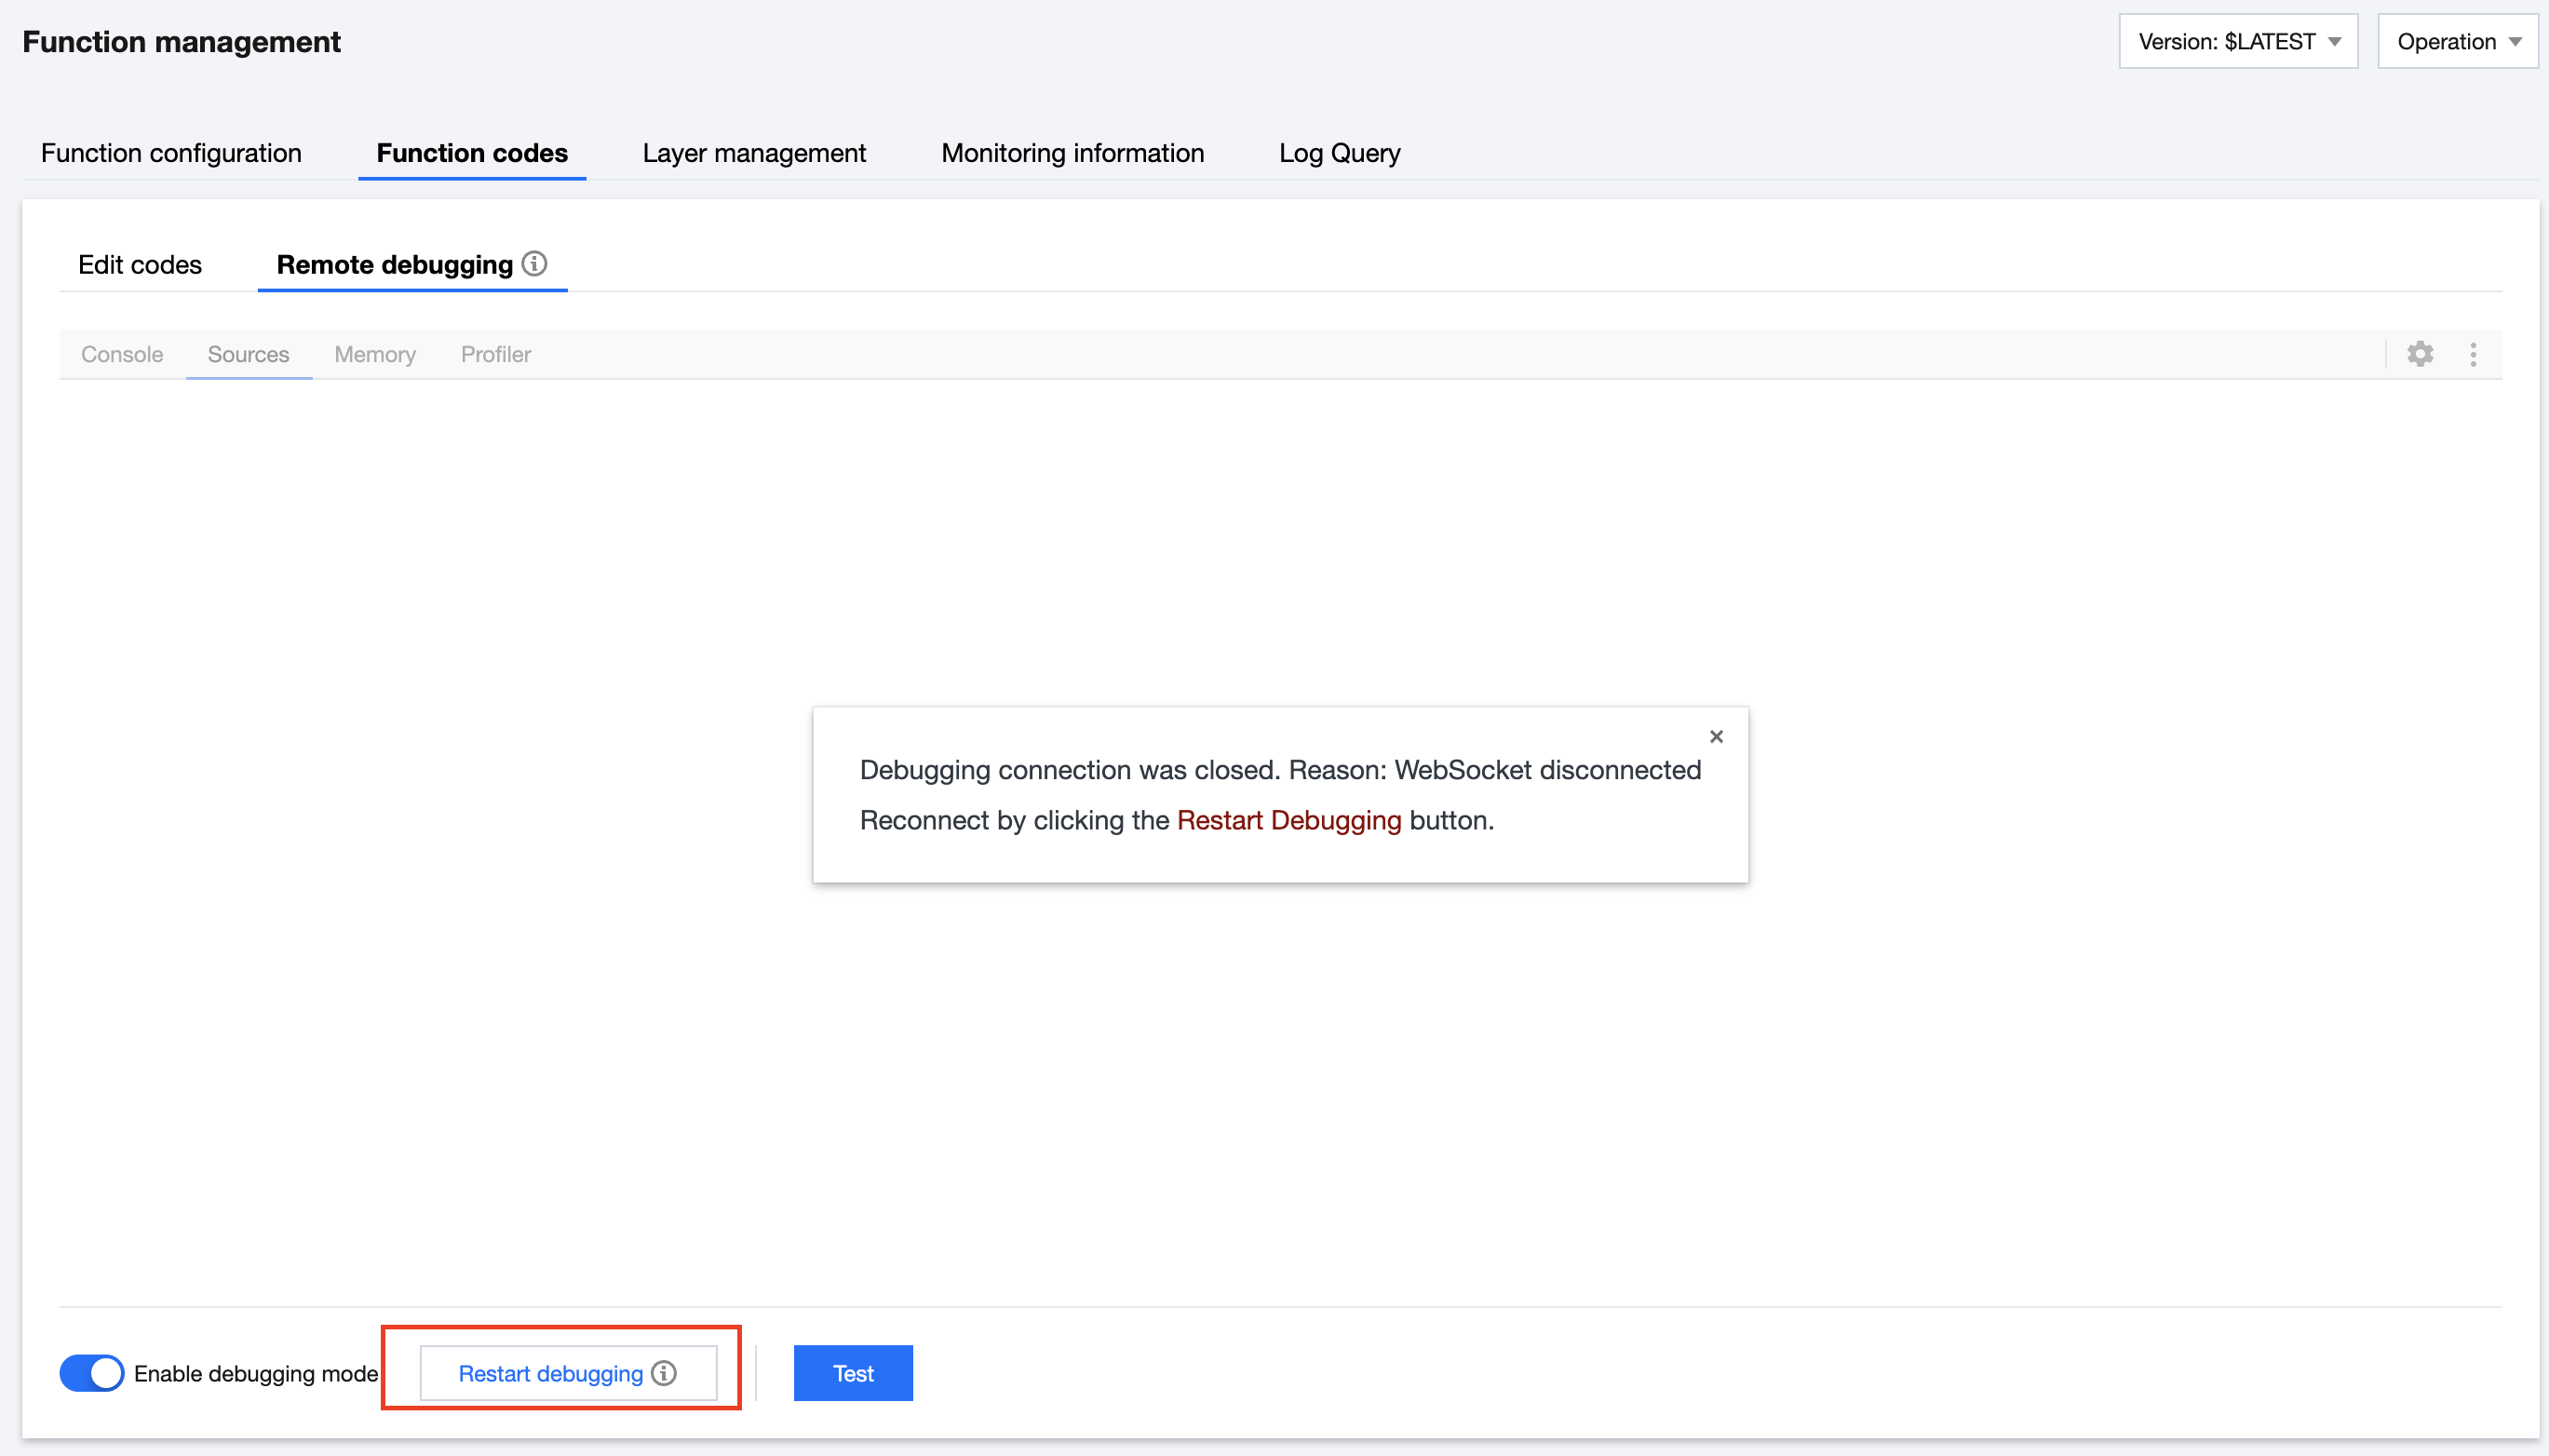
Due to network issues or code anomalies, the inspector might disconnect. If you encounter a situation like the one shown below, you need to click on Restart debugging to reconnect.
If your function runs normally but encounters an Out Of Memory error in debug mode, you need to increase the memory configuration of the function. This will resolve the issue of insufficient memory caused by the increased memory requirements of the function when debug mode is enabled.