大屏场景中,指标卡可以快速展示核心汇总数据;自由画布模式下,文本组件结合变量的使用可以丰富指标卡的展现。
使用场景:定制丰富效果的指标卡。
版本支持:基础版及专业版。
通过本文介绍,您将了解到:
变量的使用流程
变量的使用技巧
常用的三种指标卡制作
变量的使用流程
变量是一个“隐藏”的分析图表,包含了丰富的数据内容;
腾讯云 BI 支持三种类型变量:
页面变量:仅作用于当前页面,其他页面无法使用;
项目变量:用于整个项目,在项目内可被引用;主要用于获取项目公共数据(如定义一个项目共用的“项目名称”);
系统变量:用于整个团队,在该主账户下的所有页面都可以引用;主要用户获取系统提供的一些参数,如用户昵称等。
本文主要使用页面变量来进行实践。
变量的使用由以下三步构成:
1. 创建页面变量
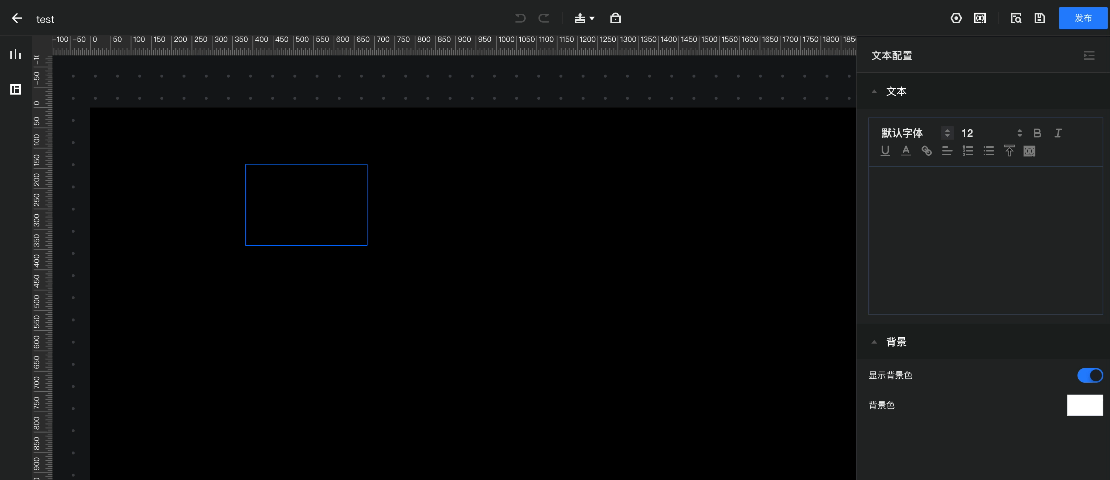
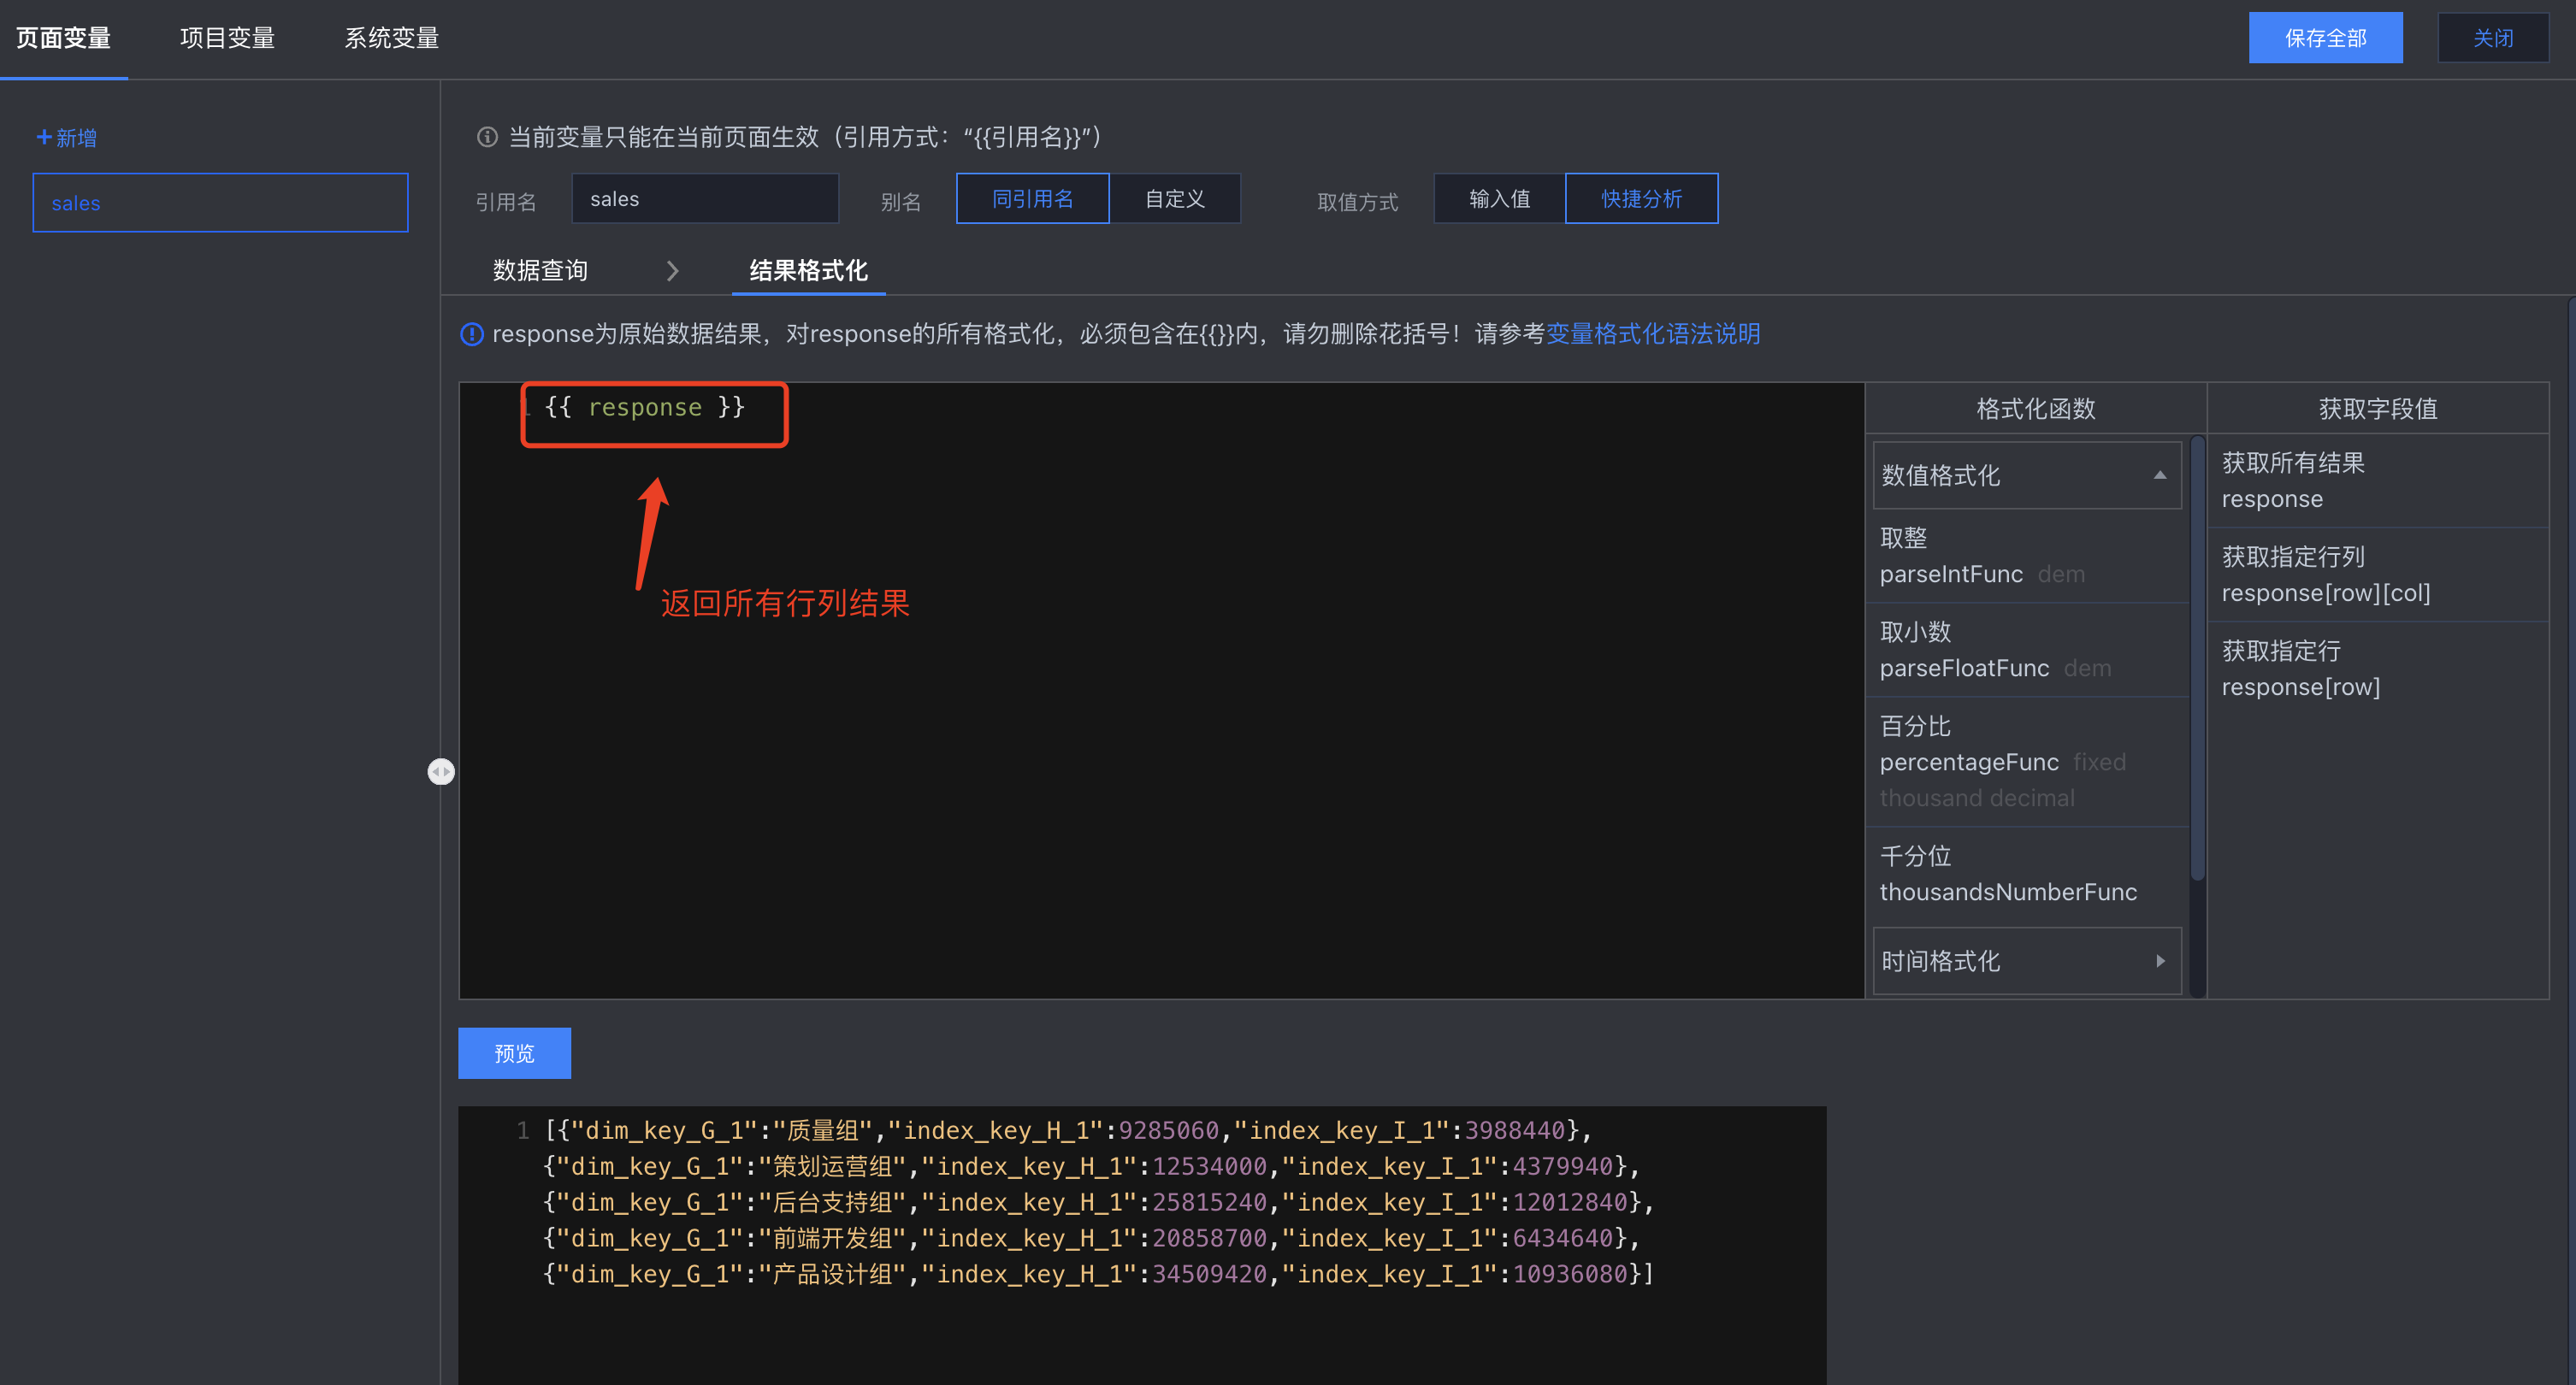
进入自由画布的编辑页面,单击右上角的“变量”icon,打开变量面板:
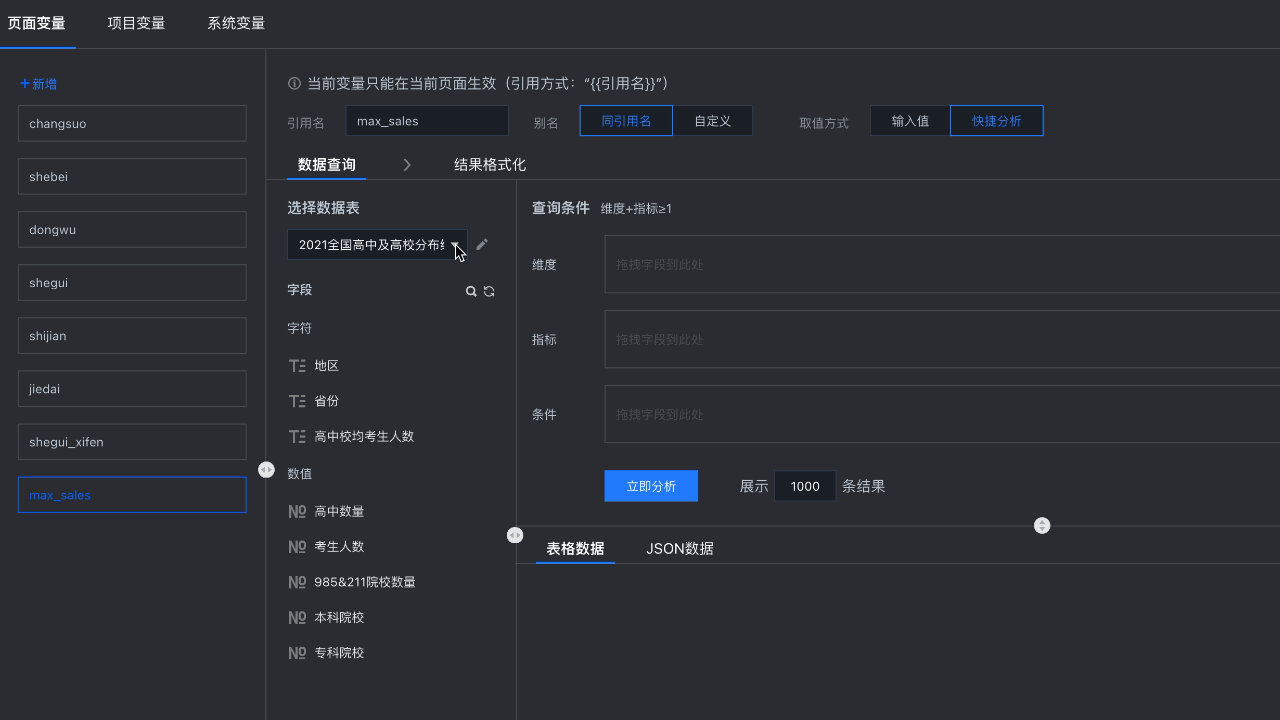
在“页面变量”页签,单击新增,新增一个页面变量:
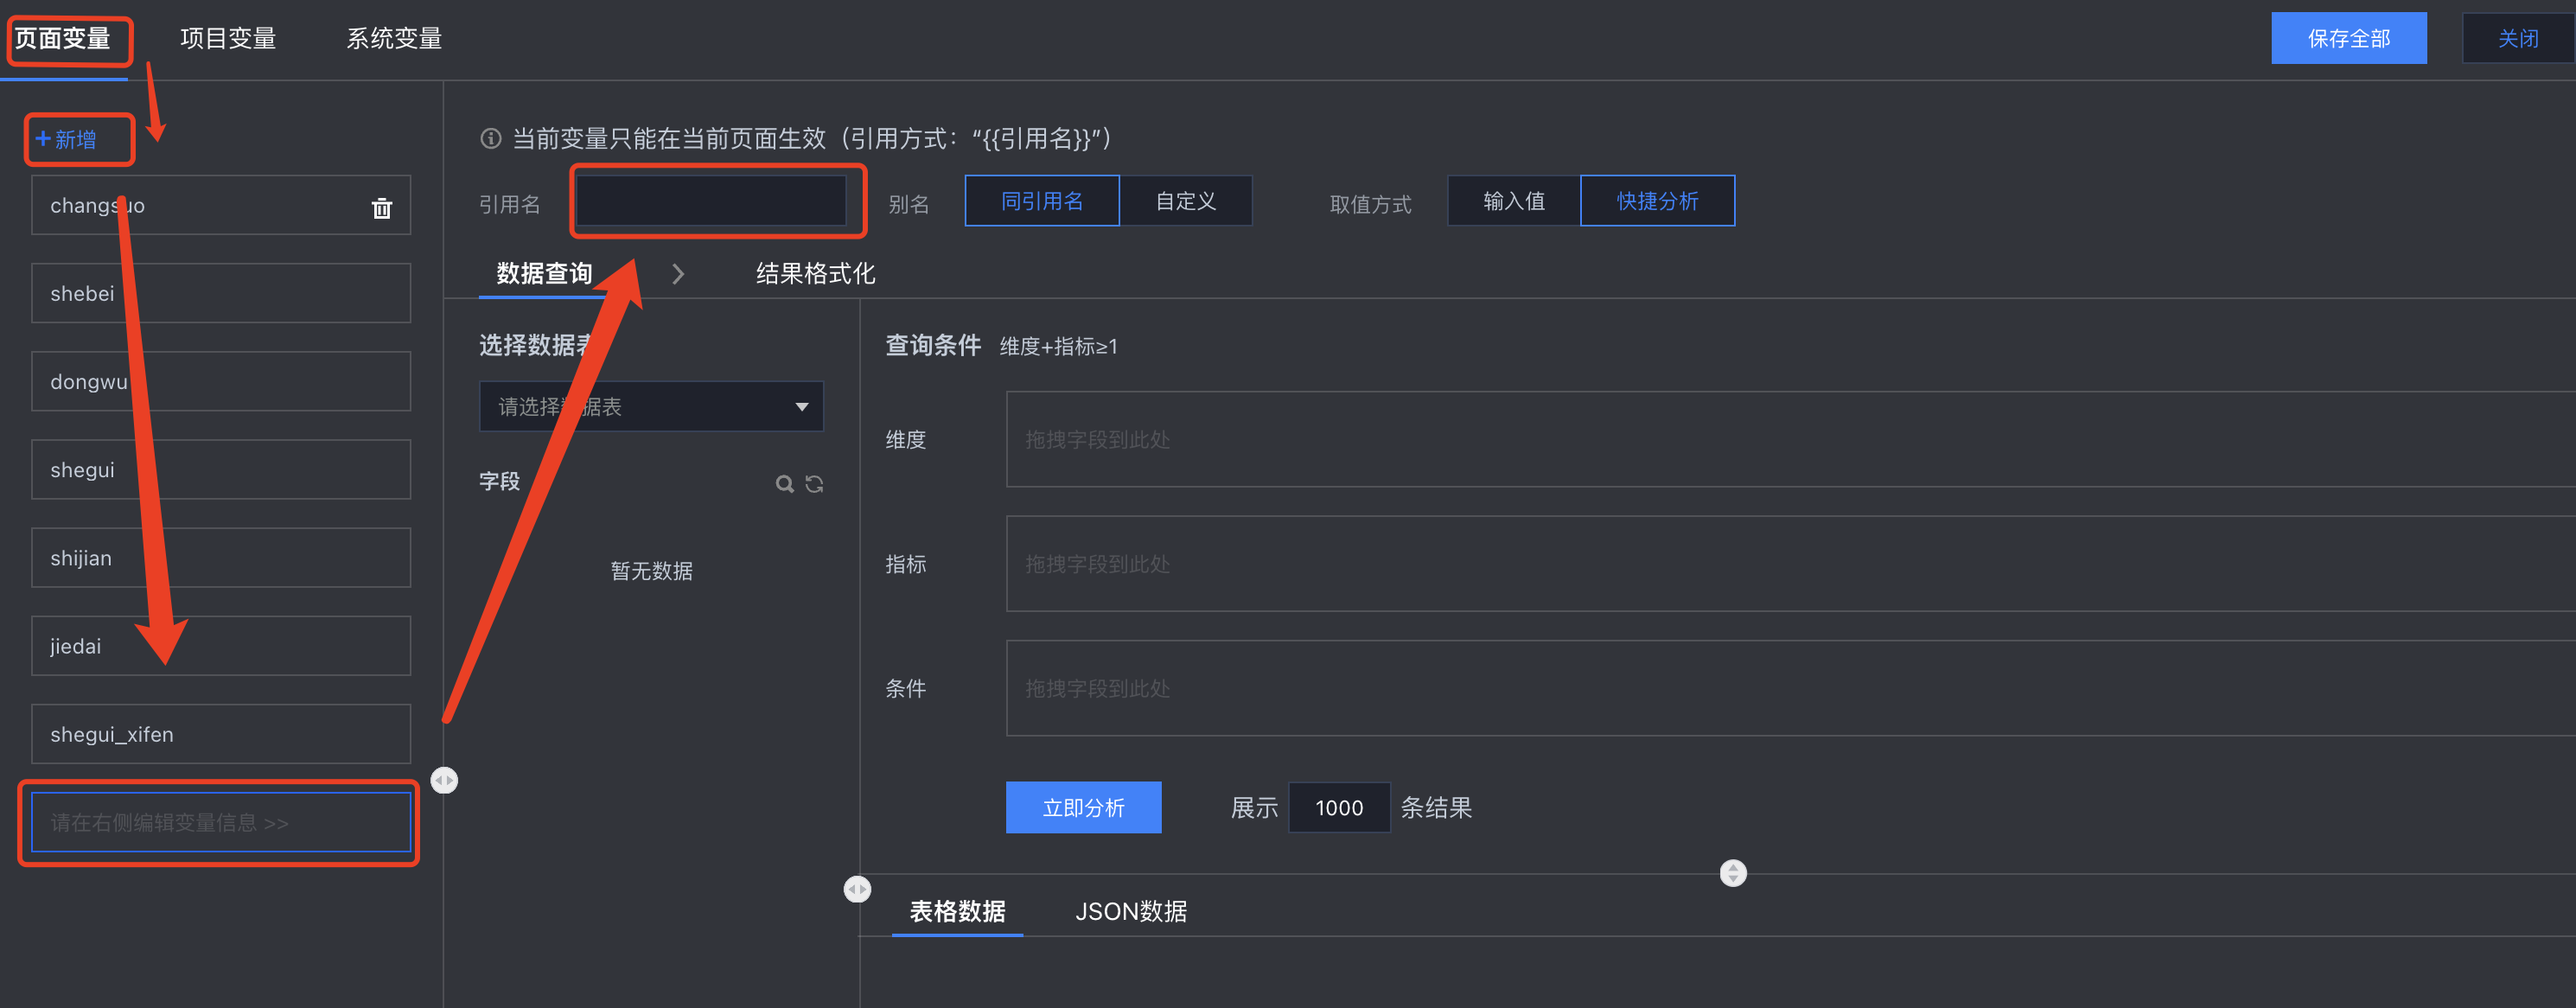
输入引用名,如“max_sales”,设置取值方式为“快捷分析”:
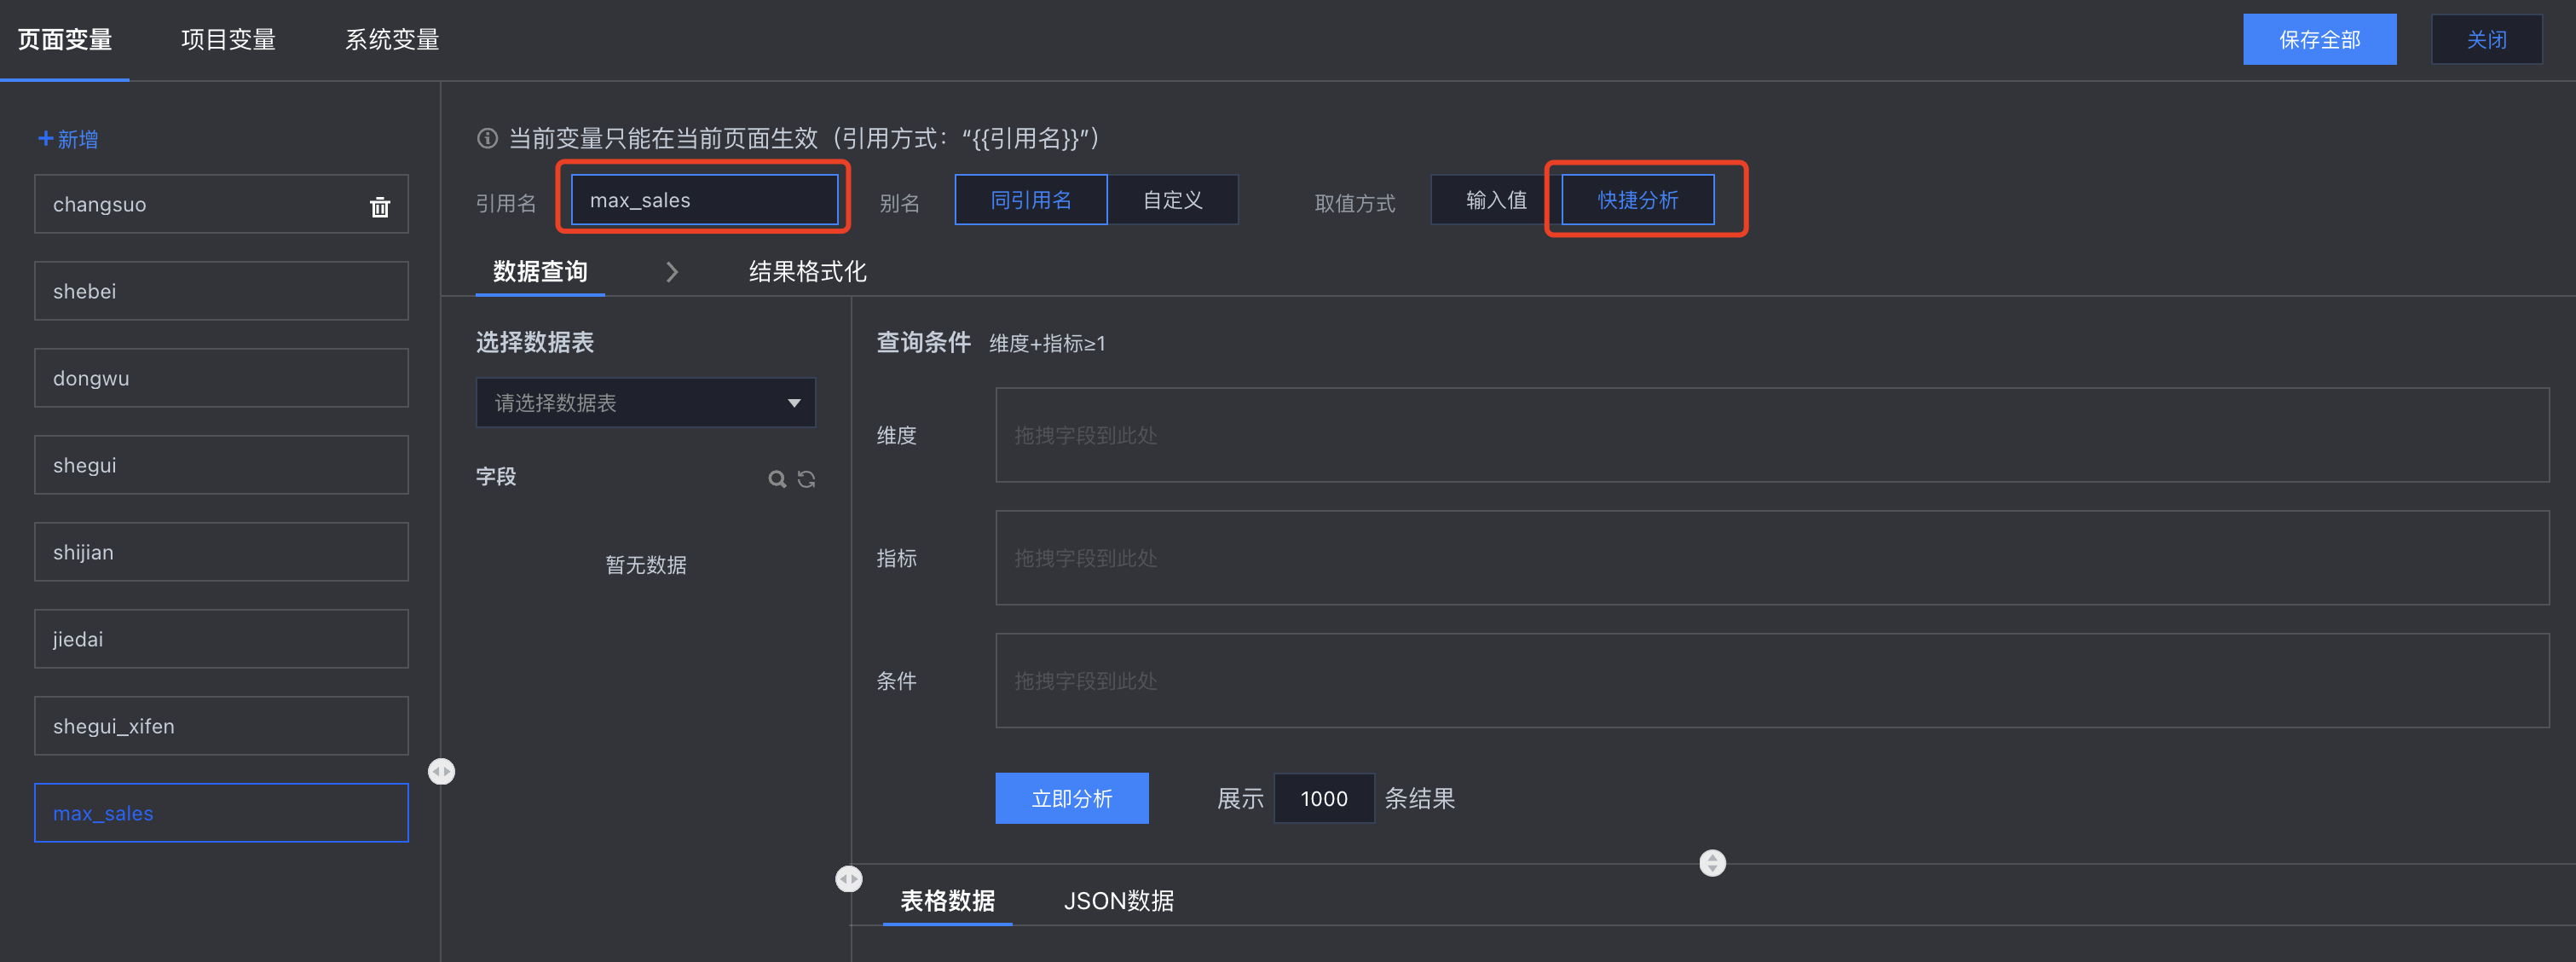
2. 设置变量分析
设置取值方式为“快捷分析”后,可以选择数据表,拖动字段到维度、指标分析框,进行计算分析(操作和图表一样)。
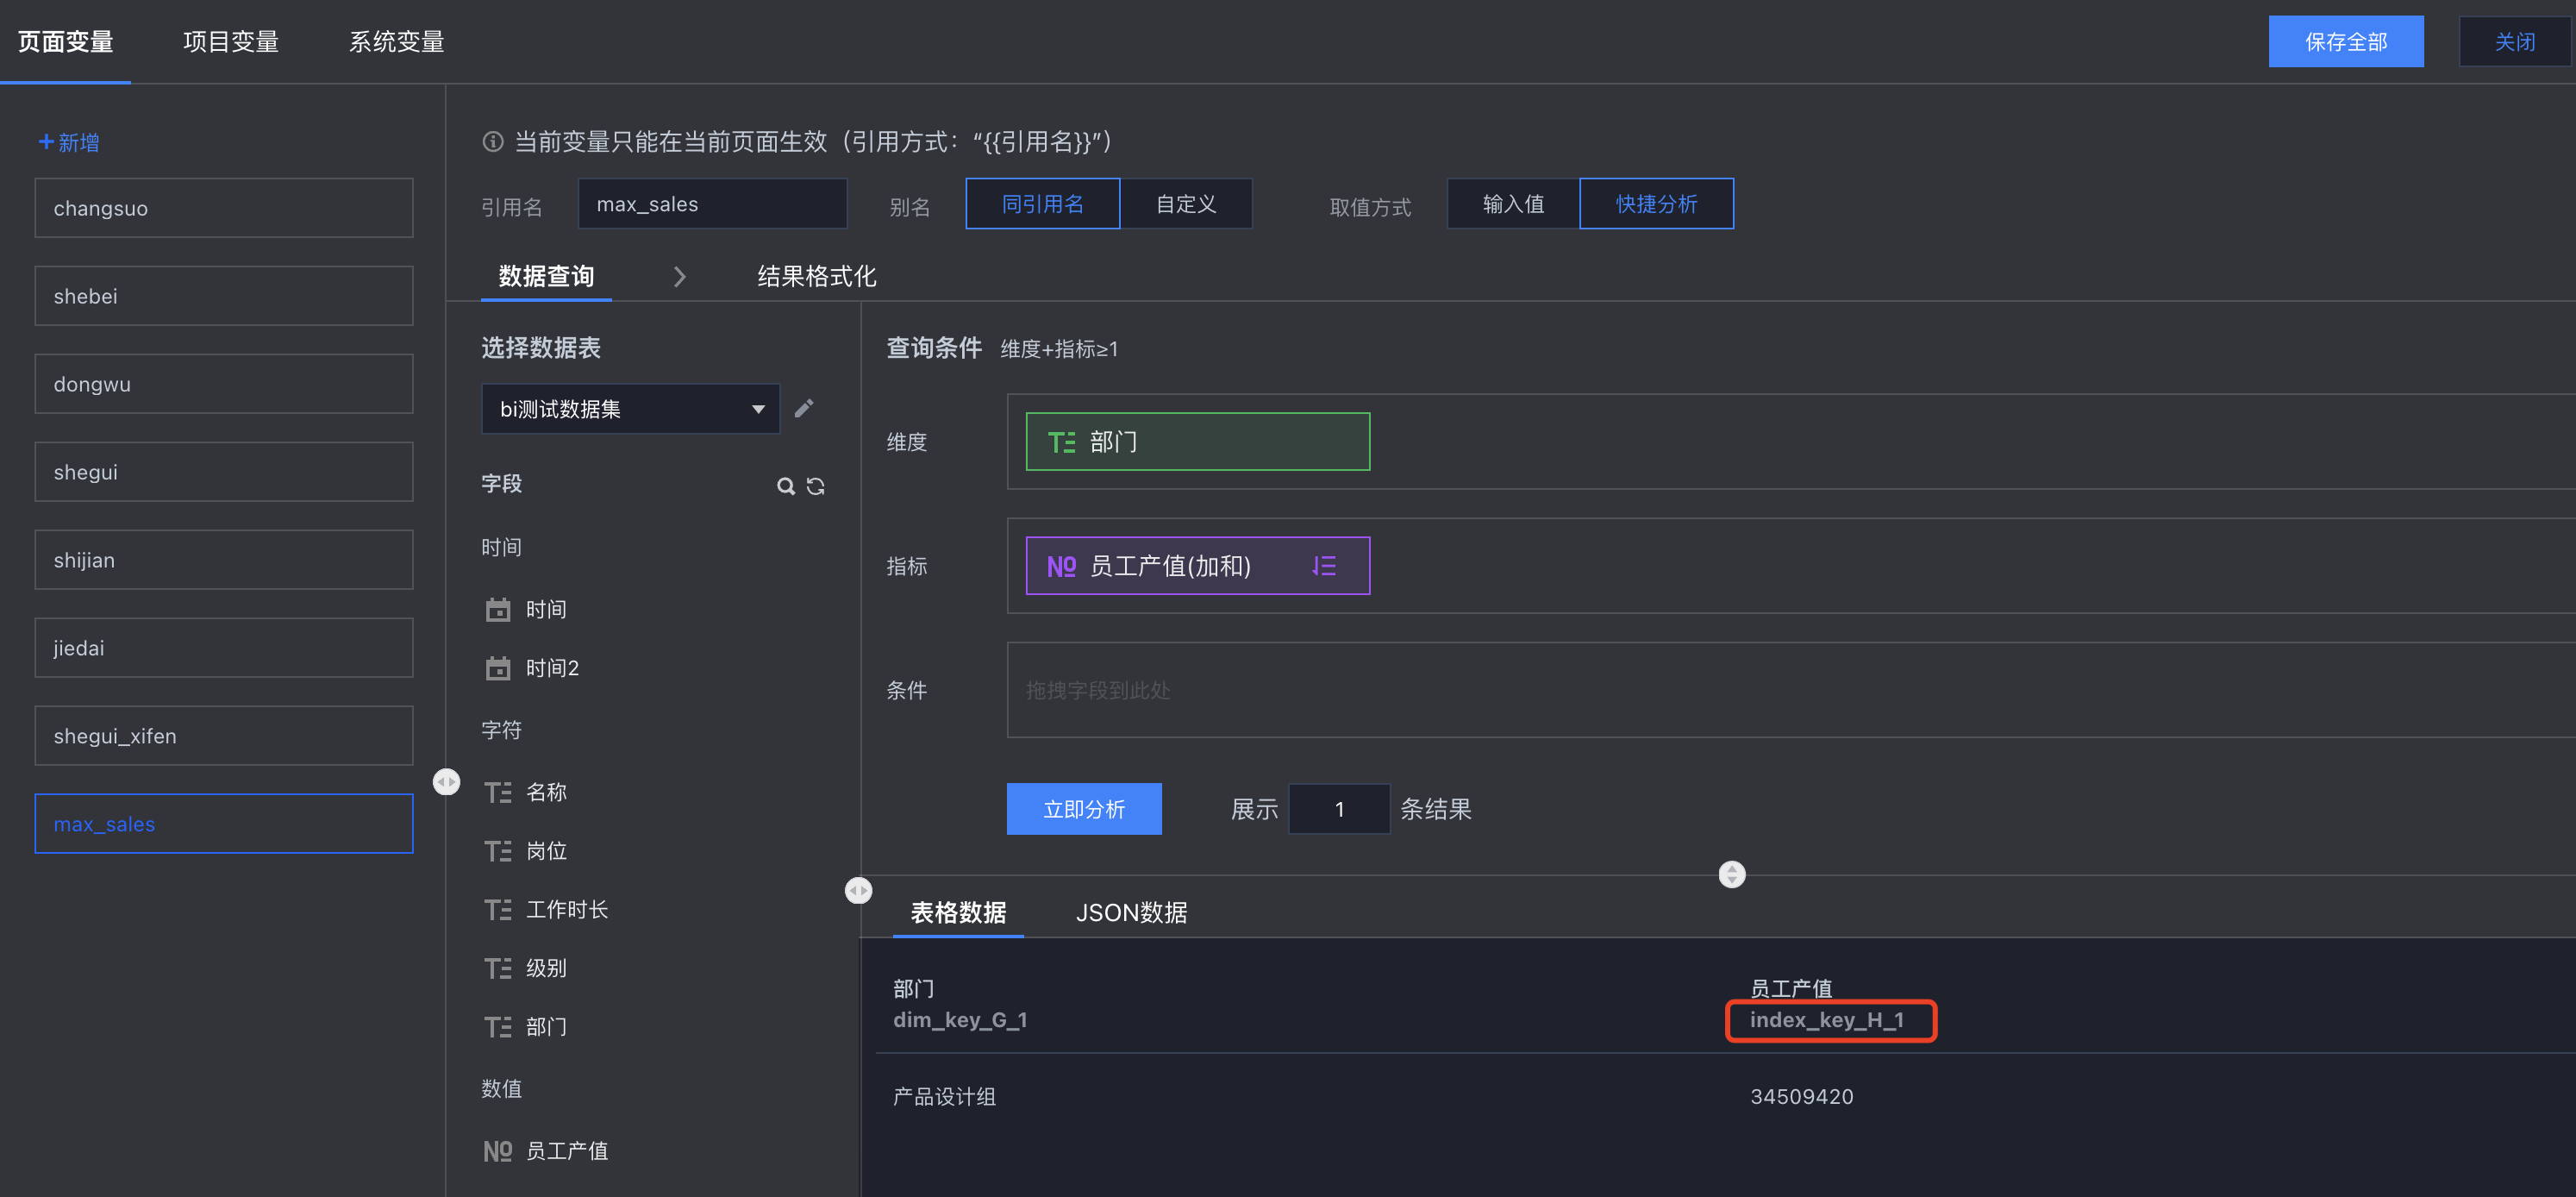
本例以最终“获得产值最大的部门”为例:
选择“BI 测试数据集”,将“部门字段”、“员工产值”字段分别拖入维度、指标分析框;
对“员工产值”进行倒序排列,获取产值倒序的所有部门;
设置展示结果为“1”,只获取最大的一条结果。
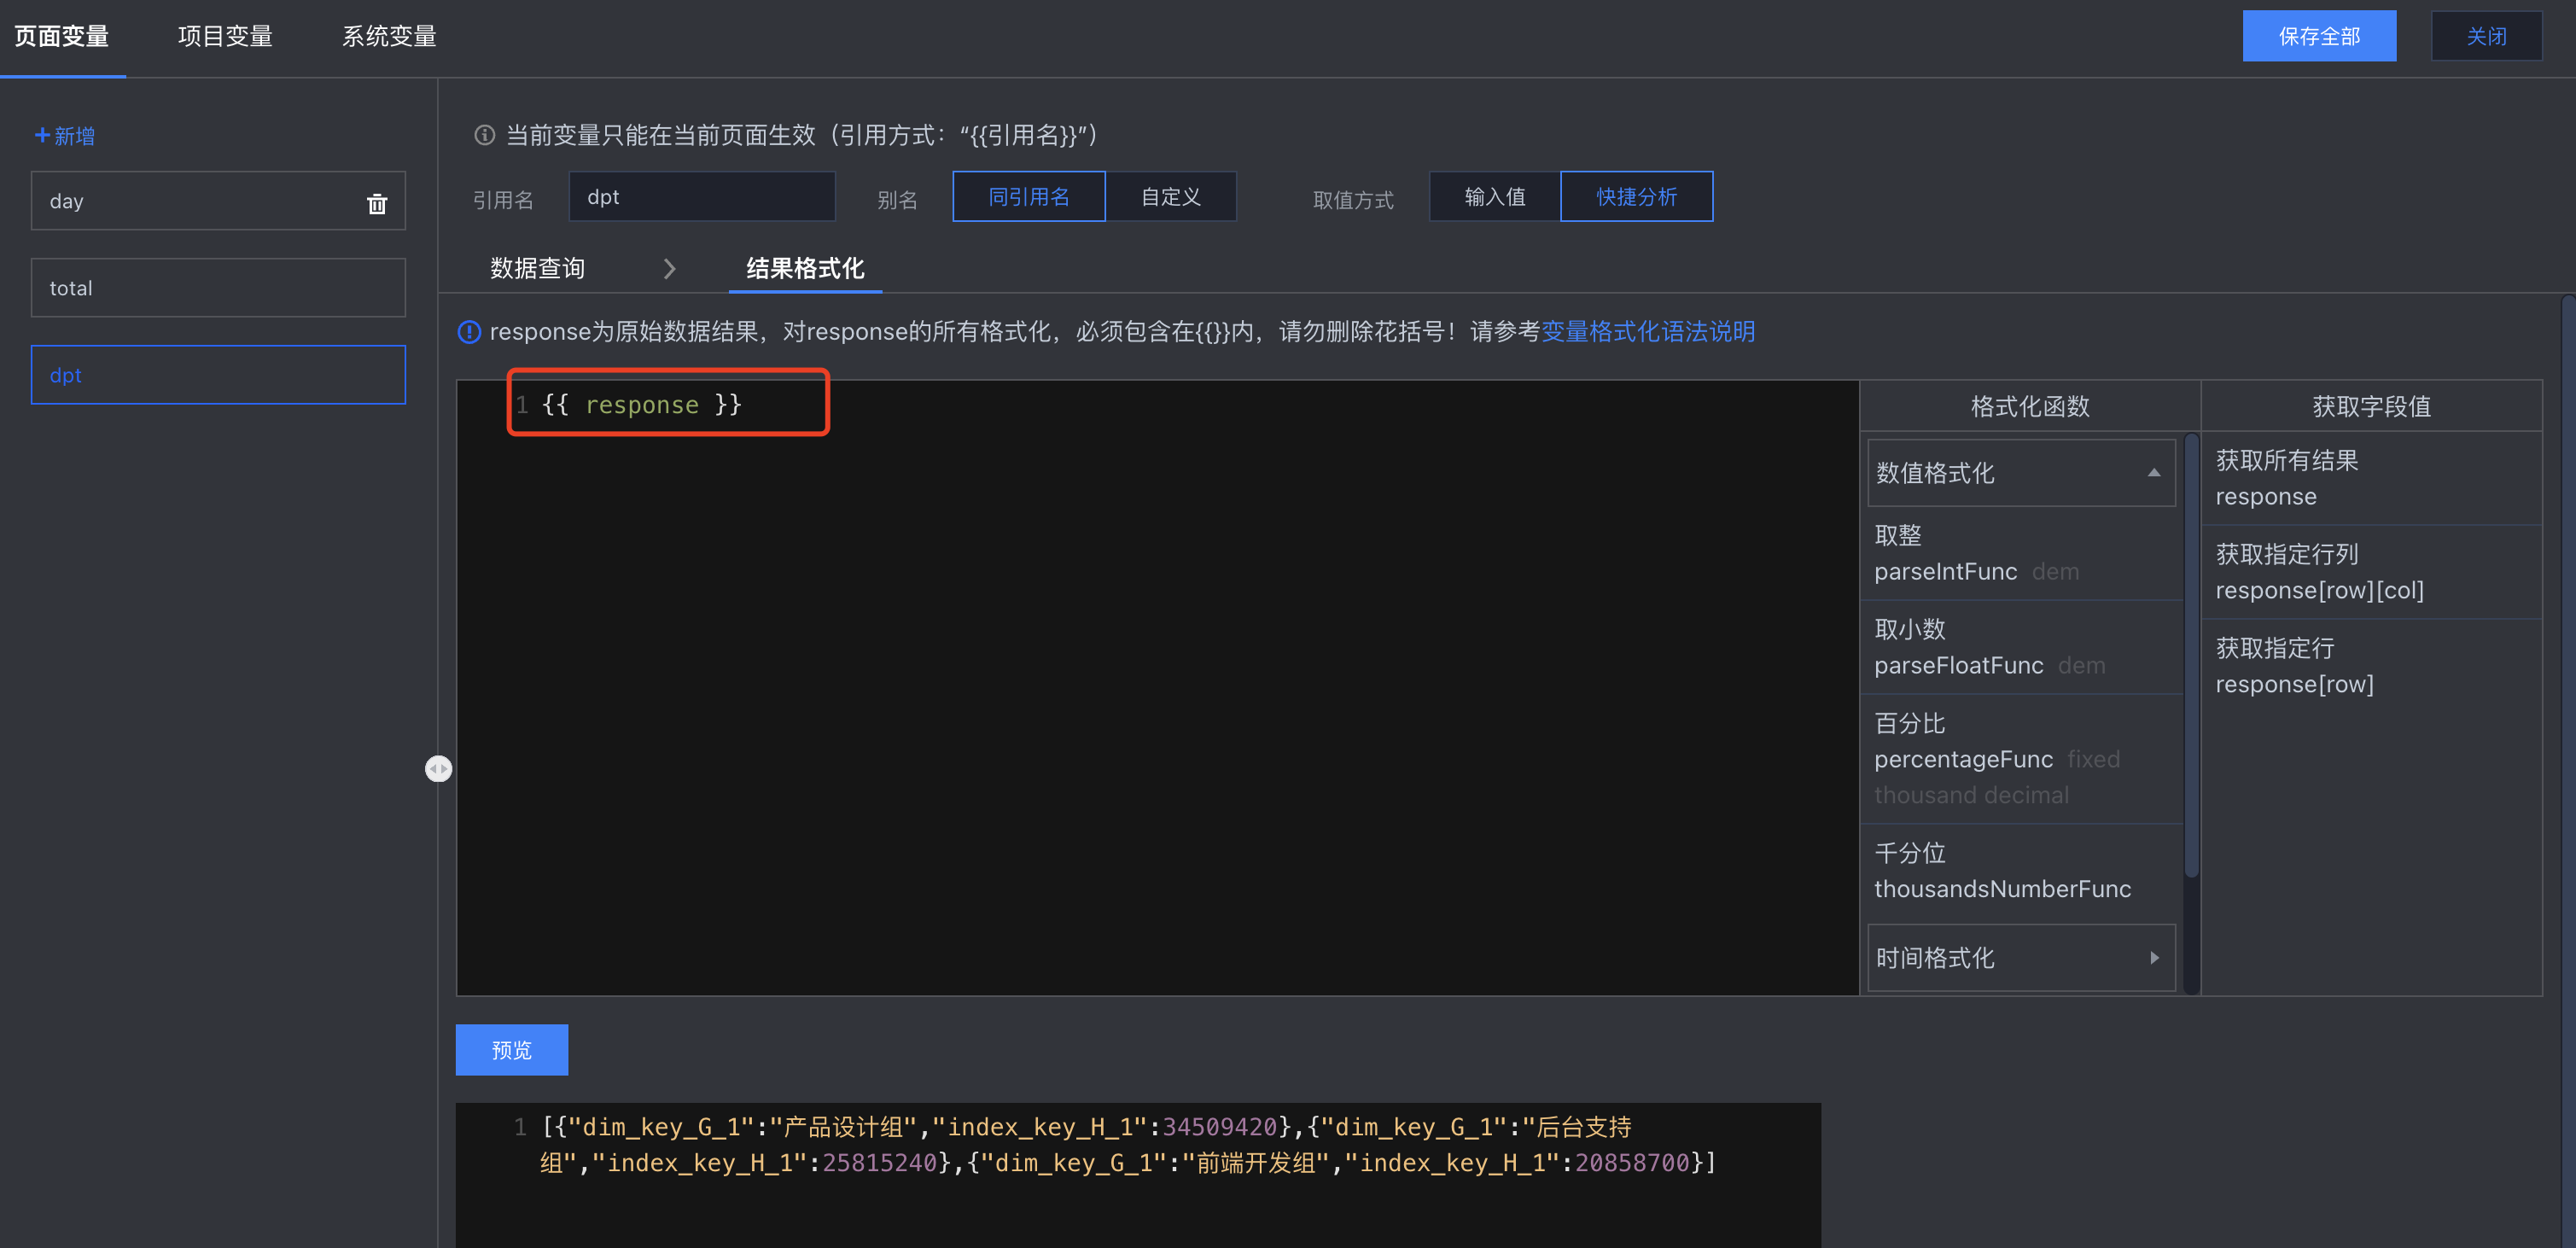
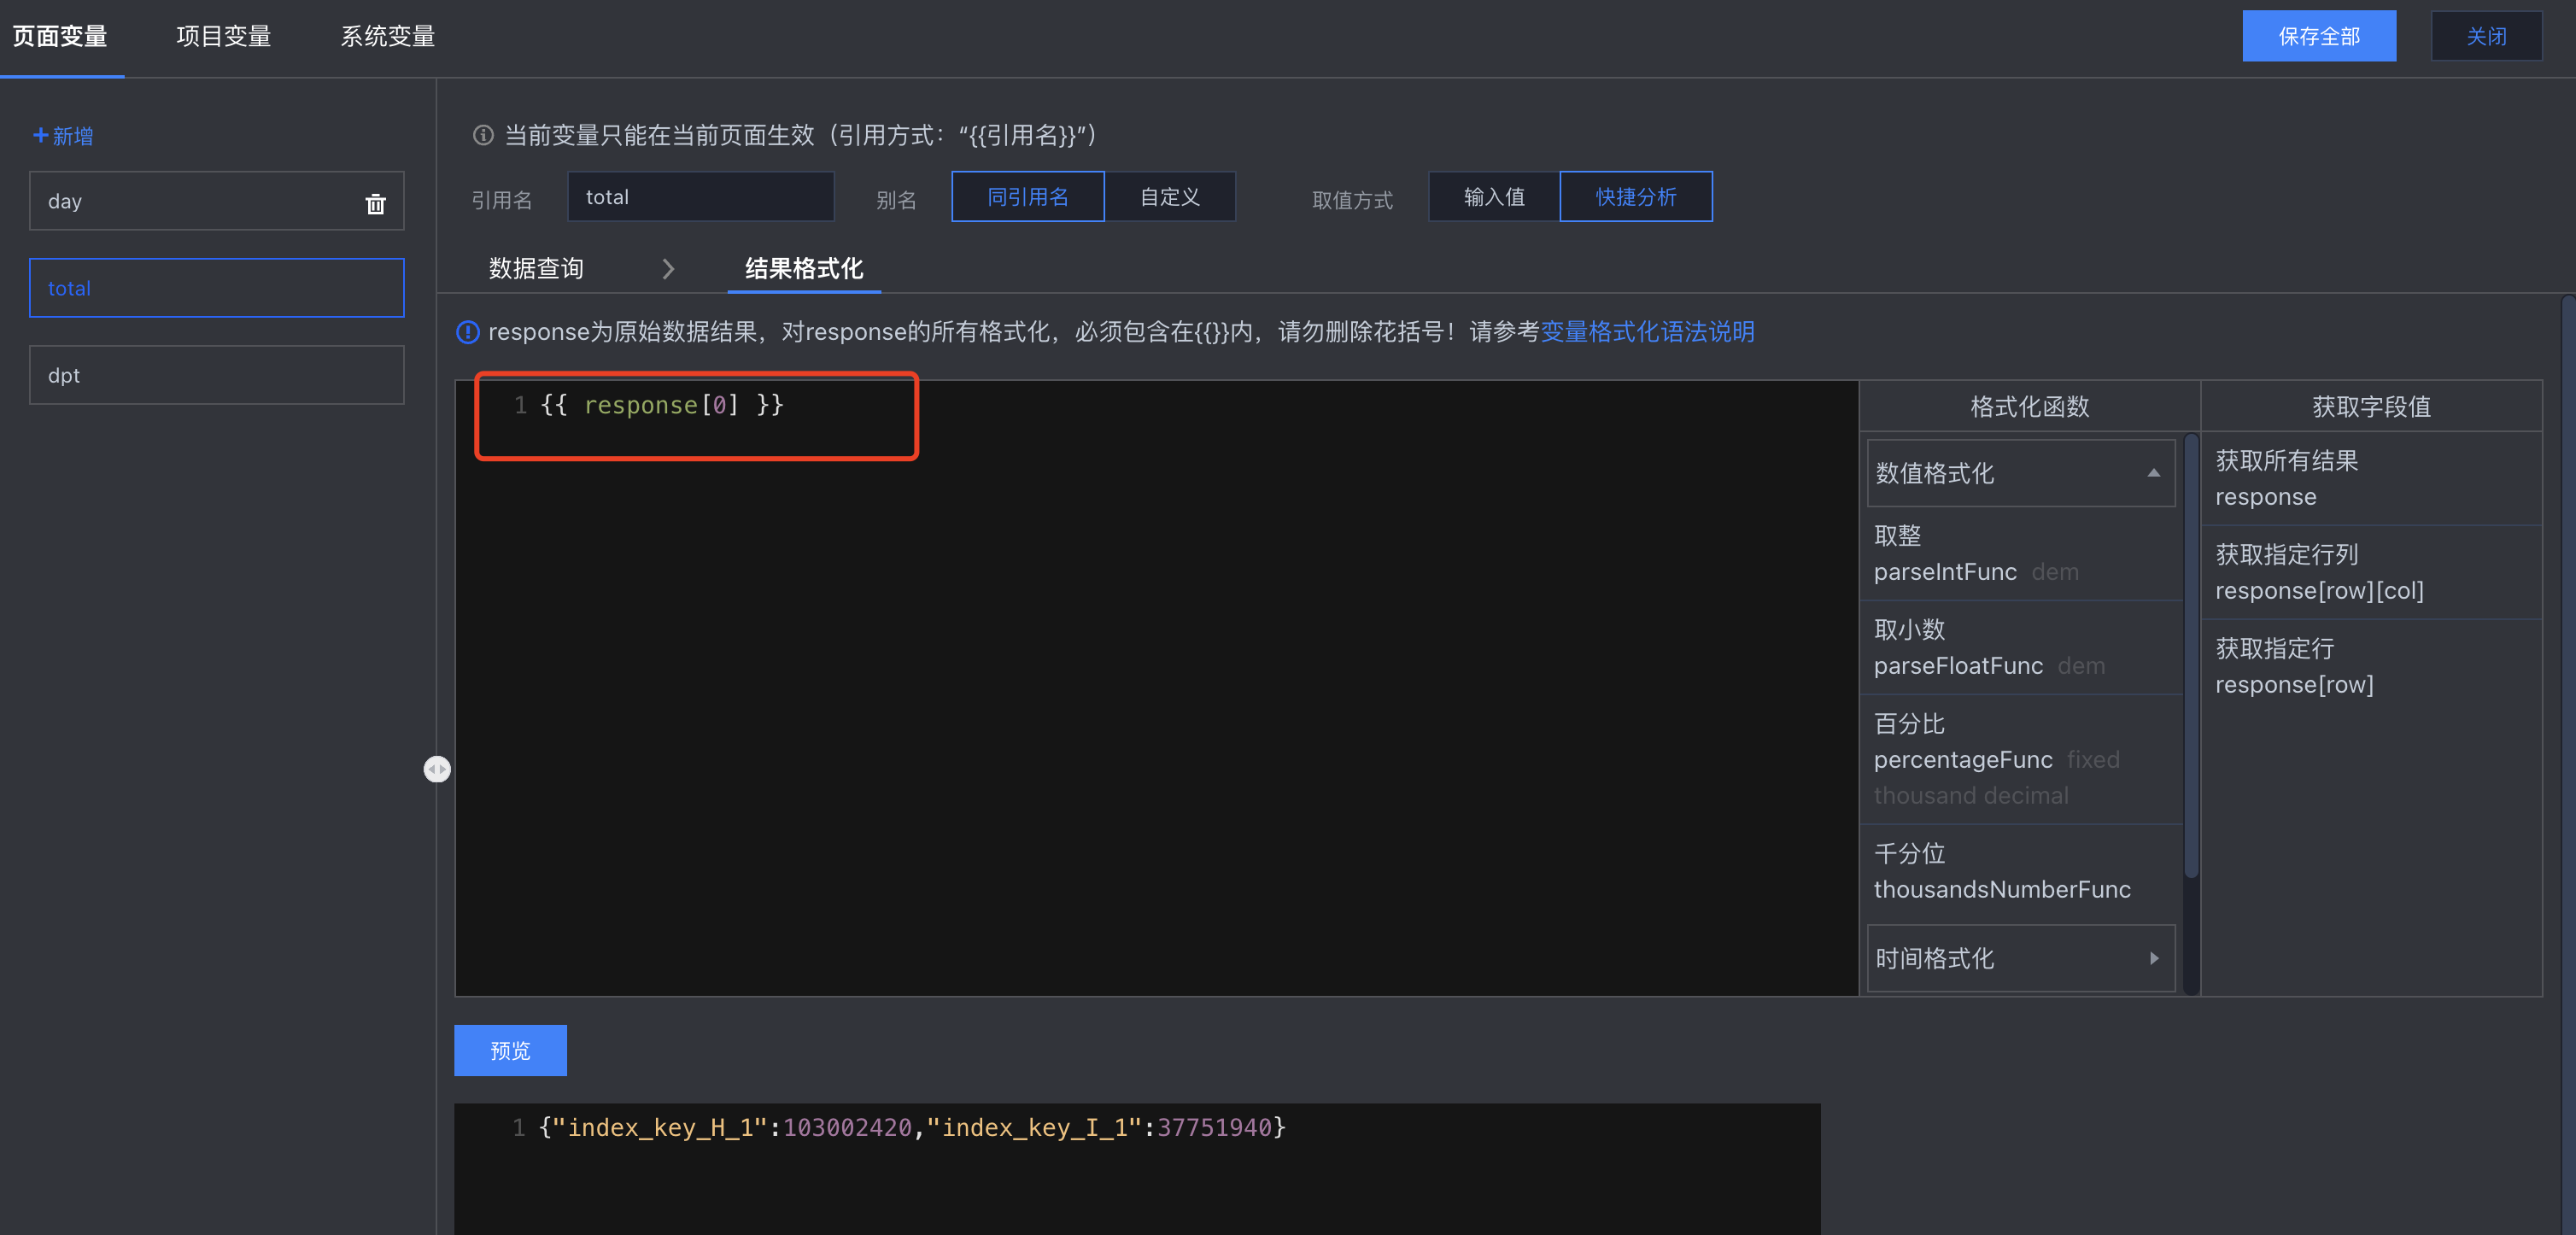
3. 变量结果处理
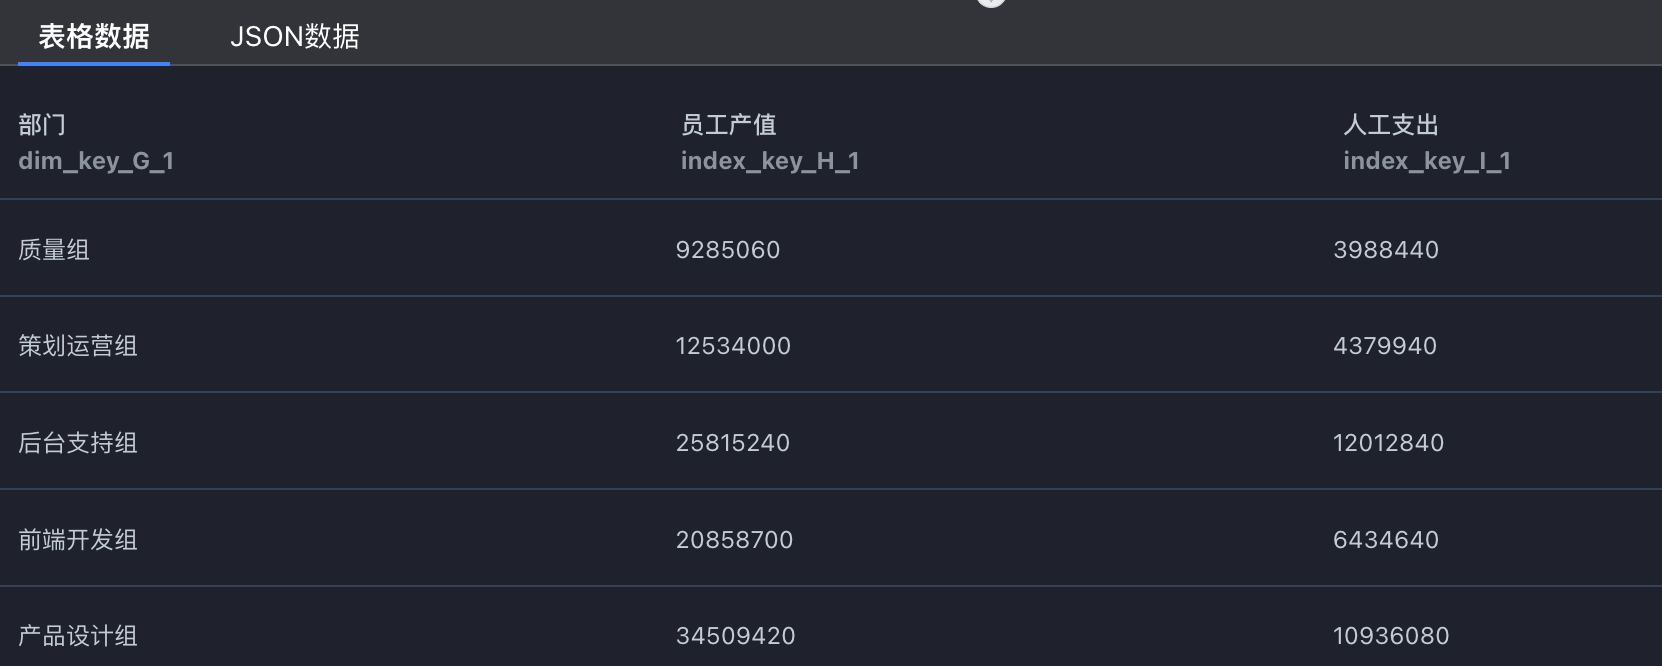
通过分析得到的结果为一个二维表,我们的目标是只要展示产值结果,且展示为千分位值。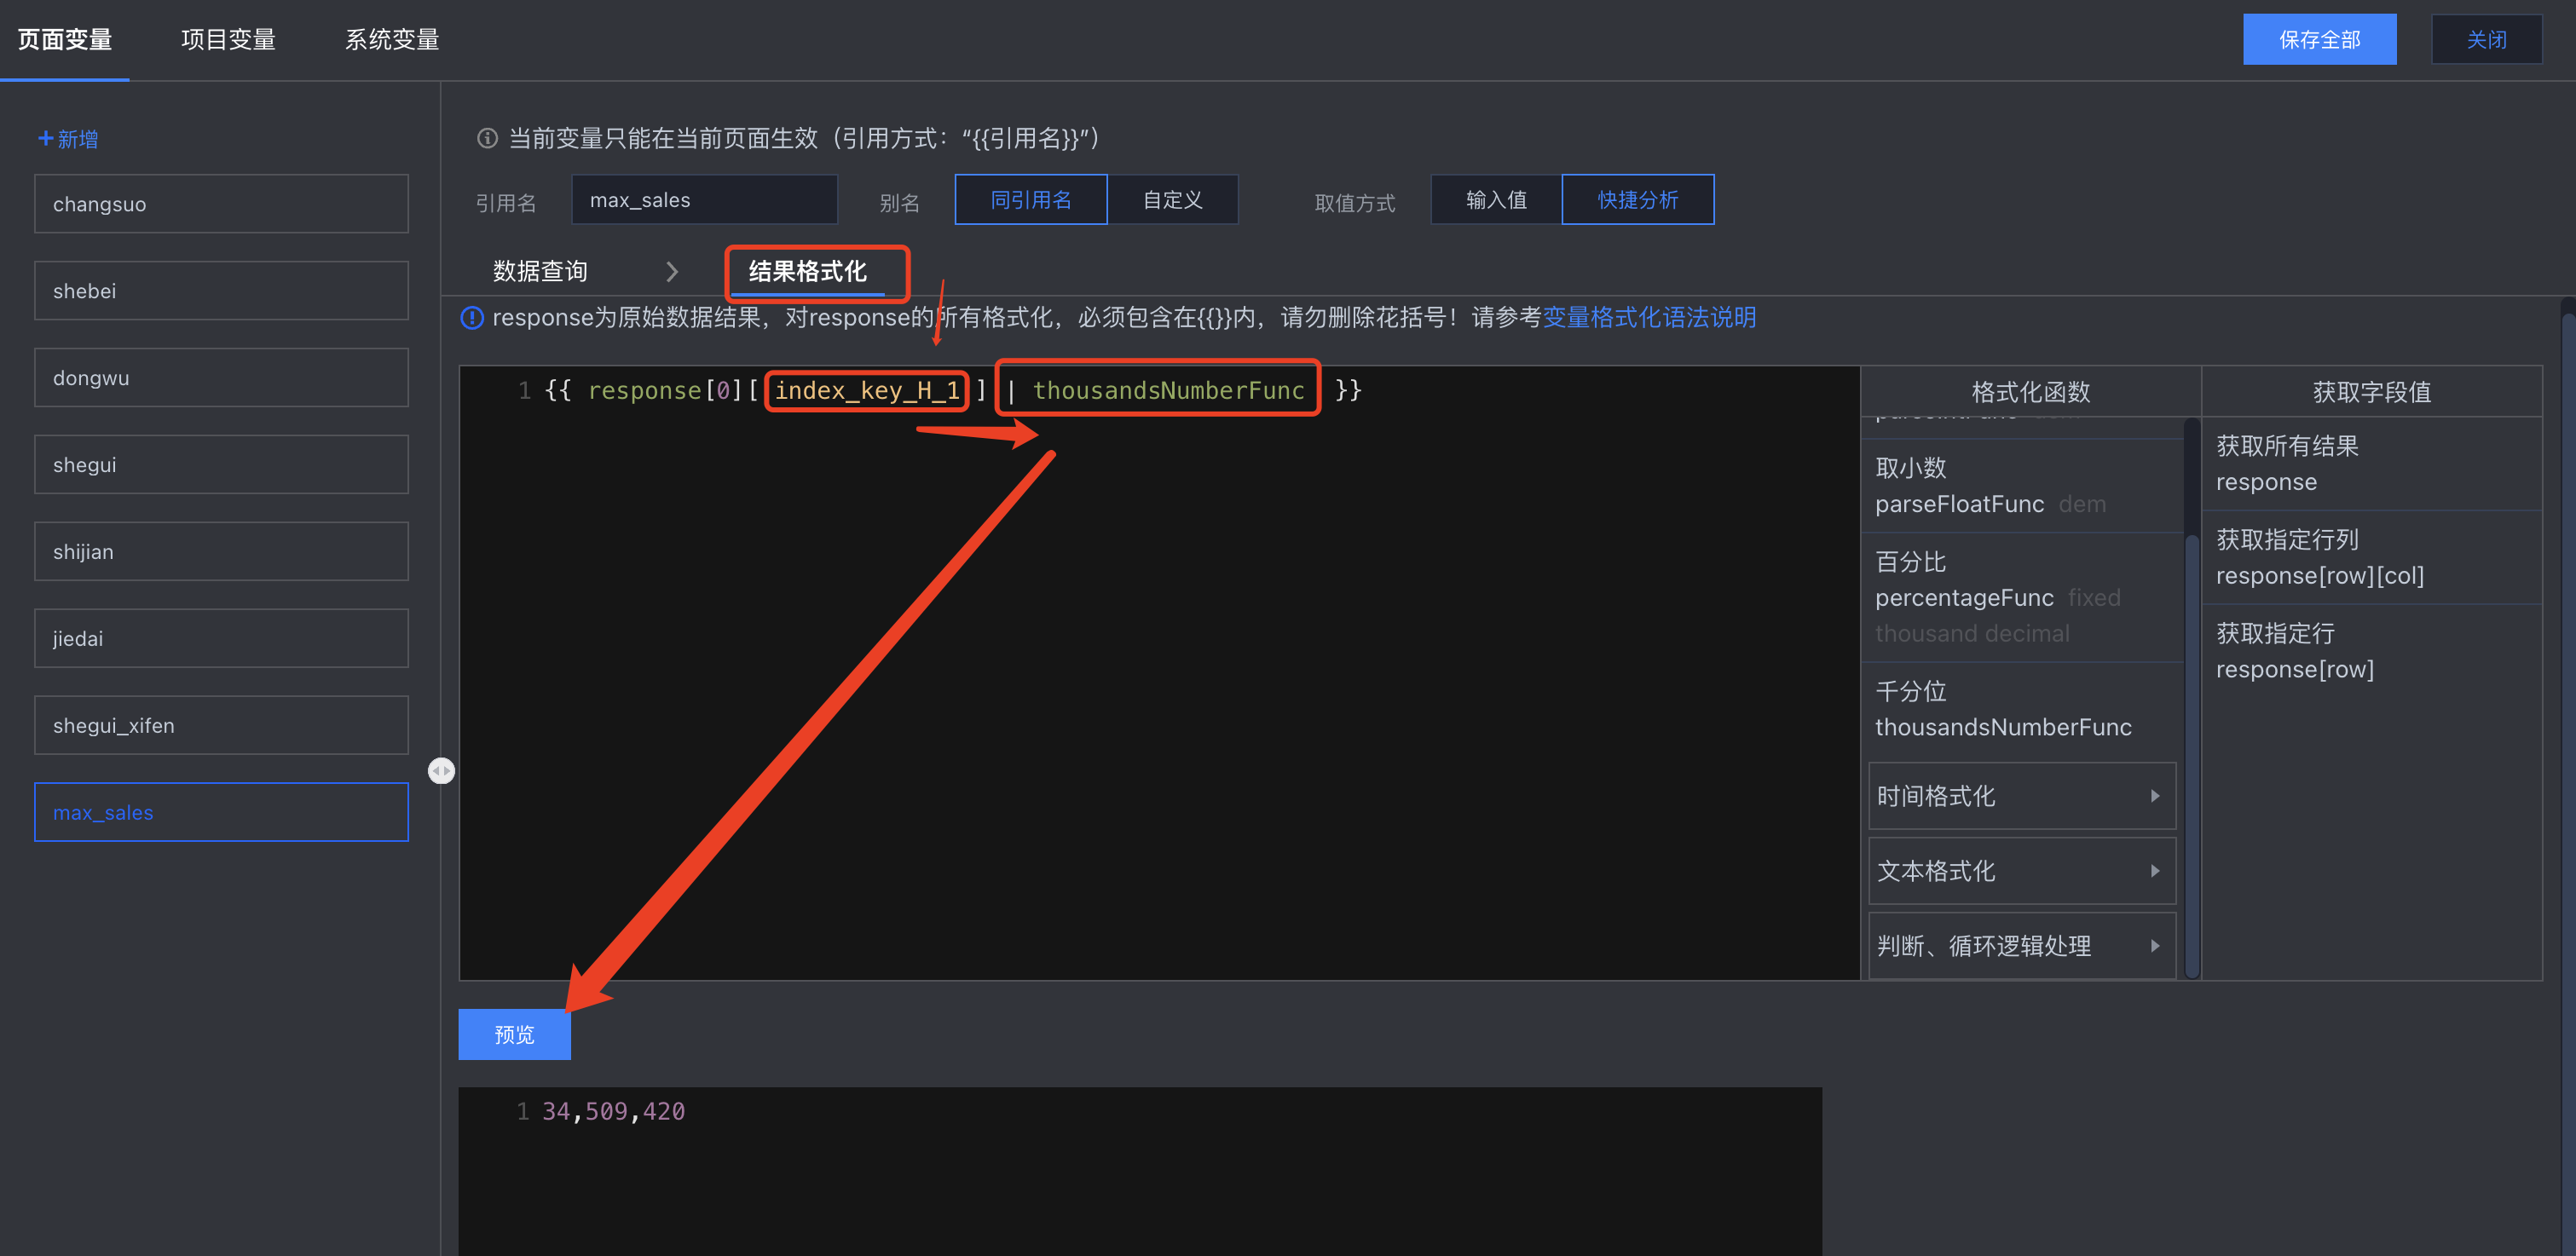
单击结果格式化,对结果进行处理;
获取到第一行的第二列“index_key_H_1”的值‘;列名称可以在下图位置找到:
选择“thousandsNumberFunc”方法对结果格式化为千分位;
单击预览获取结果。
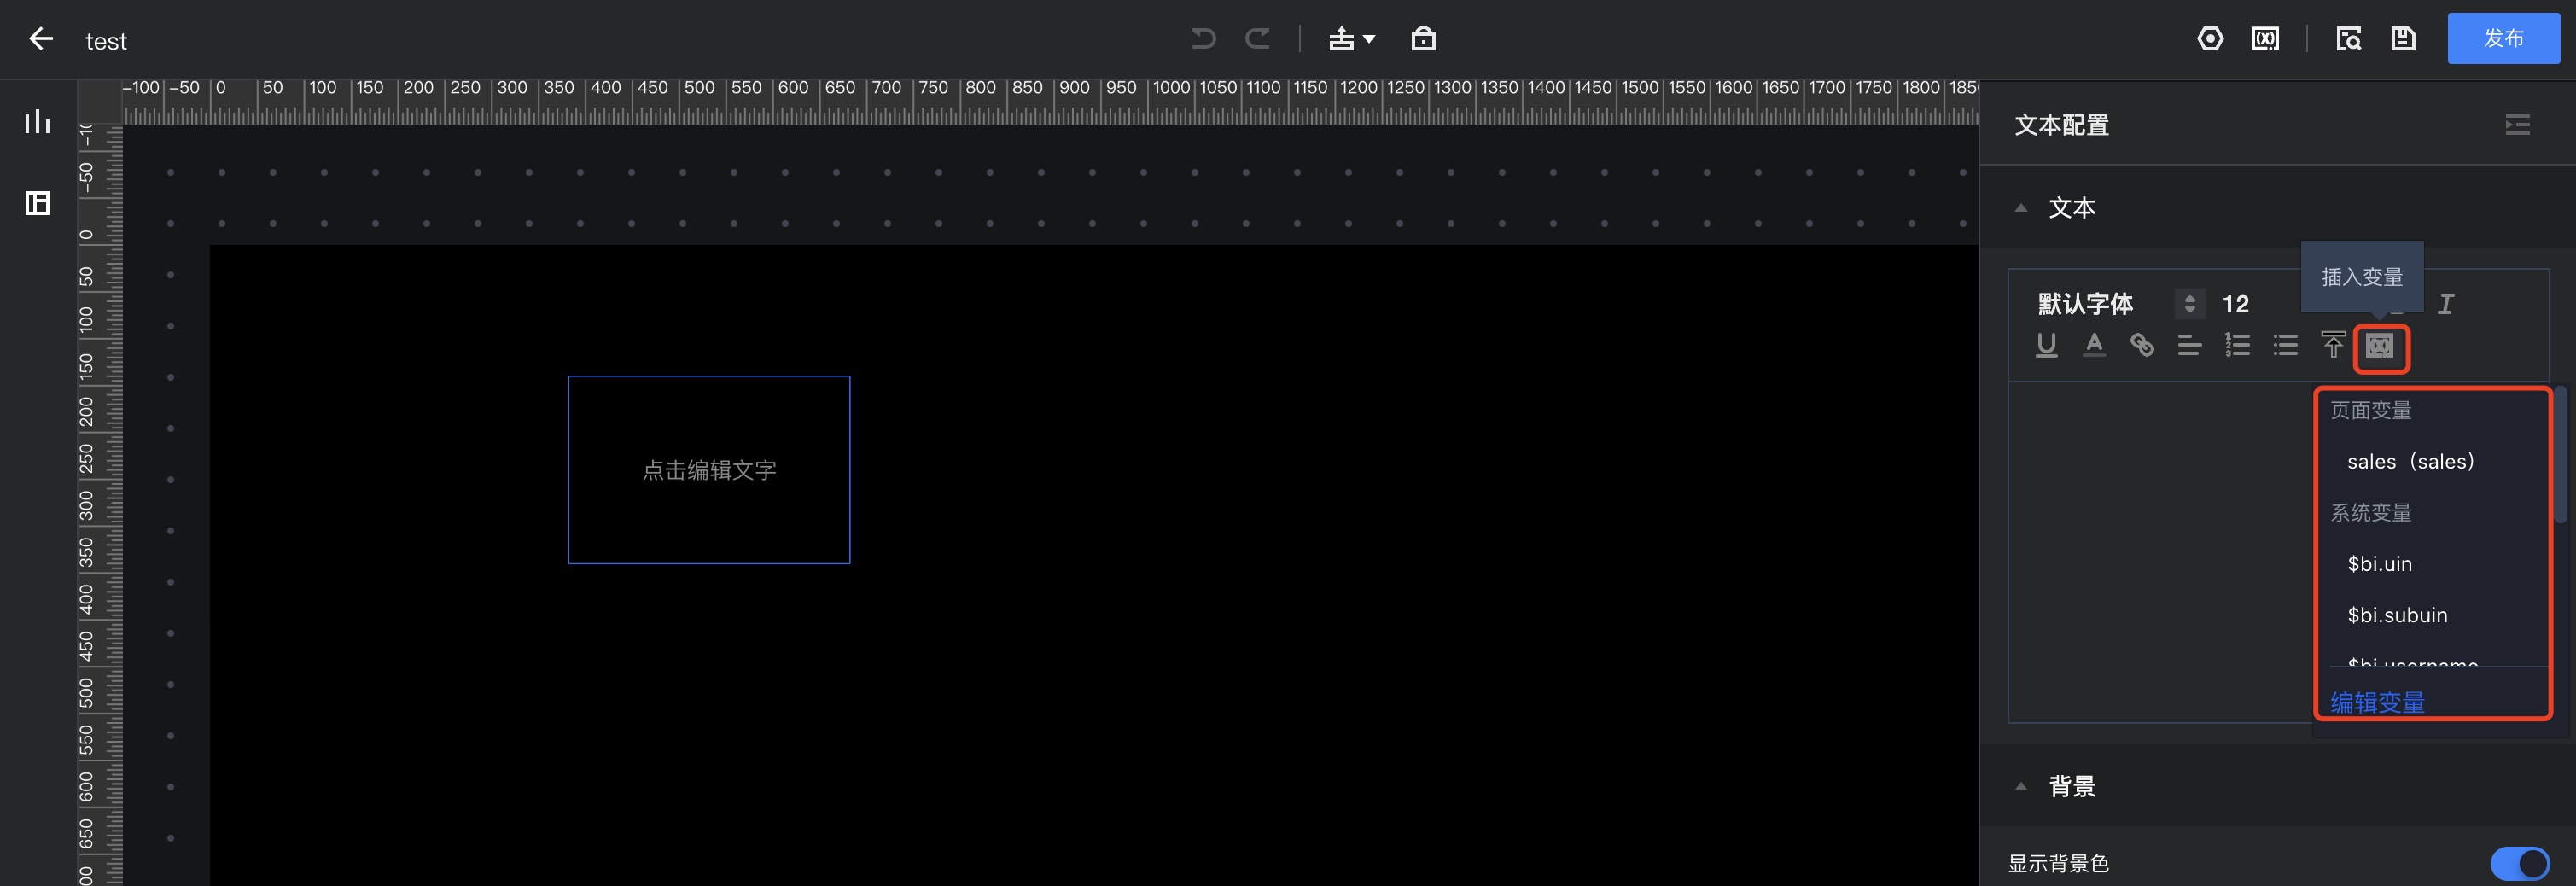
4. 引用变量
在文本中,通过插入变量,可以引用变量结果。
在页面中拖入文本组件;
在文本中插入变量;
对文本设置样式:
变量的使用技巧
变量是一个灵活性较高的能力,在使用变量时,以下技巧可帮助您更好的管理和使用变量:
1. 通过引用格式化,减少变量数量
变量太多的大部分原因是将每个引用场景都定义成了一个变量,导致数量太多,如页面中需要展示“产值”、“成本”和“利润”三个指标,如果每个定义为一个变量,那么就需要三个变量;变量的增加也将使请求增加,导致性能下降。
正确的做法是定义一个变量(包含产值、成本),然后在引用时分别取出变量中的各个值,操作如下:
定义一个“sales”变量,设置指标为“员工产值”和“人工支出”(“利润”可先不定义,后面通过计算获得):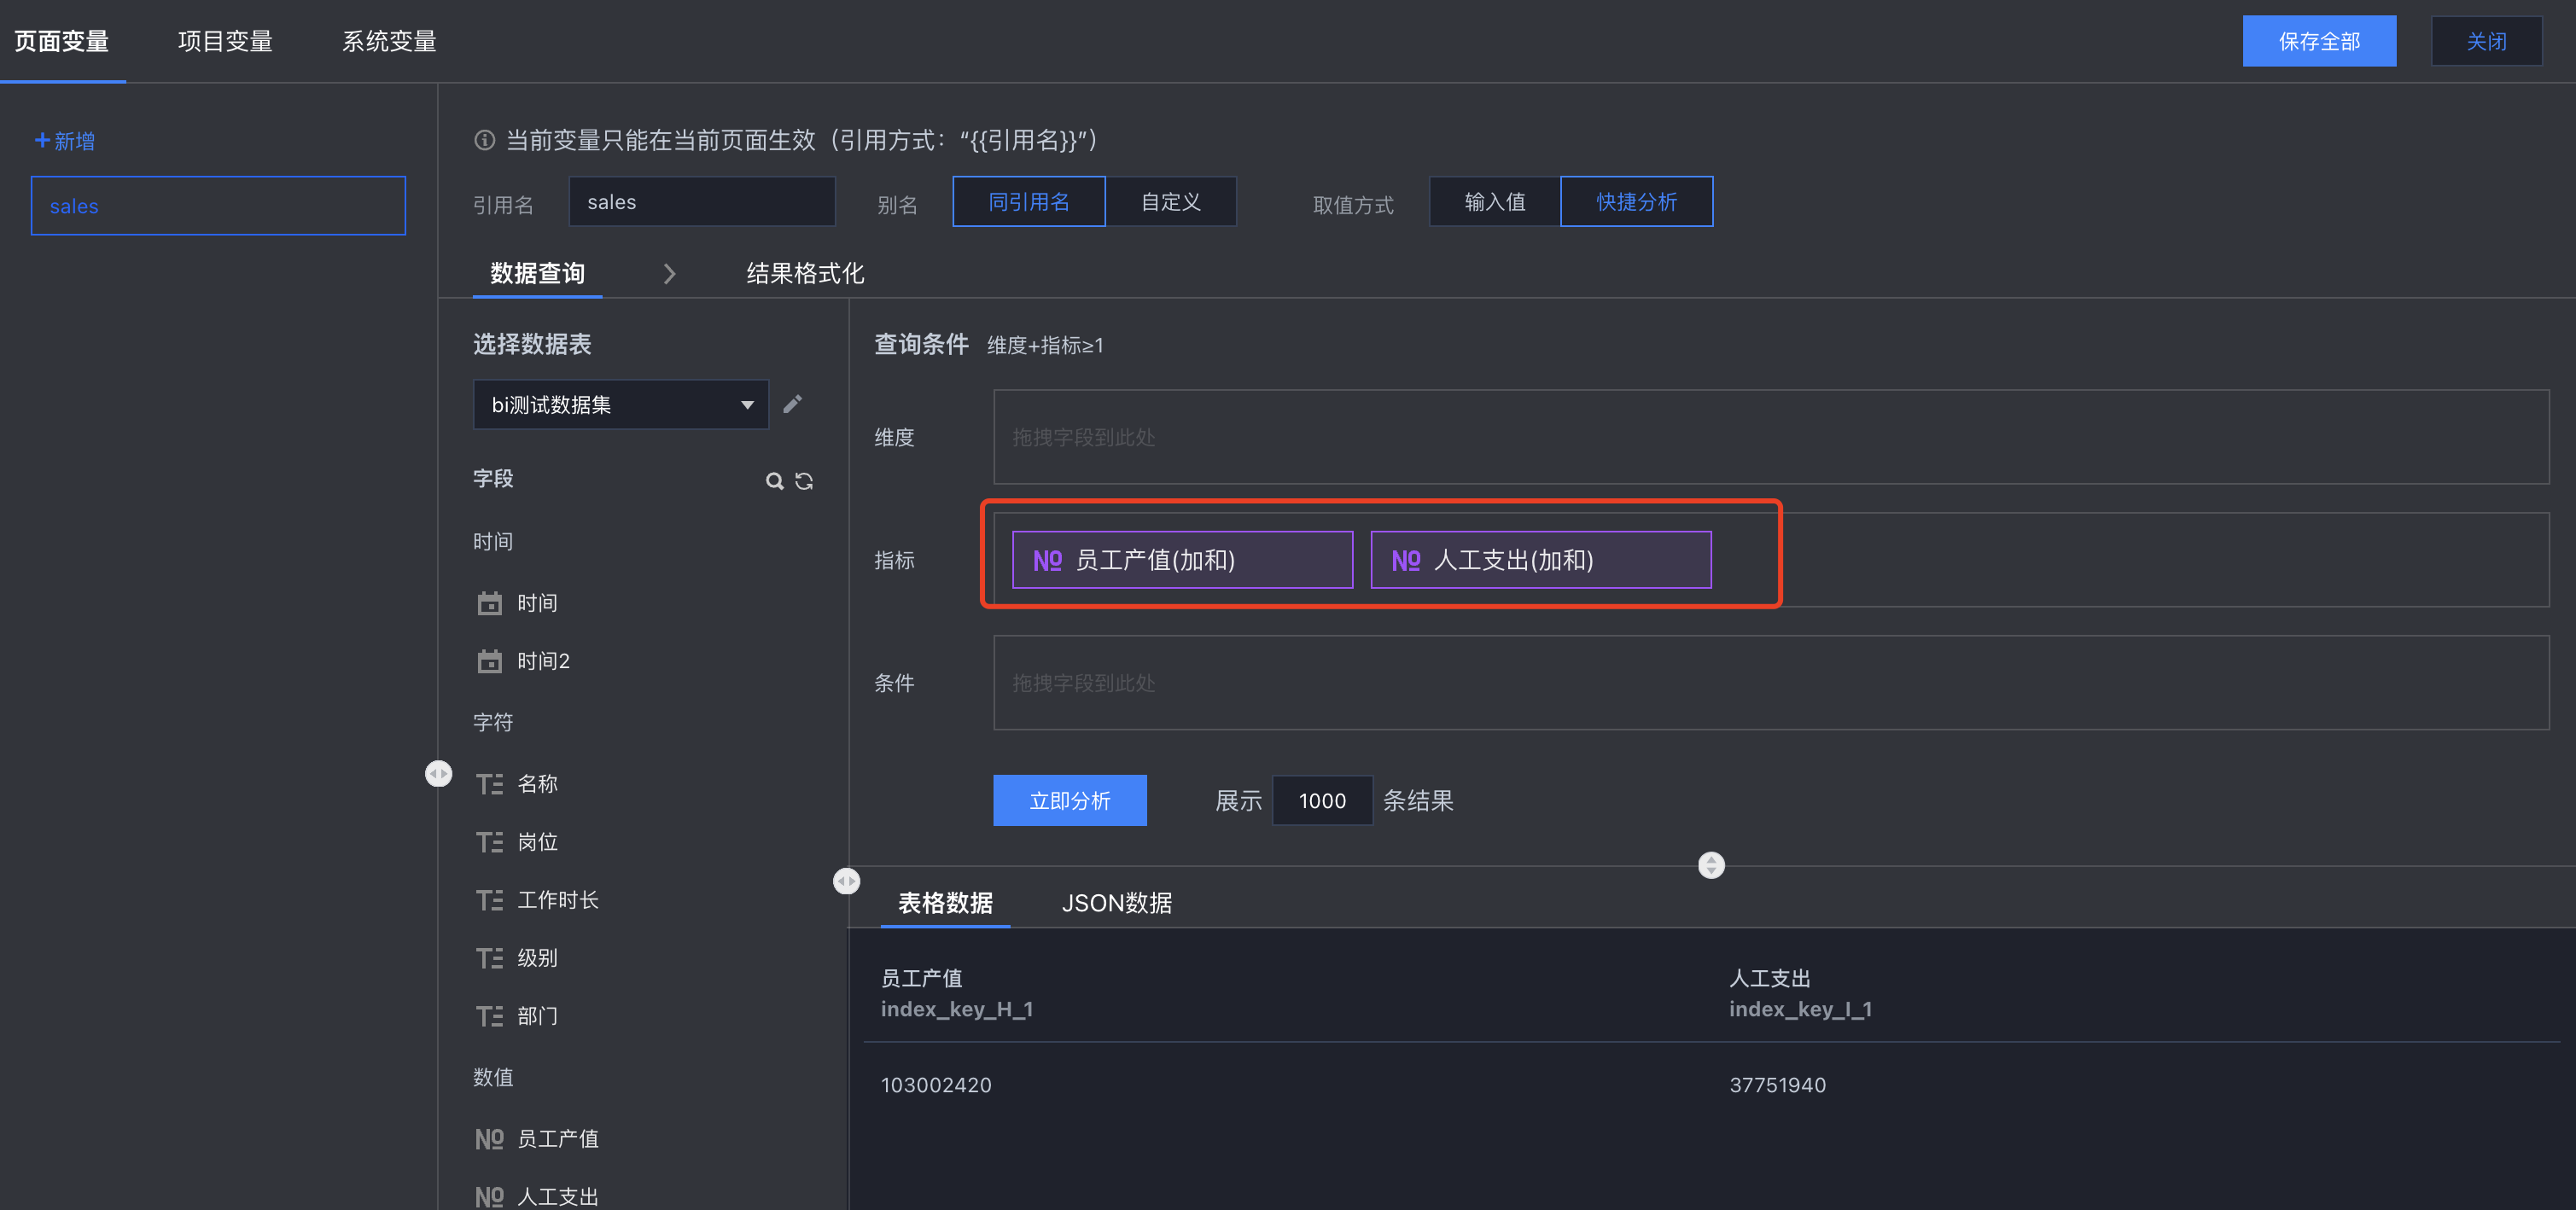
结果格式化里,把变量的返回设置成“返回第一行”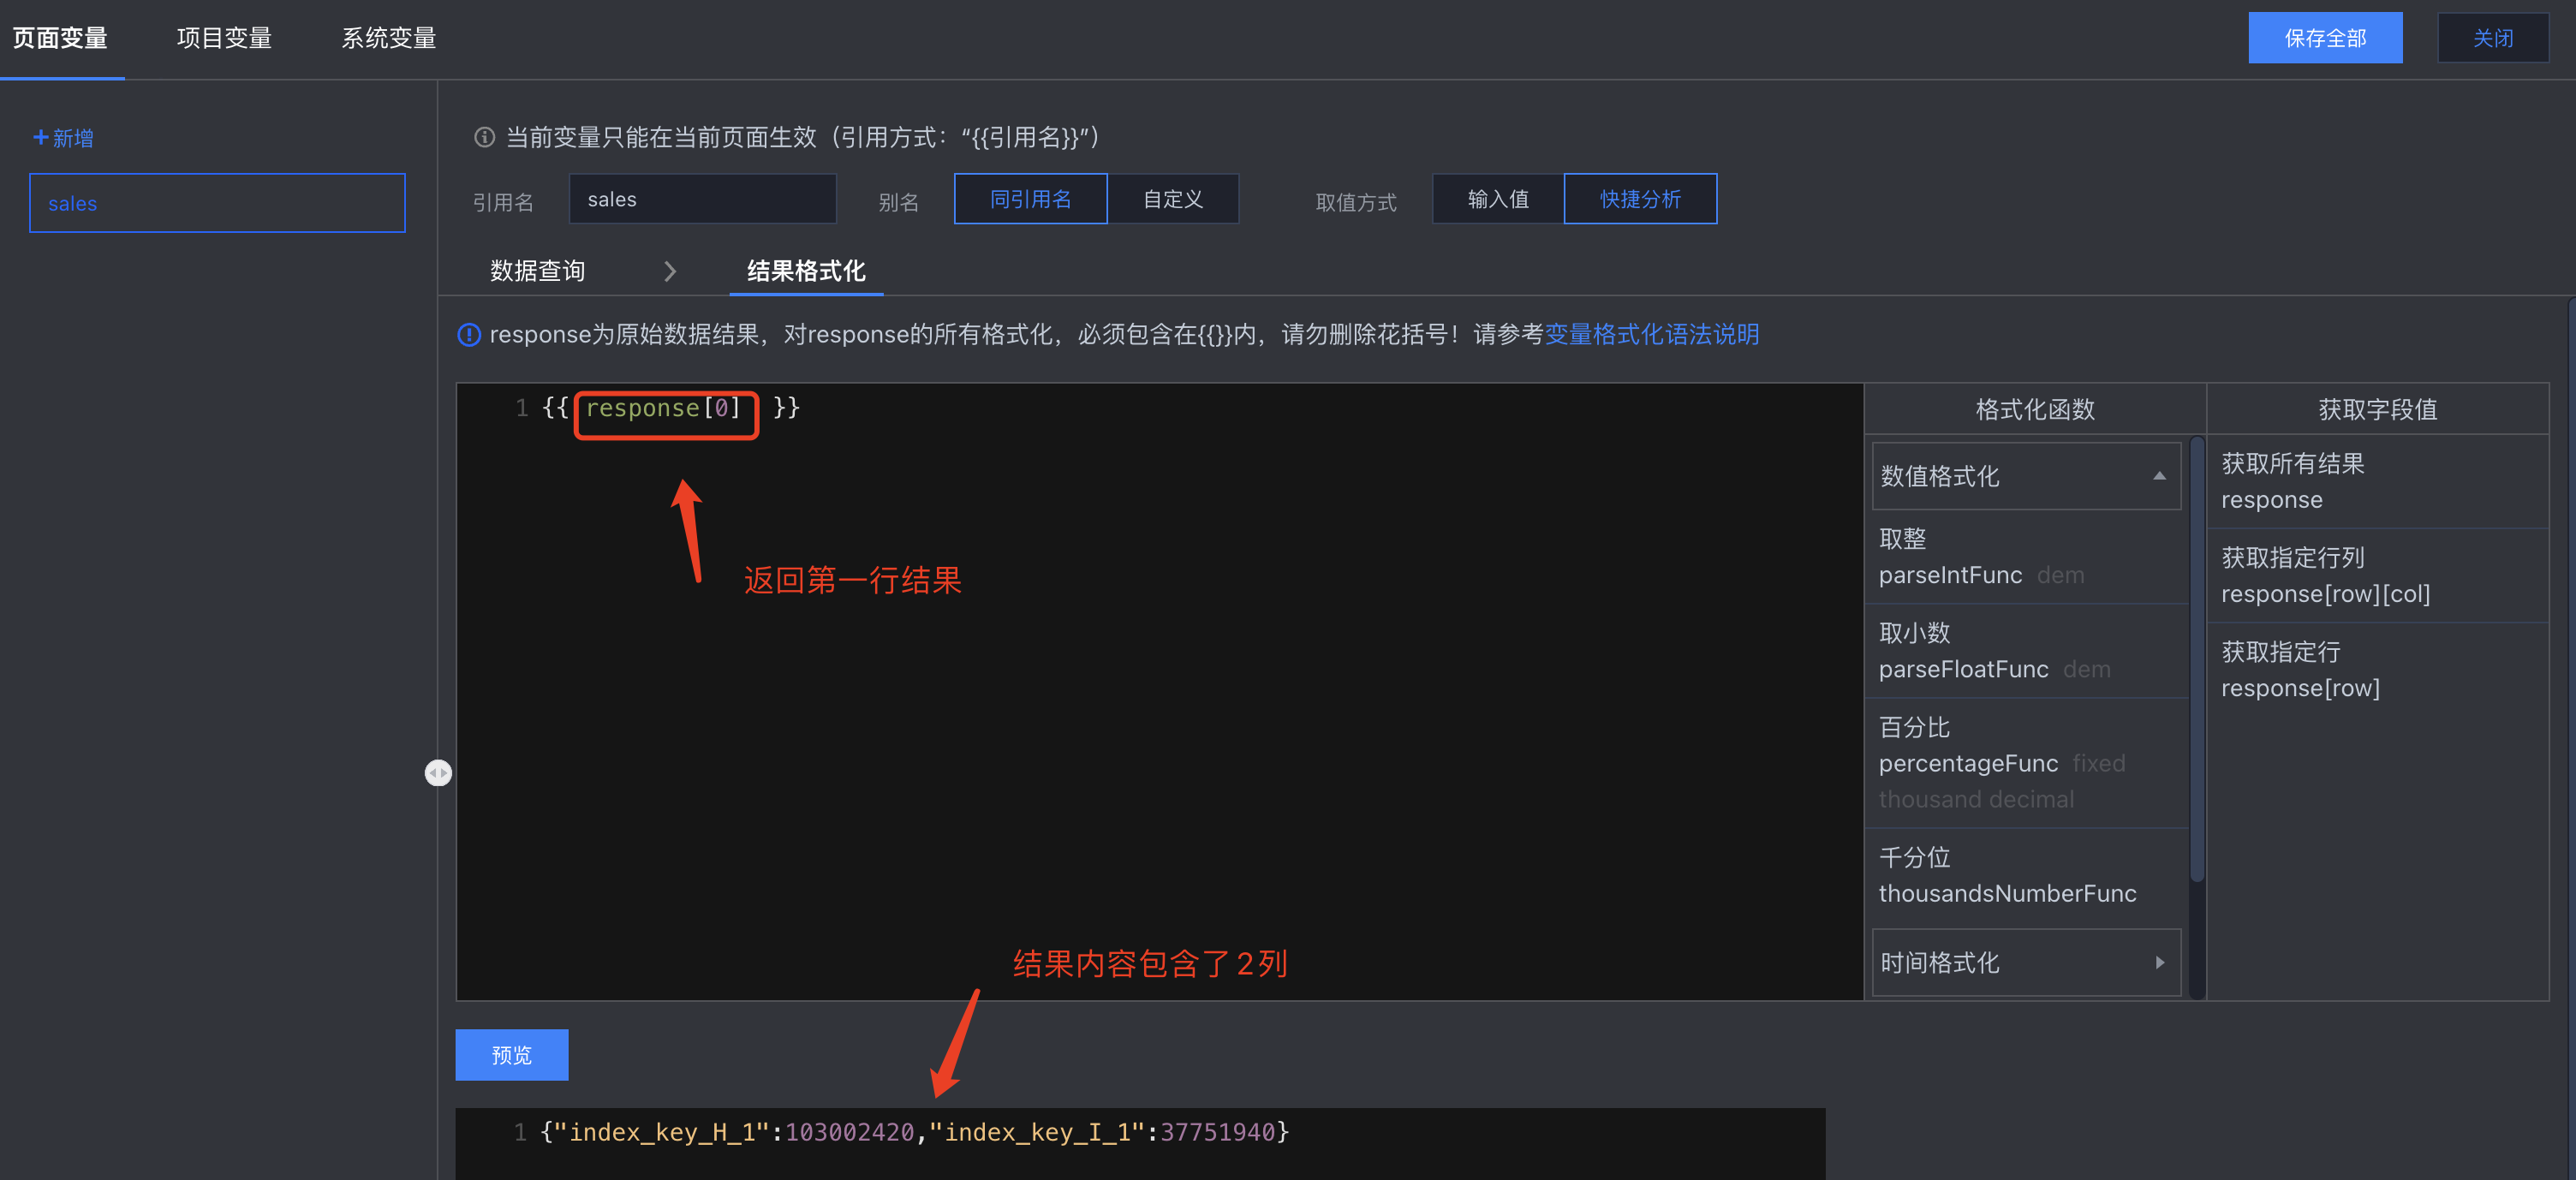
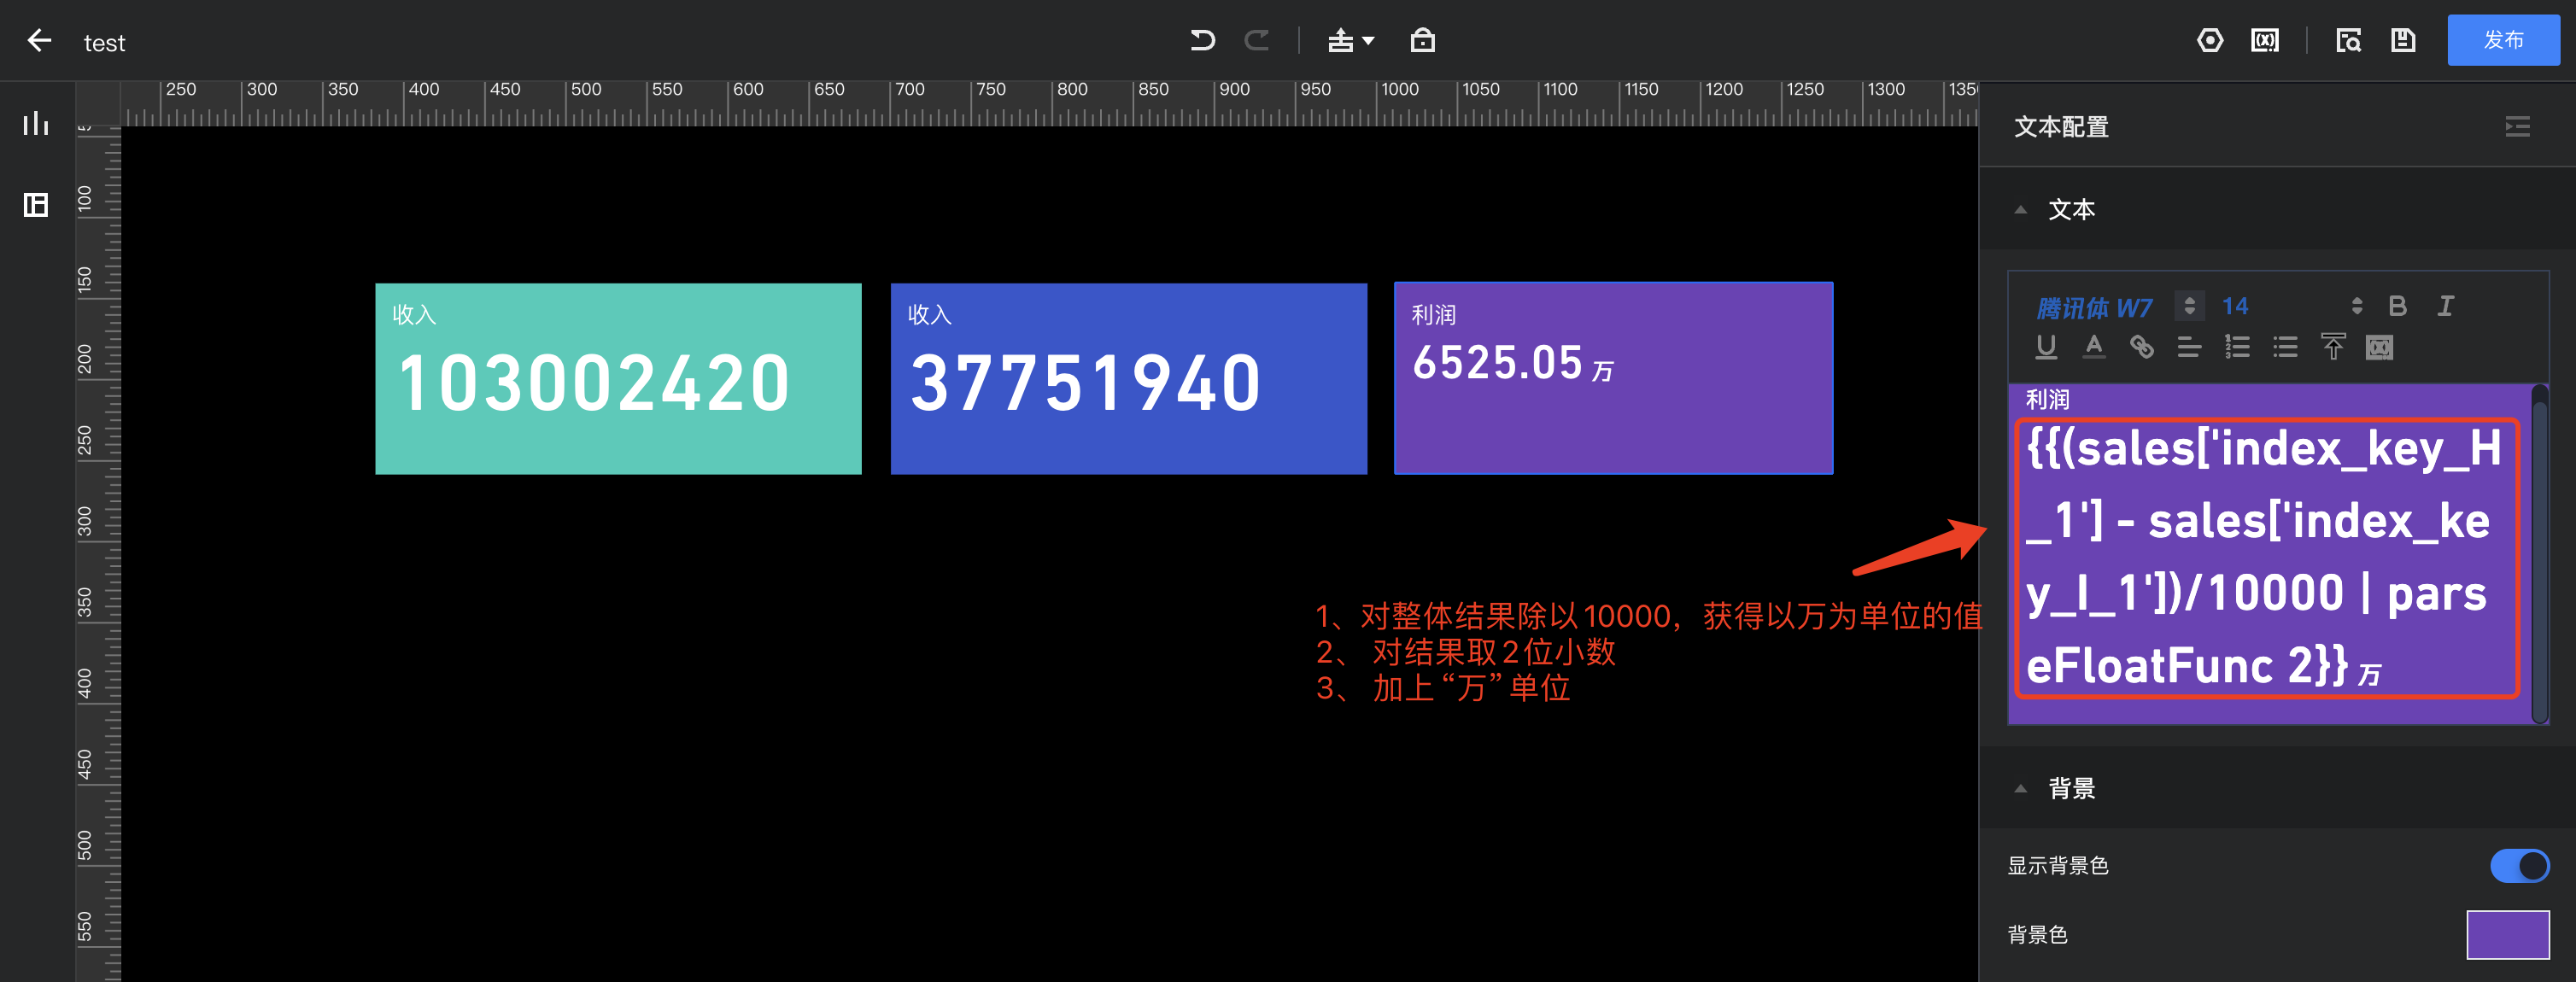
在文本中再次格式化数据结果,以“利润”为例(利润=产值-成本):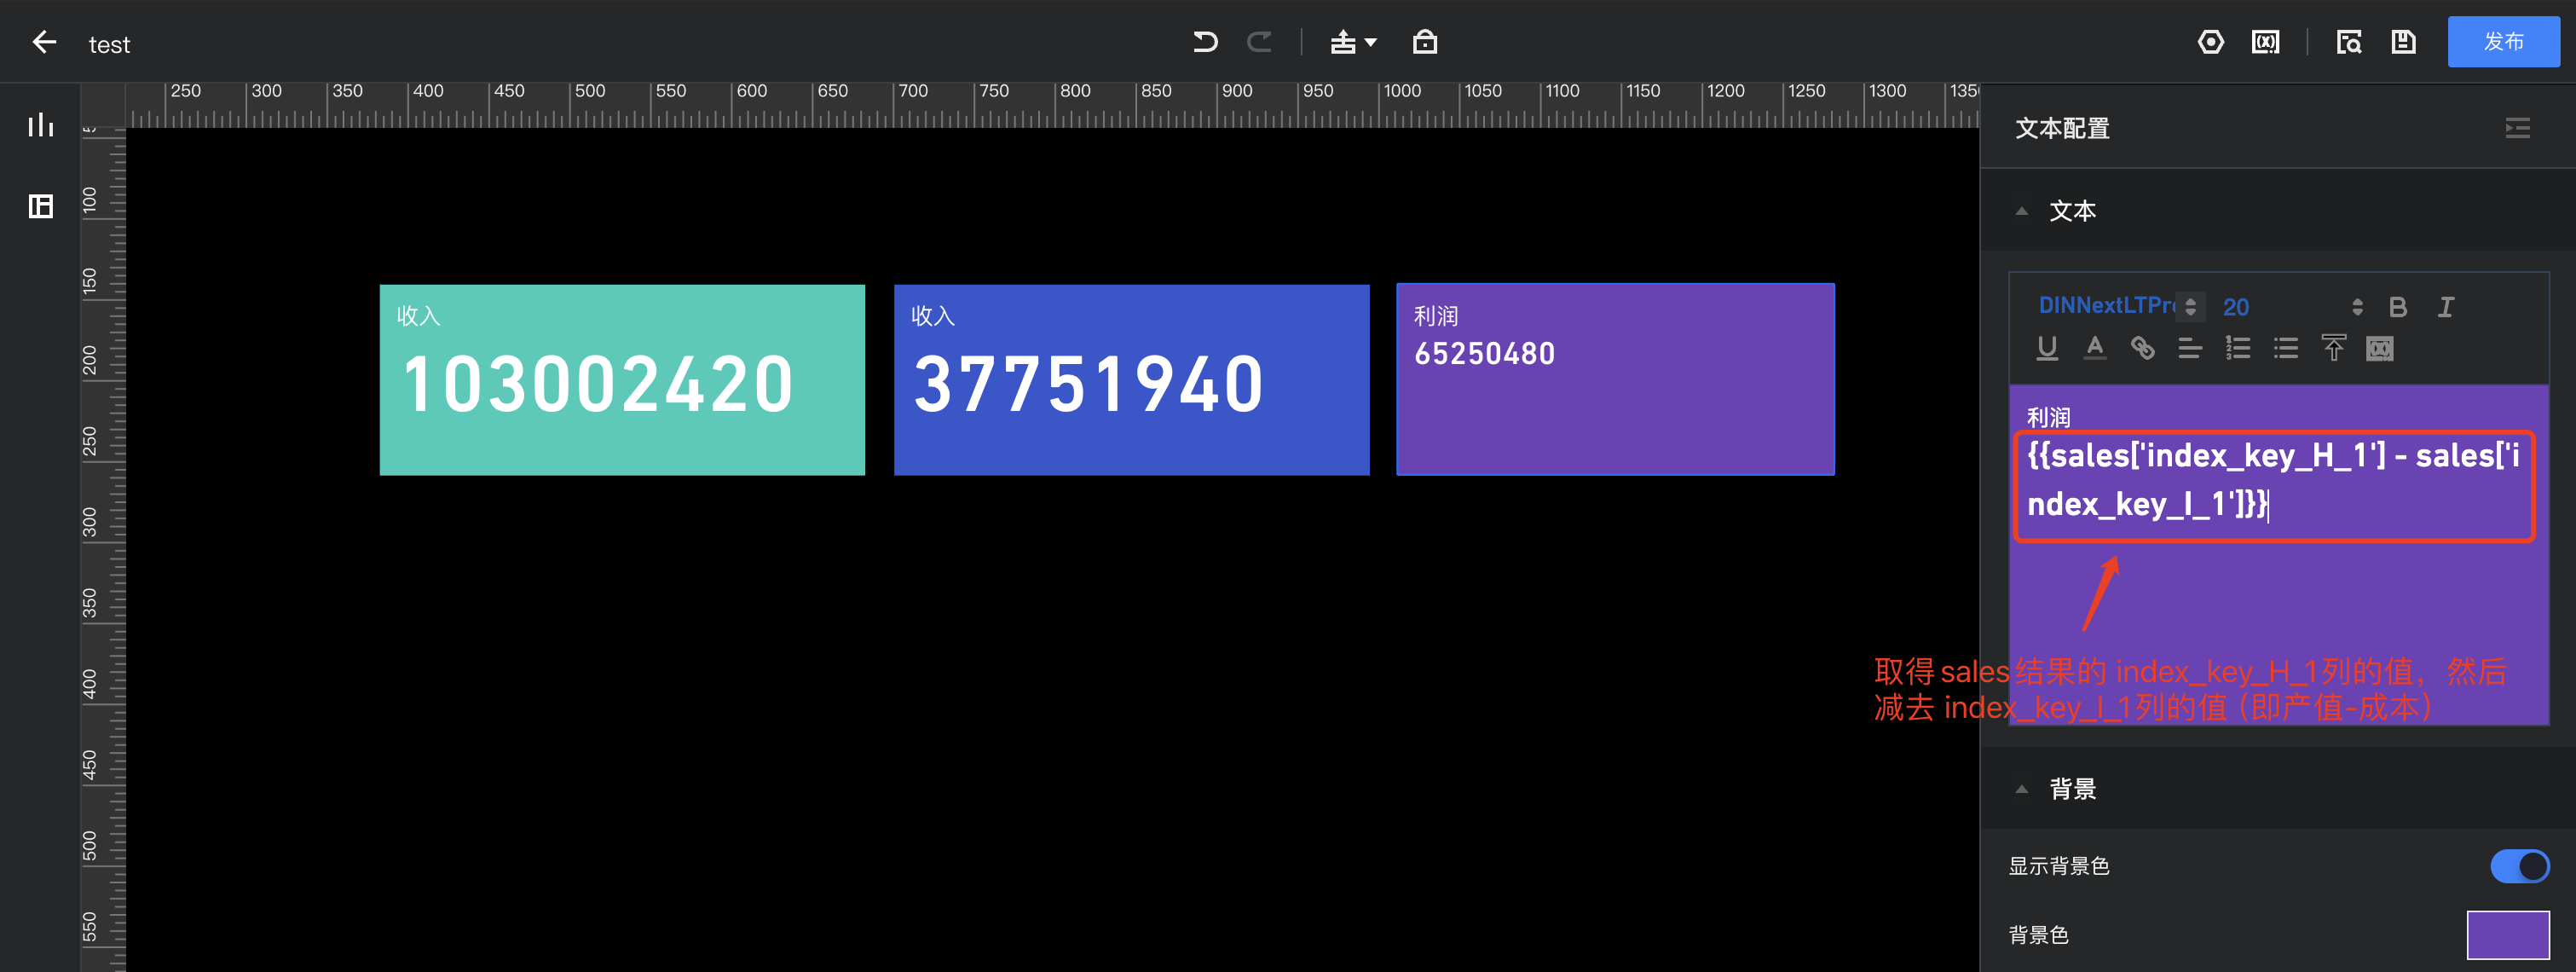
再次格式化,设置结果展示“万”为单位,保留2位小数:
2. 先完成变量引用,再设置样式
文本组件是一个富文本组件,在粘贴时容易带上格式,而格式会导致变量识别不出来,如我们在引用sales变量时,先设置为“{{sales}}”,且设置了样式,这个时候在粘贴“index_key_H_1”,则两段文本无法构成一个变量引用,如下图: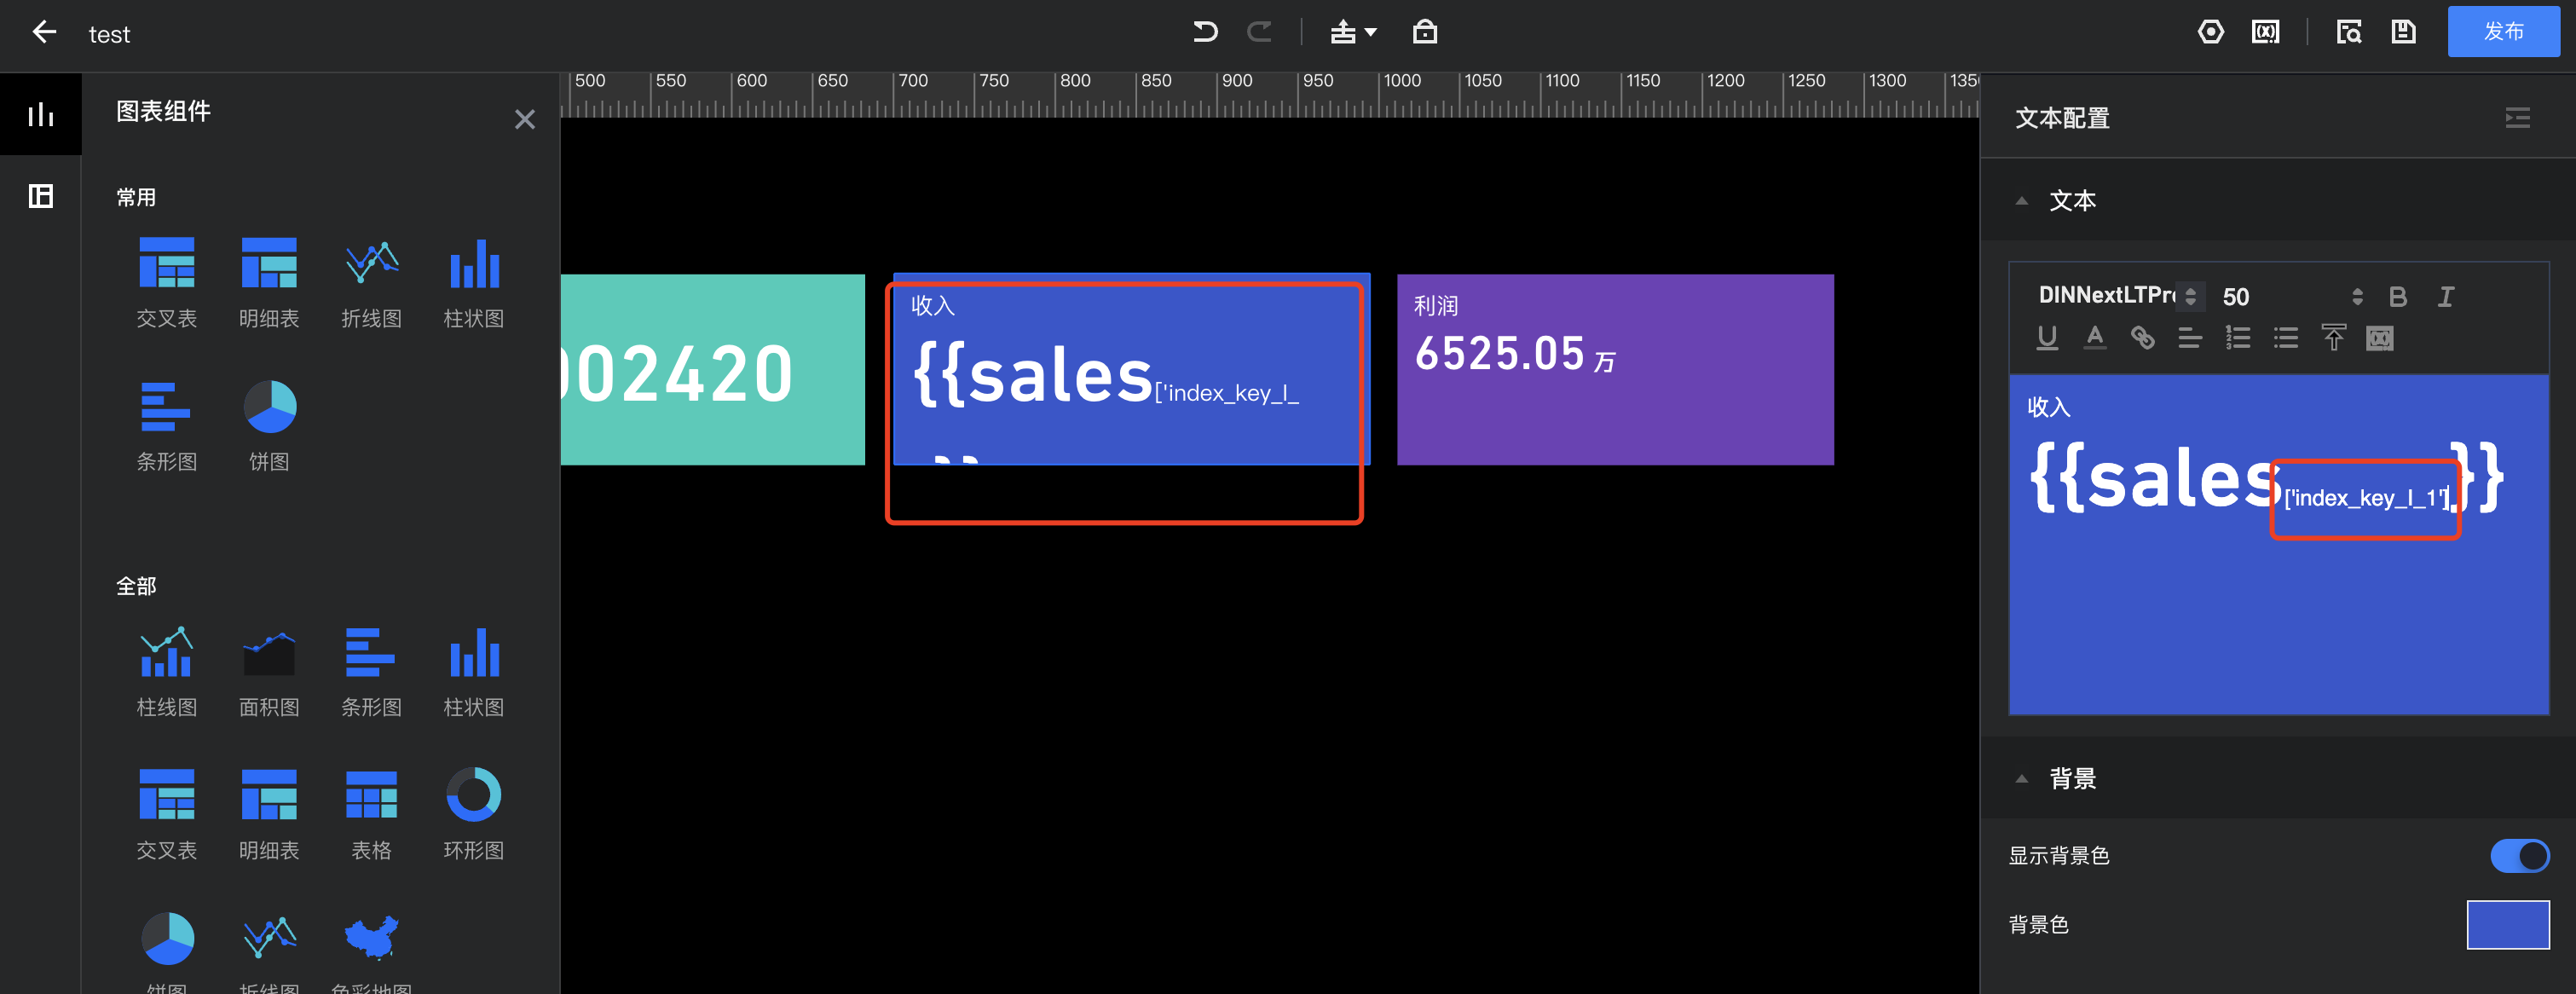
我们建议如下操作:
将变量复制到“去格式”的编辑环境先格式化,如直接复制到浏览器的地址栏(不要按“回车/enter键”),如下图: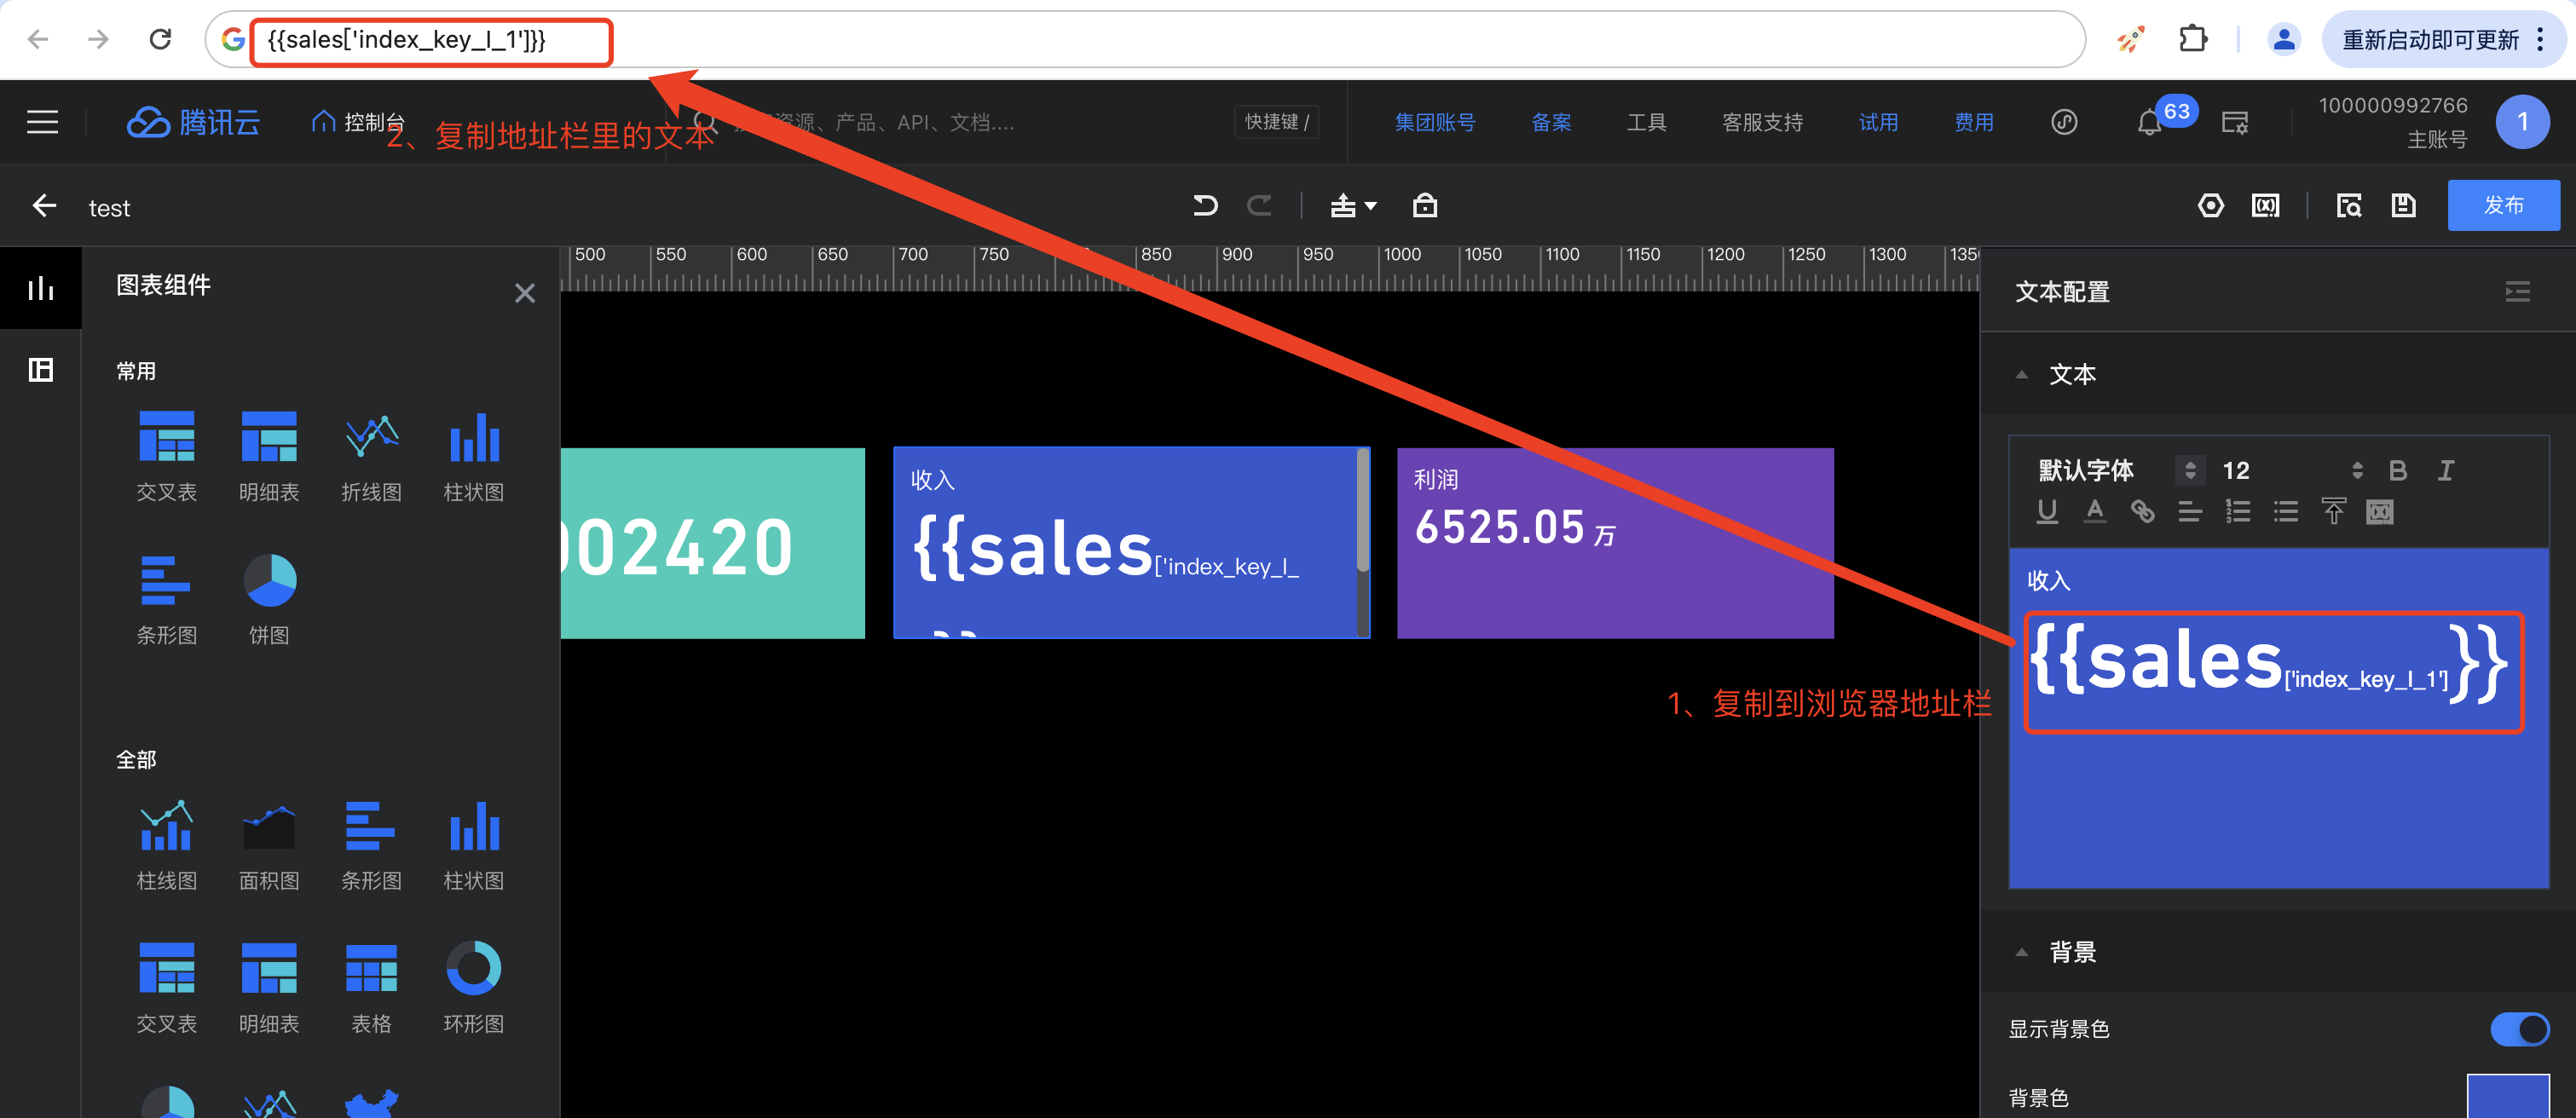
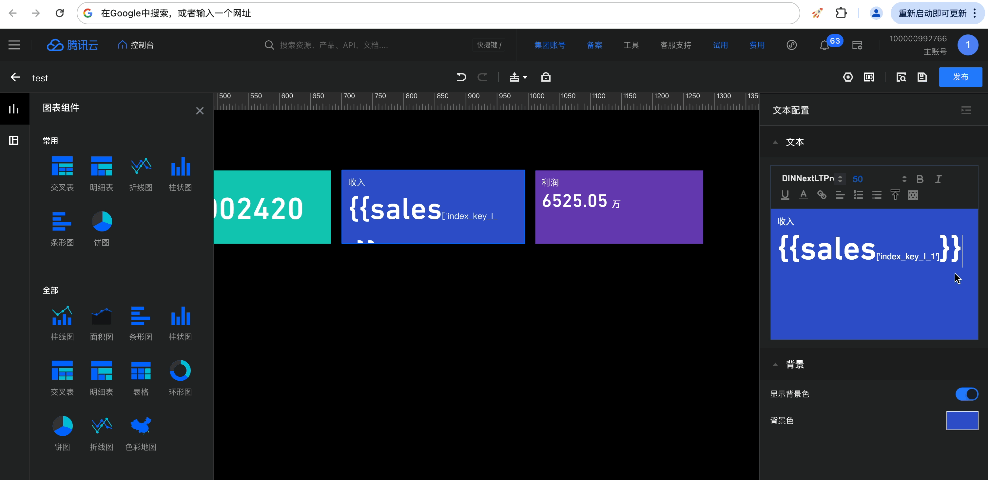
将“去格式”编辑环境里的文本,复制粘贴回富文本编辑器;
选中变量部分,设置样式。
完整步骤如下图示意:
3. 常用的格式化方法:
假设原始变量数据分析结果如下:
假设初始化结果格式为:
下面介绍几种常用的结果格式方法:
获取某行数据结果:{{ response[行数] }},其中行数为索引值,0代表第一行,1代表第二行,以此类推;
获取某行某列结果:{{ response[行数][列名] }},其中列名称为数据表字段名称(注意不是昵称,可在“数据查询”下的表格表头中看到);
对数值结果进行“千分位”展示:{{ response[行数][列名] | thousandsNumberFunc }};
对数值结果进行“2位小数”展示:{{ response[行数][列名] | parseFloatFunc 小数位 }},其中小数点位数决定数值的小数位,可不填,默认为1位;
对数值结果进行“百分比”展示:{{ response[行数][列名] | percentageFunc 小数位 }},其中小数点位数决定百分比显示的小数位,可不填,默认为2位;
对时间结果进行格式化:{{ response[行数][列名] | dateFormatFunc '时间格式' }},其中时间格式为js支持的时间格式;如 "{{ response[0]['index_key_B_1'] | dateFormatFunc 'YYYY-MM' }}"将解析为“2024-05”;
截取字符串:{{ response[行数][列名] | substrFunc 开始位置 长度 }},其中开始位置为索引值,0为第一个字,1为第二个字,以此类推;
判断:{{ 条件逻辑 ?结果1 : 结果2 }},如“{{ response[0]['index_key_B_1']==0 ? '成功' : '失败' }}”,判断该行列的值是否等于0,如果是0返回“成功”,反之返回“失败”;
循环:{{ response.map((item) => {return item['列名']}) }},如“{{ response.map((item) => {return item['index_key_H_1']}) }}”,将获取所有的'index_key_H_1'的值。
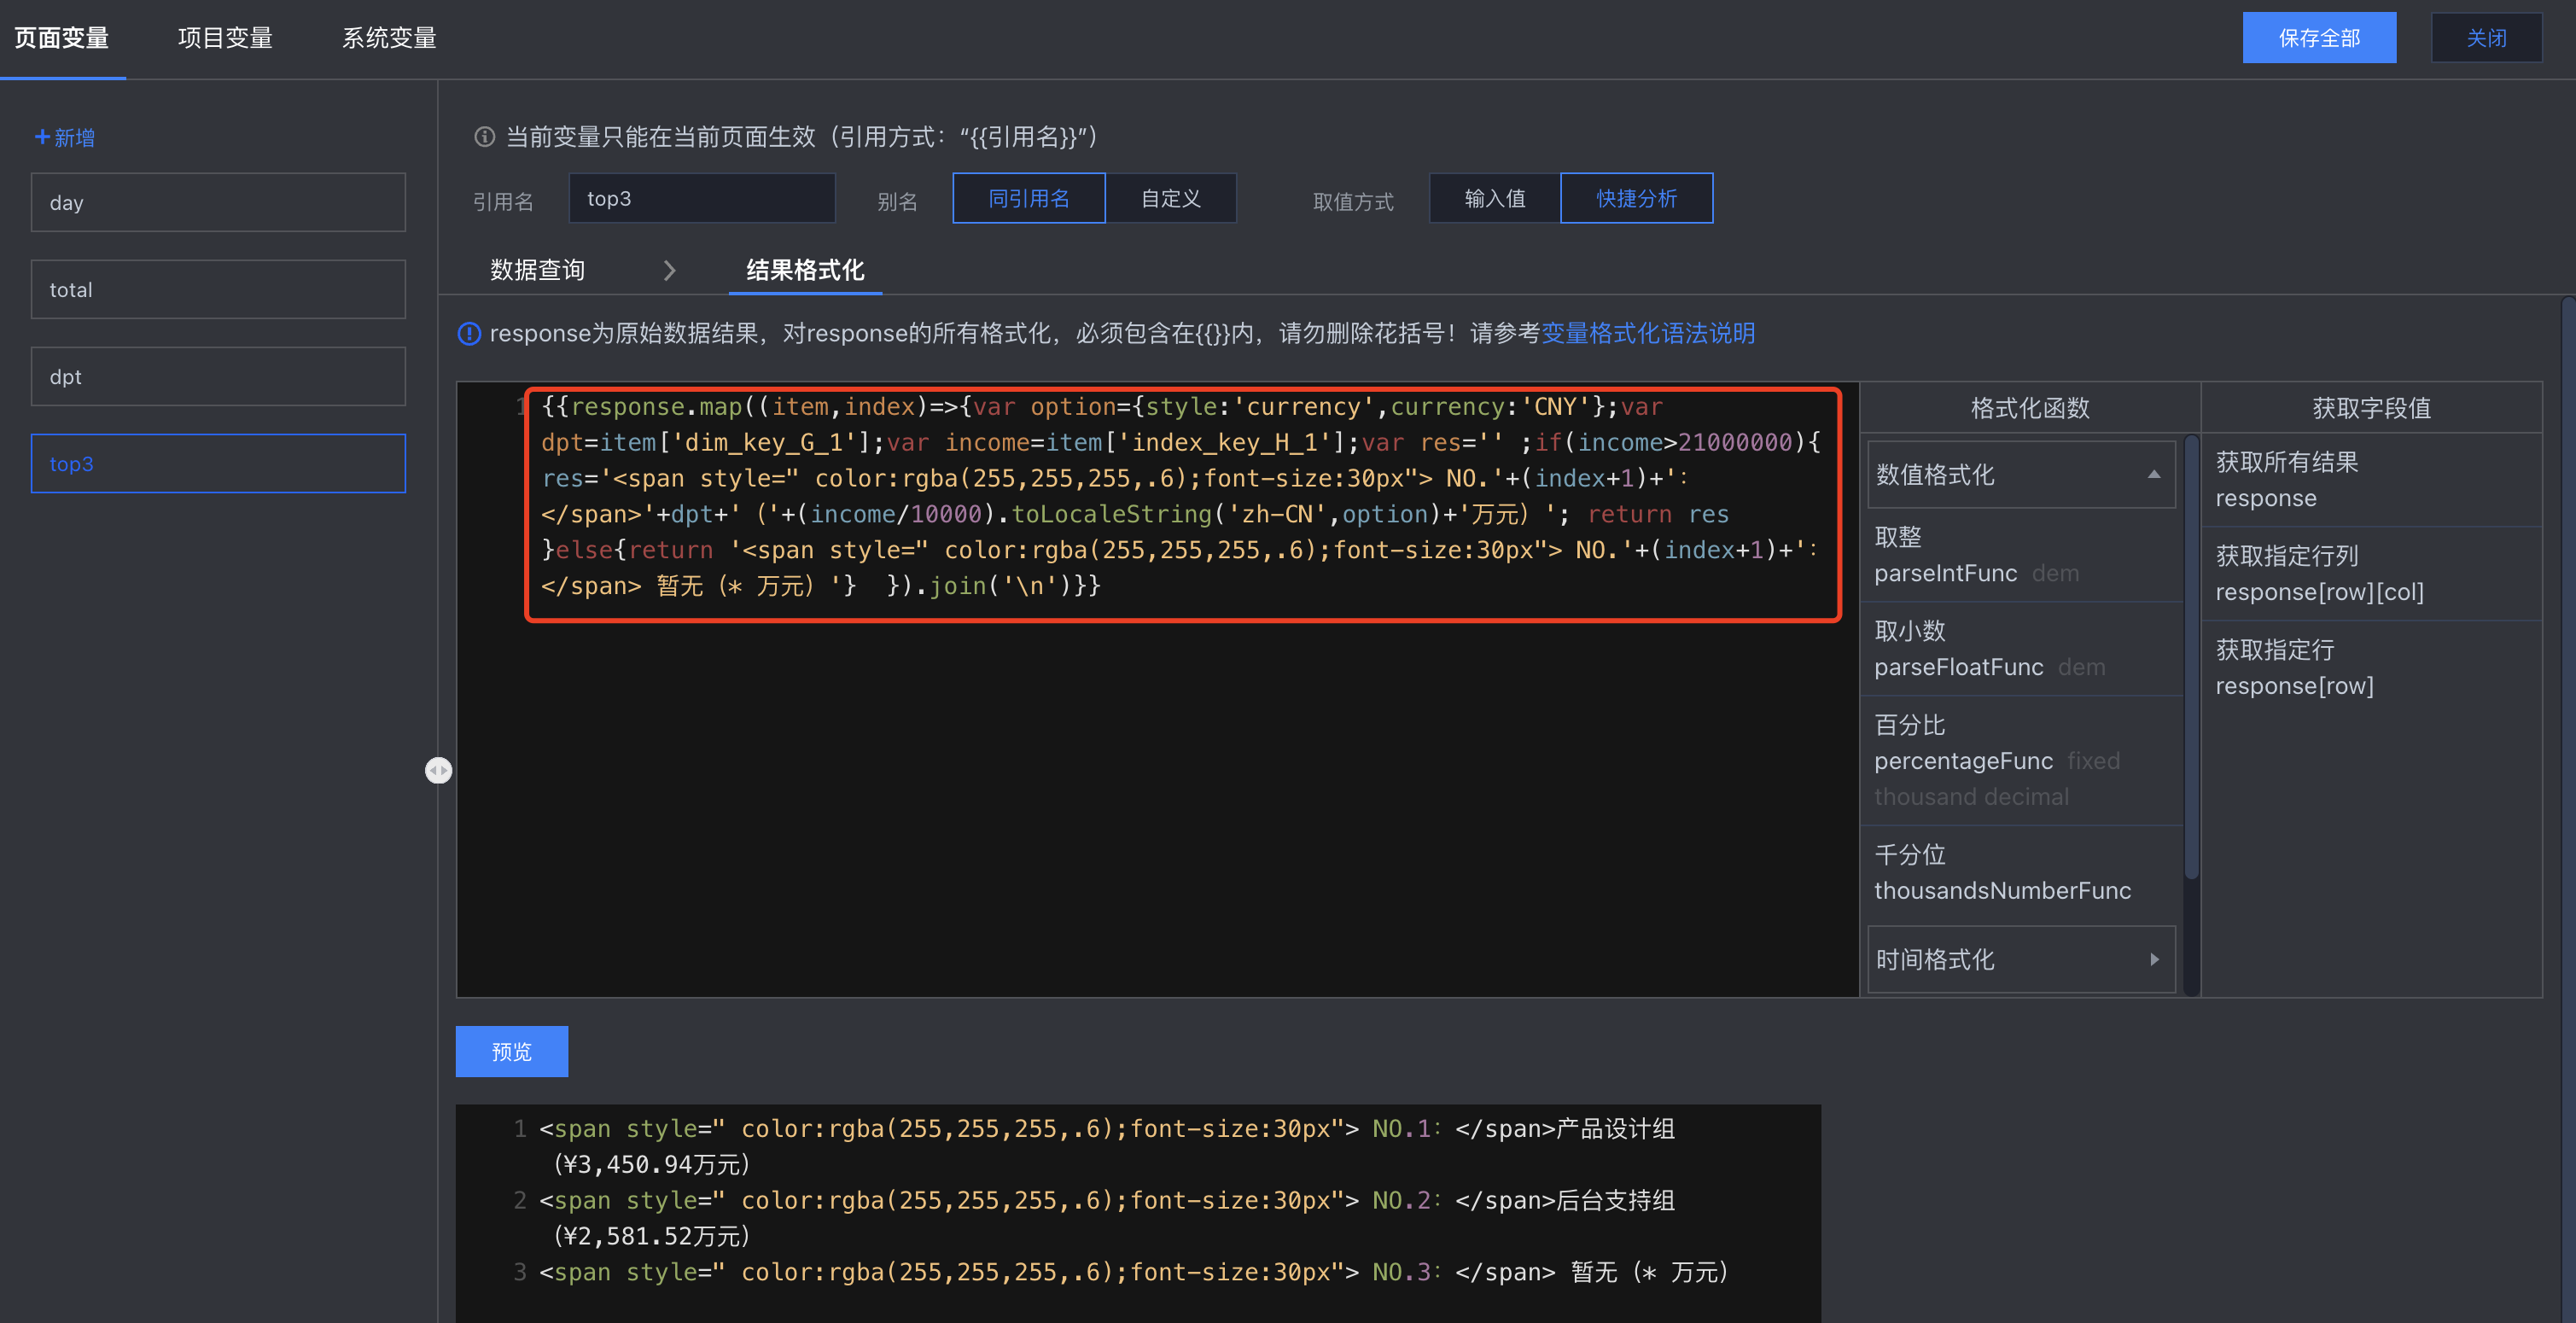
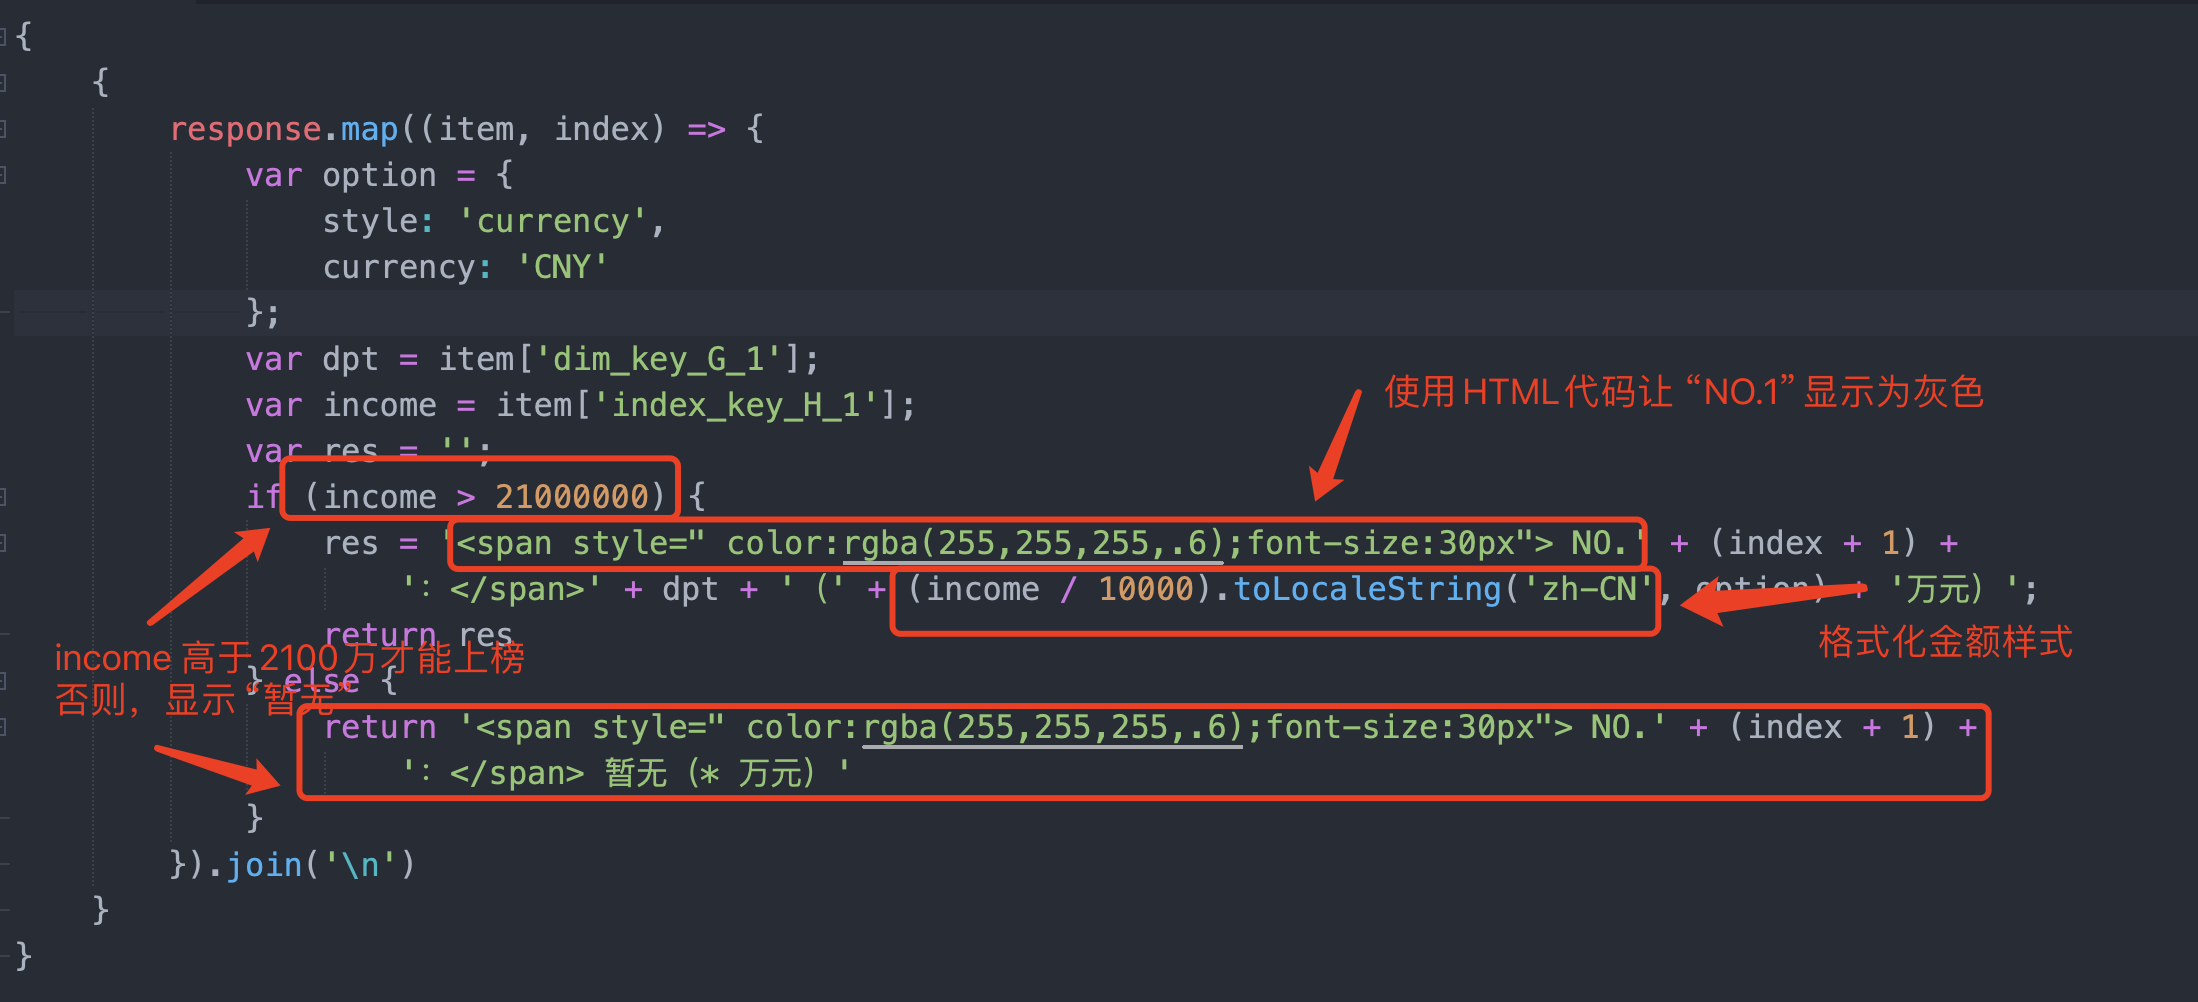
当上面提供的格式化方法无法满足需求时,您还可以通过js语法来更详细的处理数据,下面以生成一个“产值前三的员工列表”为例来说明如何使用js语法控制变量展示:
需求:从表里取出产值前三的员工,且员工的产值必须大于2100万,否则显示“暂无”;
效果如下图:

首先,我们构建一个页面变量“TOP3”, 数据配置如下(按照“员工产值”进行倒序排序,取3个结果):

其次,我们对数据结果进行格式化,加入复杂逻辑:
经验建议:
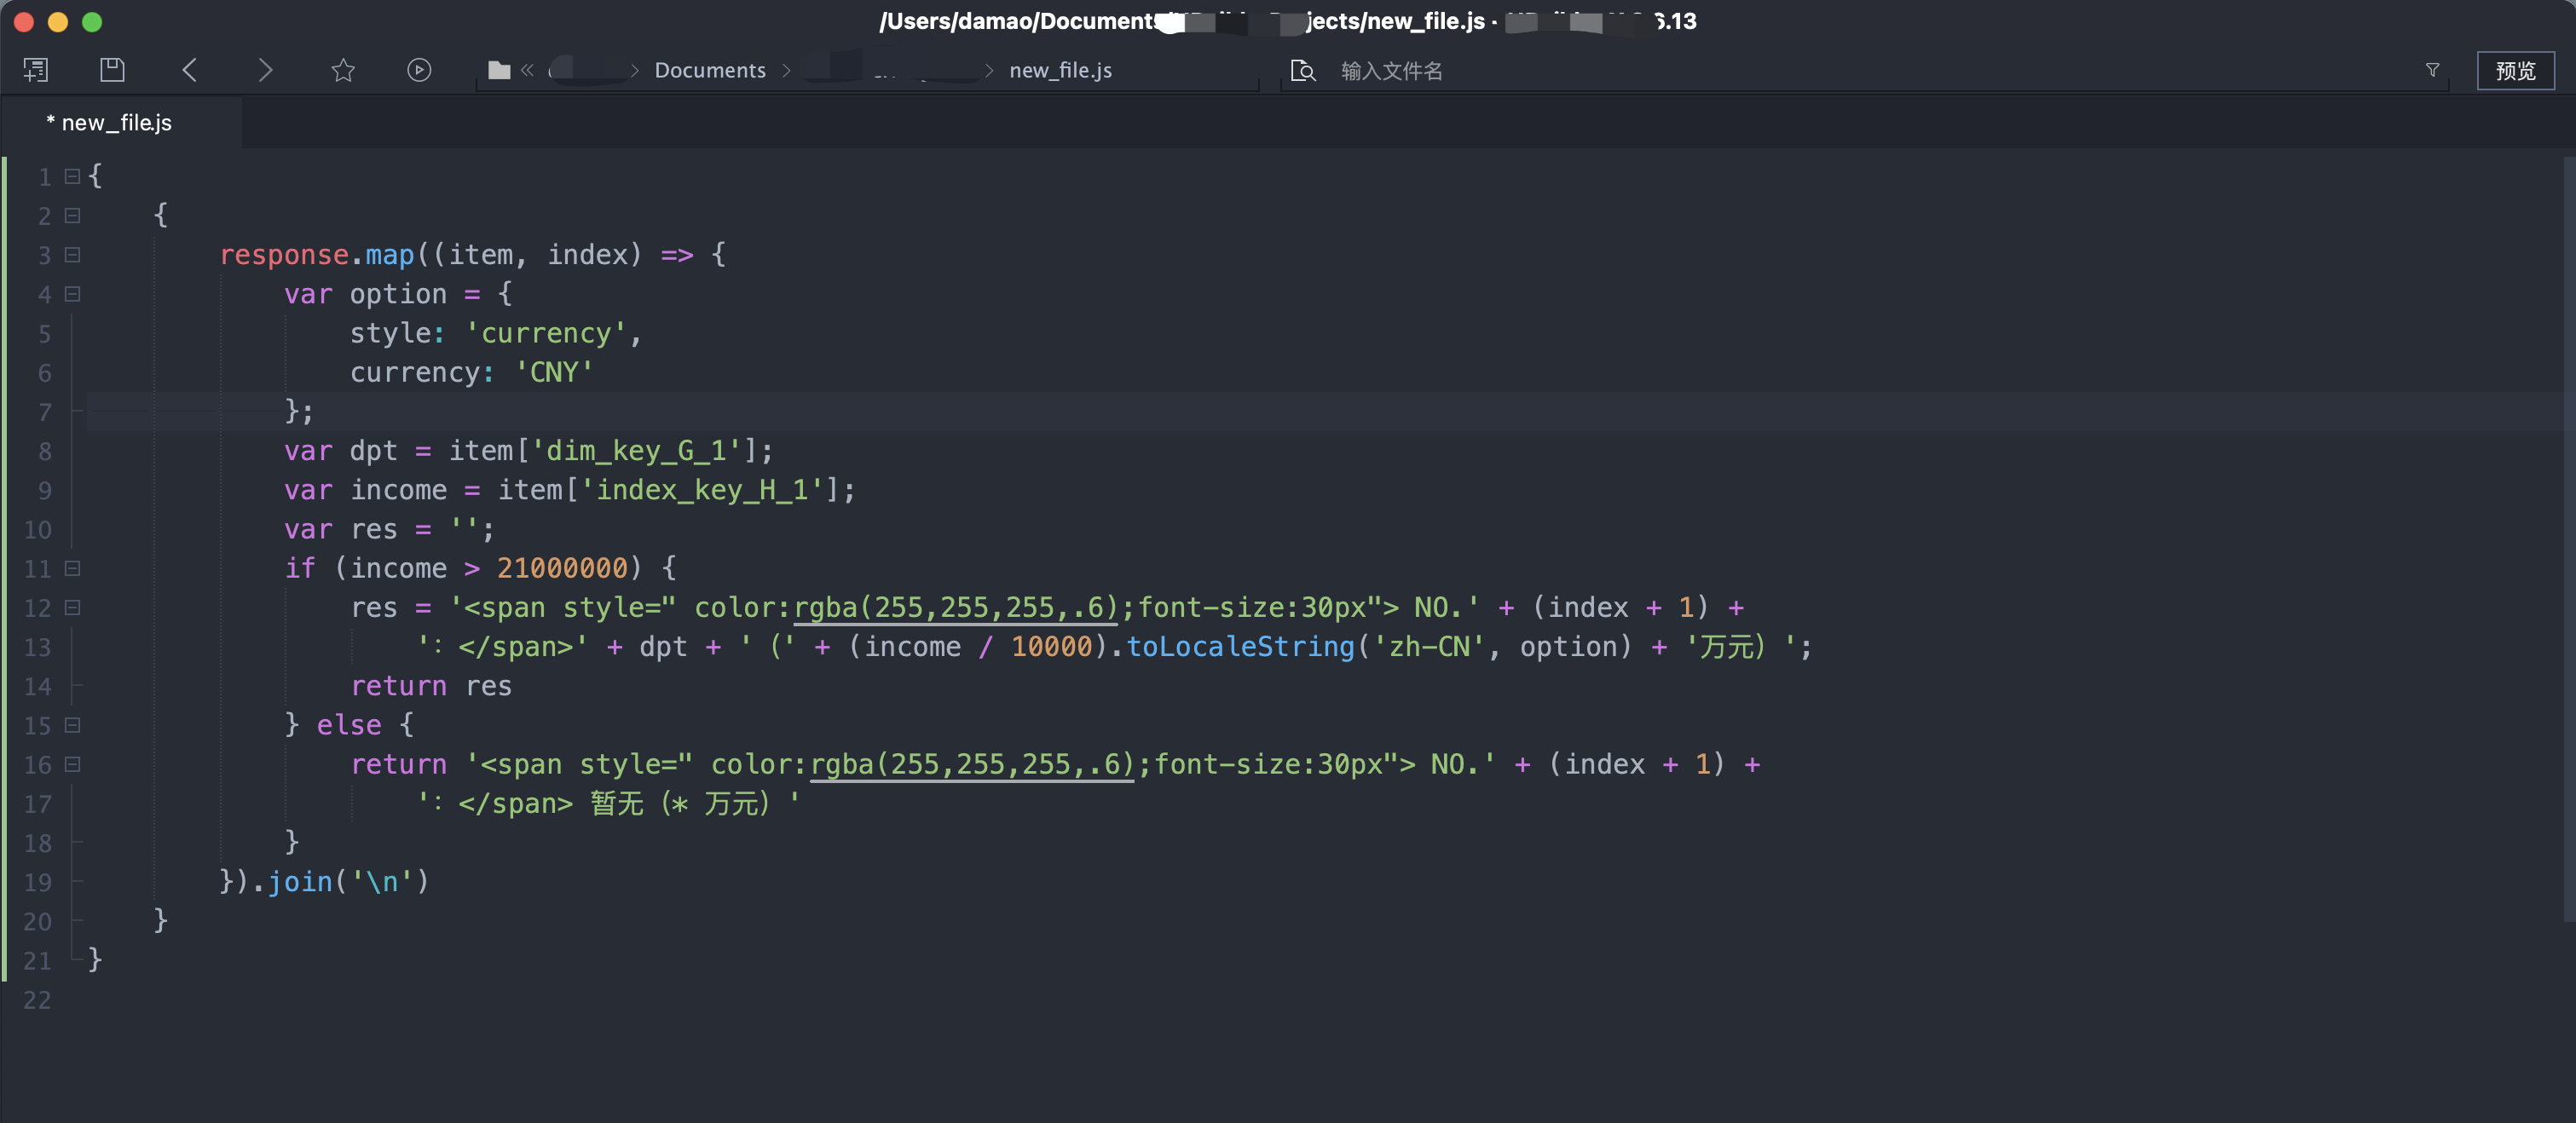
建议可以在第三方代码编辑器中编辑代码,然后粘贴到结果格式化代码框中,去掉断行。
为方便可视化,我们在第三方编辑器中格式化代码:
以上代码逻辑注释:
通过map来进行循环,且在循环里可以使用js语法进行逻辑处理;
在循环中,使用“index”来获得排名;
使用if语句,判断当前的“产值”是否超过2100万,超出了才能上榜,没有超出则显示“暂无”;
使用js的toLocaleString方法对“产值”进行格式;
在文本中,通过插入html代码,进行精准设置元素样式,使“NO.”字样显示为灰色;
最后用js的join方法,把数组转化成文本。
如下图示意:
常用的三种指标卡制作
结合前面的知识,我们来制作三种常见的指标。
1. 带图标及同环比的指标卡
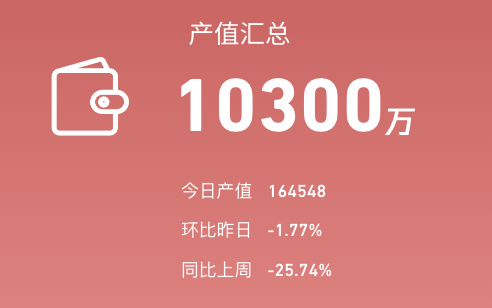
最终效果:
制作过程如下:
1.1 分别加入背景图片、icon及文本,效果如下:

1.2 设置【汇总指标】
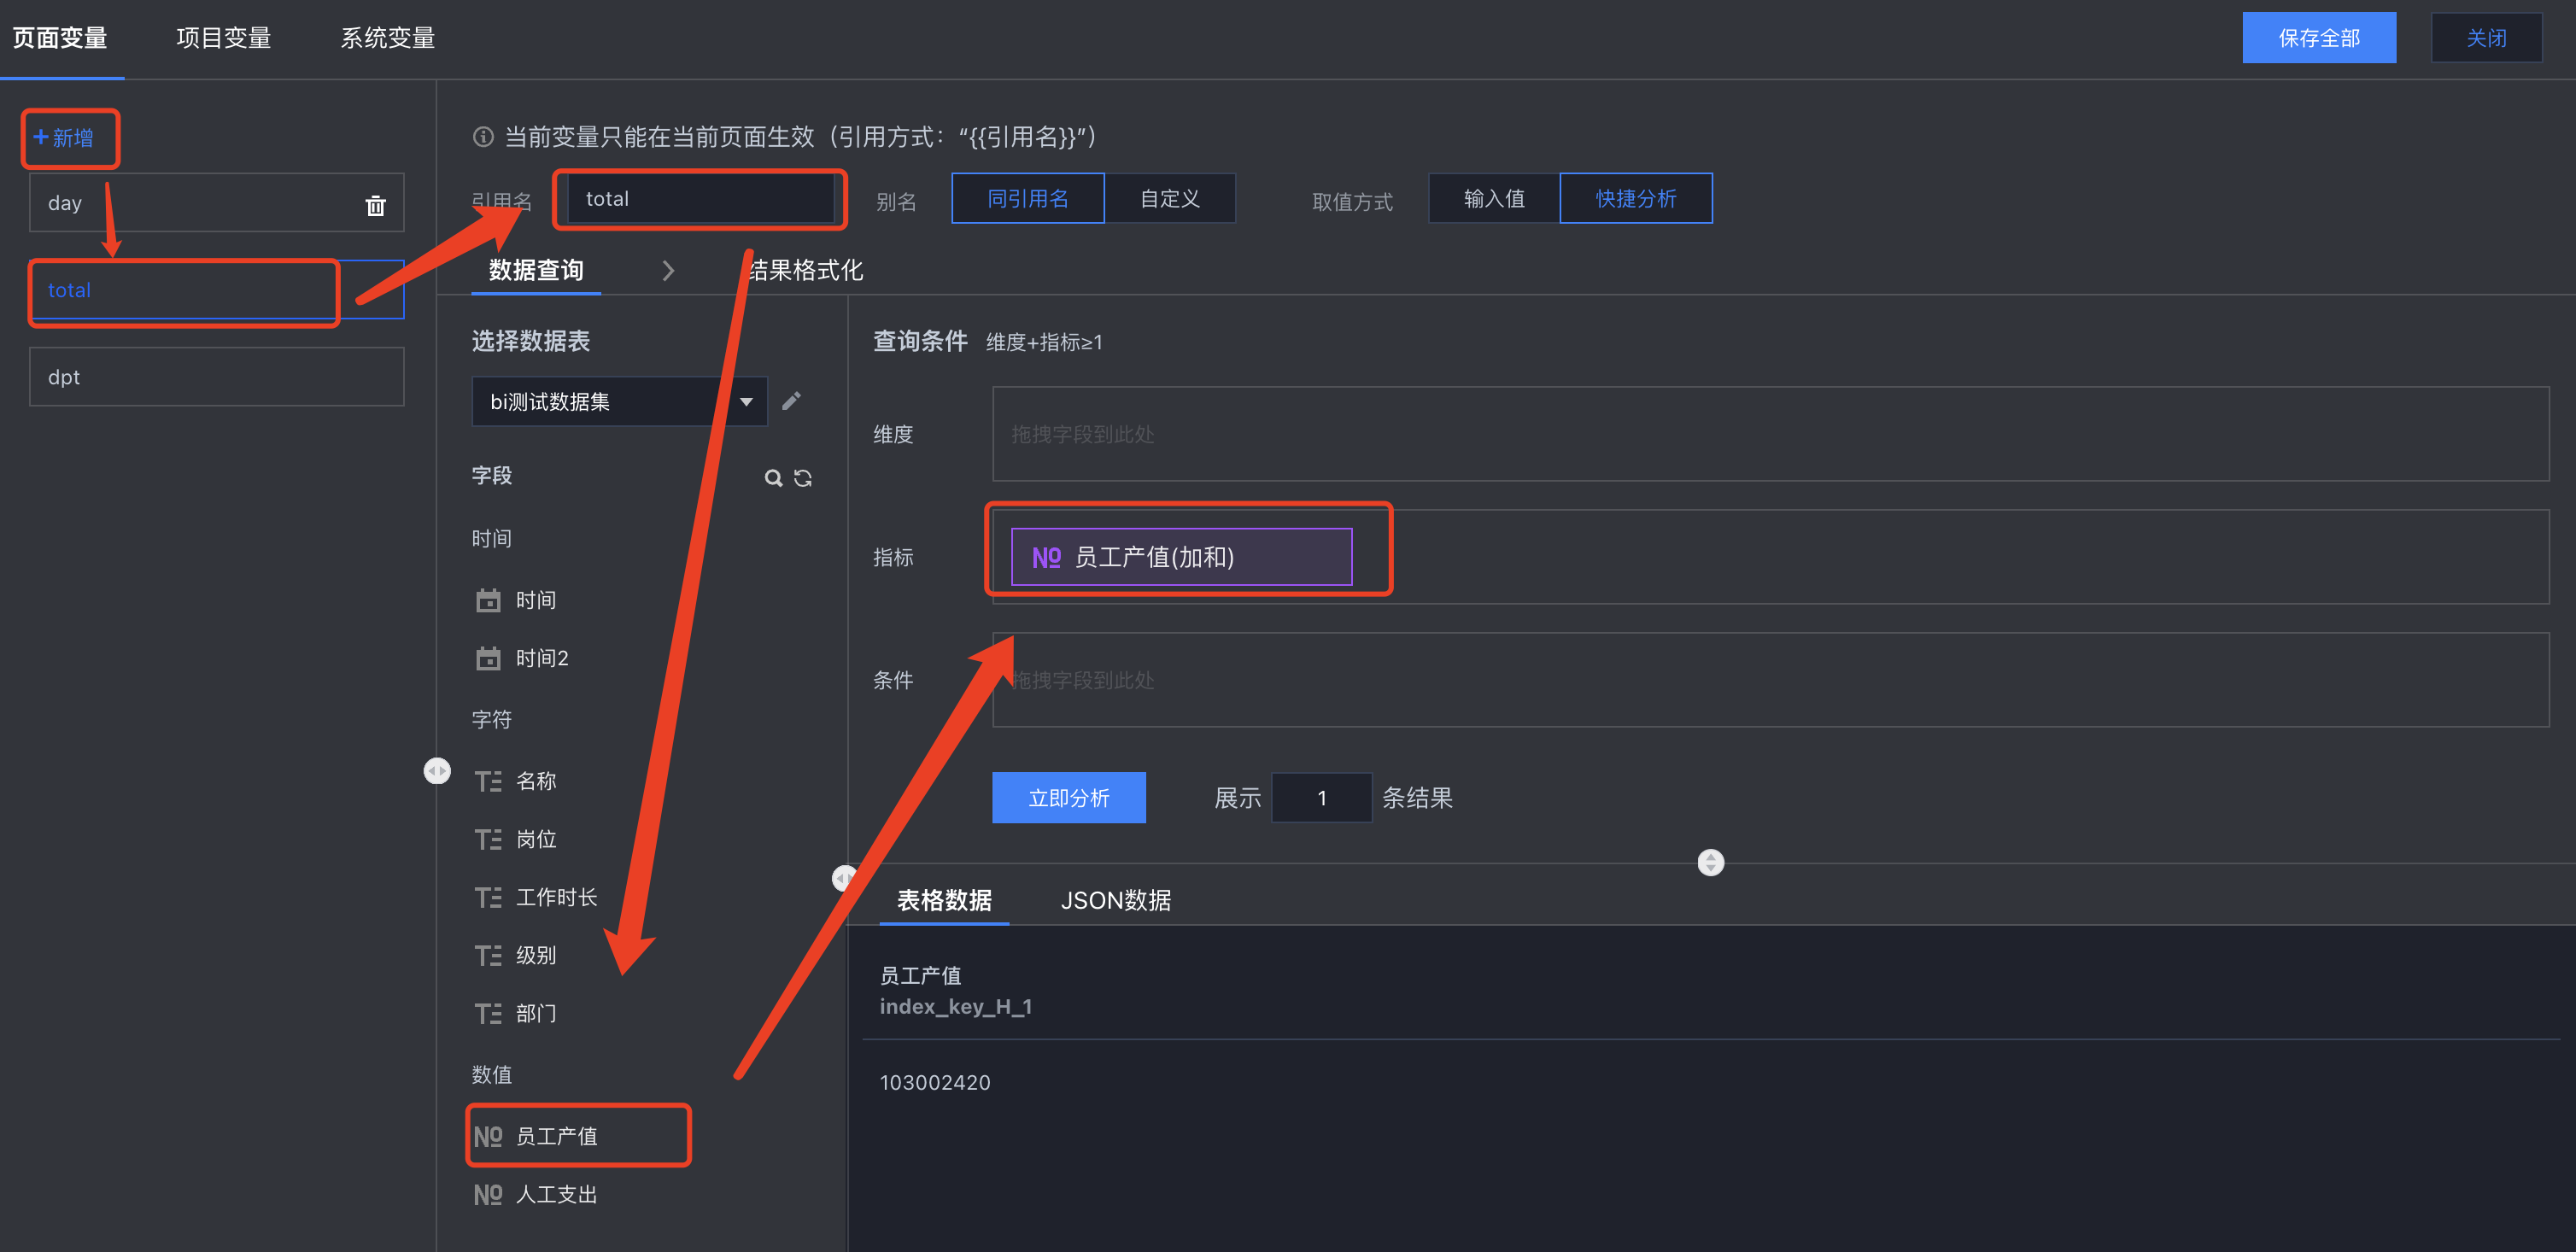
添加一个页面变量“total”, 拖入指标“员工产值”:
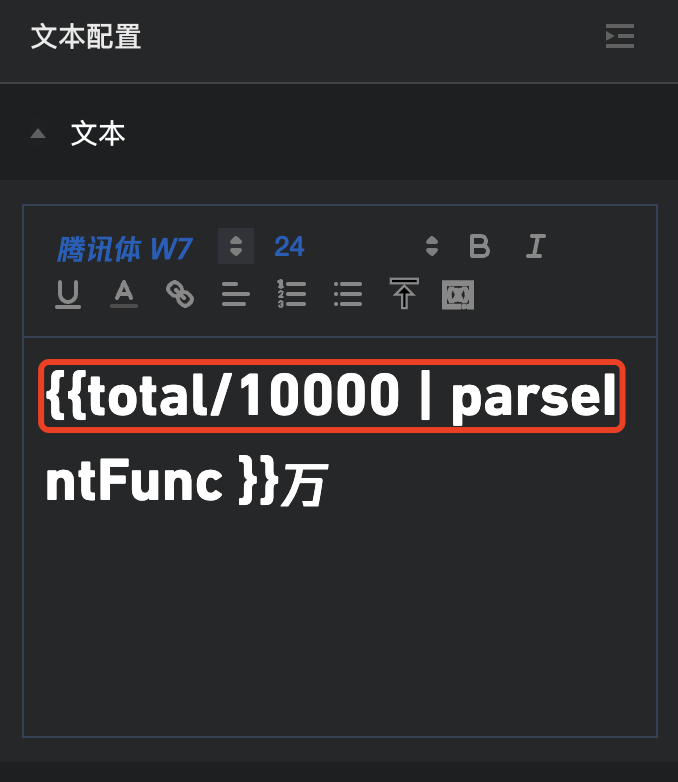
在文本组件中替换文本为变量,并对变量进行格式化(以万为单位,保留整数):
选中数字部分设置字体和字号:

1.3 设置【今日】值
创建一个页面变量“day”,用来按日分析数据,拖入维度(日期),指标(员工产值):

其中“员工产值”拖入3次,第一次设为加和,后面两个分别设置为“加和-日环比”、“加和-周同比”,并设置对应的显示名以示区分:

我们只需要今天数据,所以对时间时间进行倒序(您也可以将“时间”拖到条件设置了,设置时间为“今日”);展示结果设置为1行;
在“结果格式化”里,将结果返回为整行:

在文本组件中替换文本为变量,并对变量进行格式化(通过数组取得“index_key_H_1”列数据):
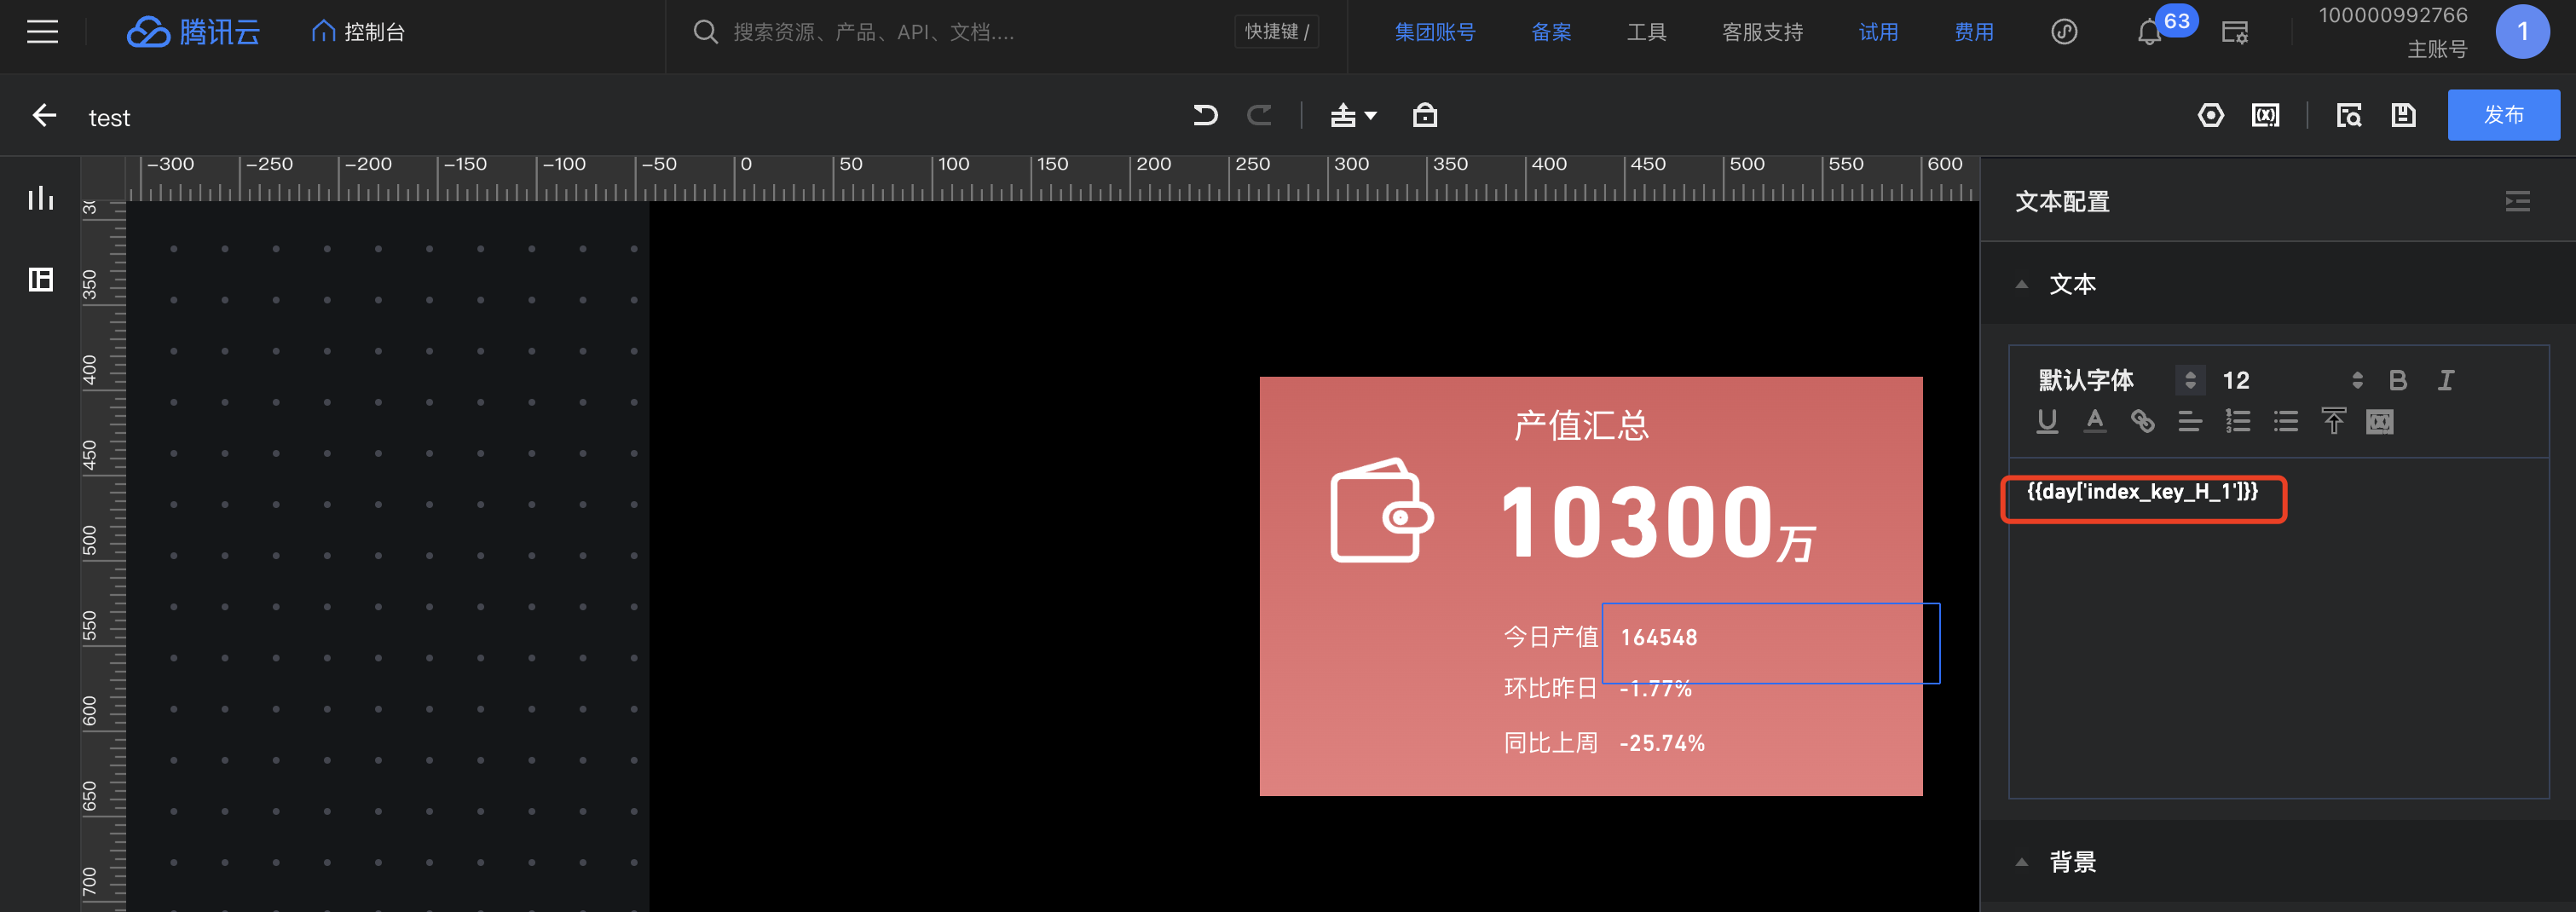
设置字体和字号。
1.4 设置【环比】值
因为环比值已经放在“day”变量中,所以我们不用重新创建,只要从day中通过格式化取出来即可。
在文本组件中替换文本为变量,并对变量进行格式化(通过数组取得“index_key_H_2”列数据,并对该值进行百分比展示):
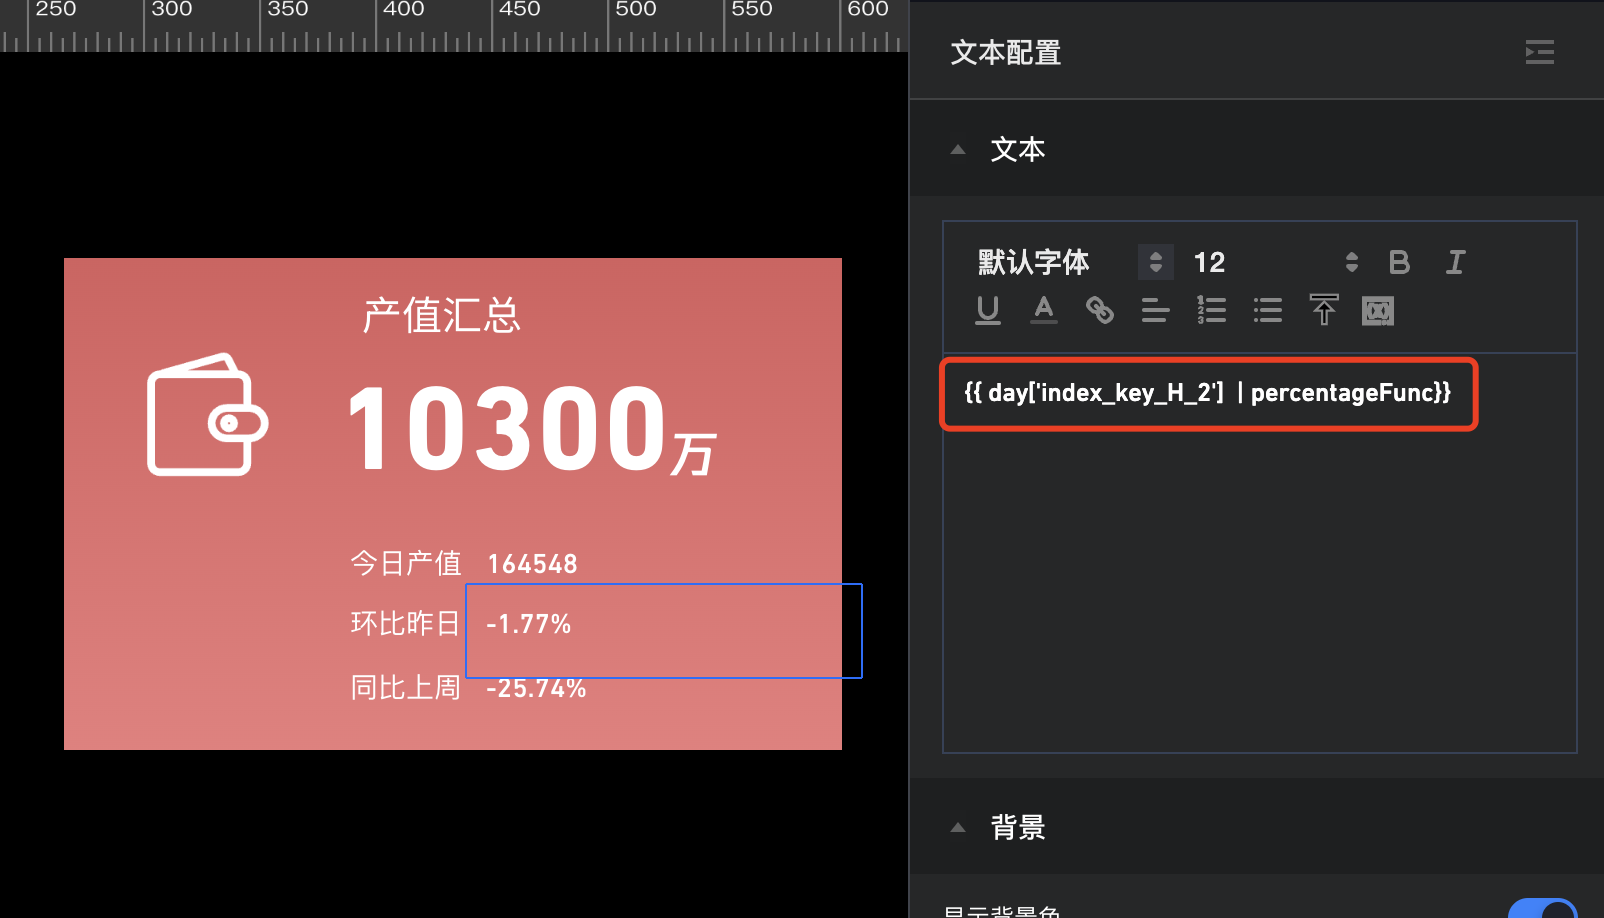
设置字体和字号。
1.5 设置【同比】值
在文本组件中替换文本为变量,并对变量进行格式化(通过数组取得“index_key_H_3”列数据,并对该值进行百分比展示):
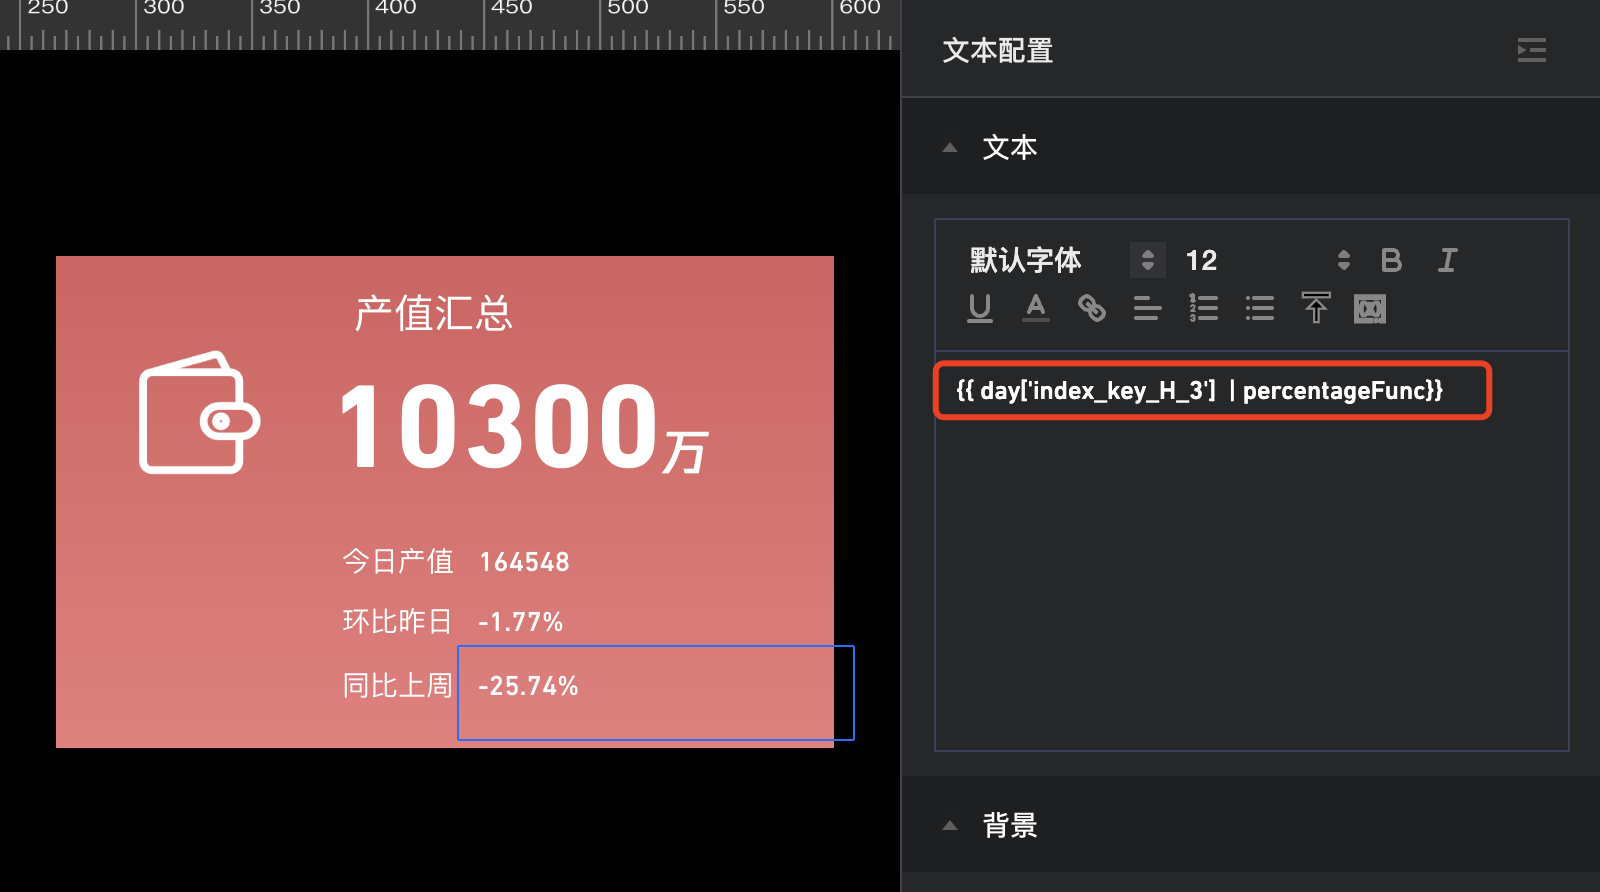
设置字体和字号。
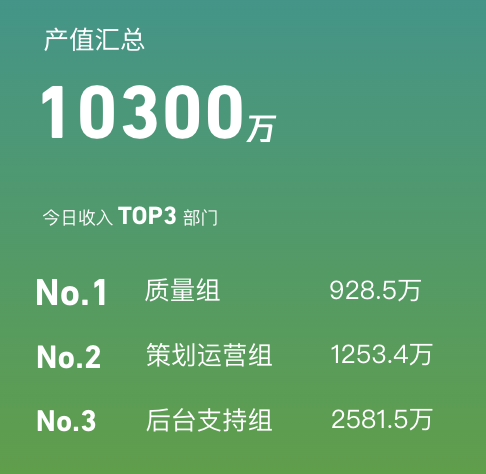
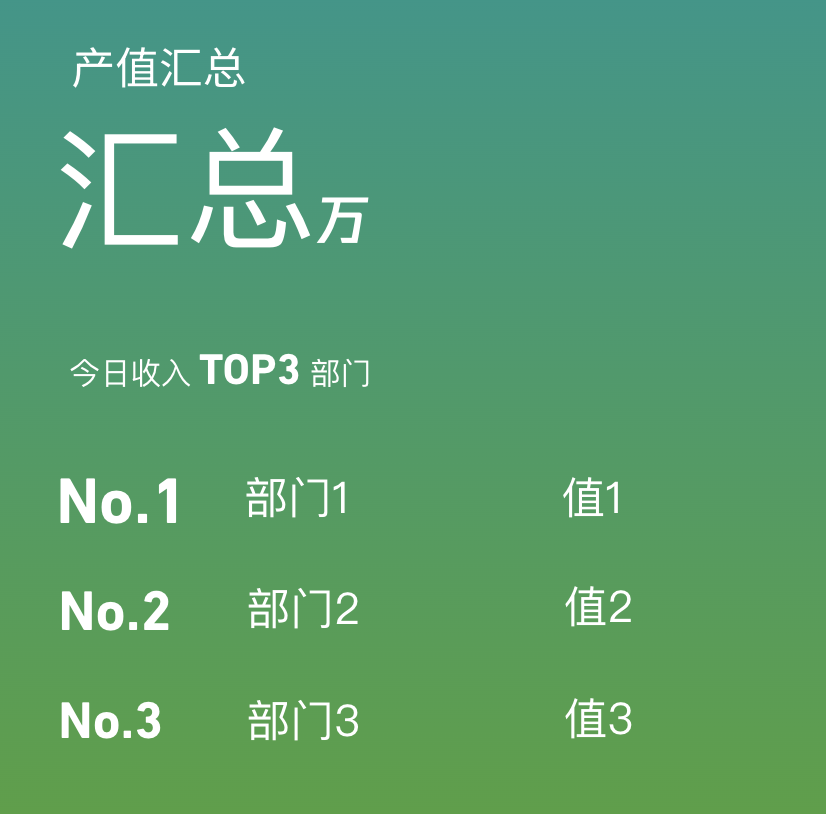
2. 带排名的指标卡
最终效果:
制作过程如下:
2.1 分别加入背景图片及文本,效果如下:
2.2 设置【汇总指标】: 同第一种指标卡的“汇总指标”制作;
2.3 设置【部门1】值:
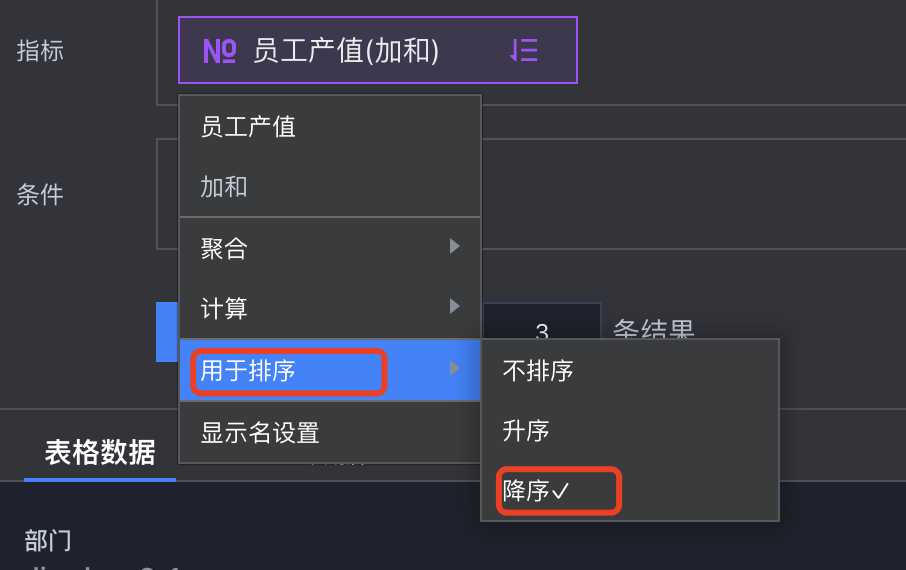
添加一个页面变量“dpt”, 分别拖入维度(部门)、指标(员工产值):

对员工产值指标设置倒序排列:
展示结果条数限制为“3”,即TOP3;
在“结果格式化”里,将结果返回为所有行:
在文本组件中替换文本为变量,并对变量进行格式化(通过数组取得第一行里的“dim_key_G_1”列数据):
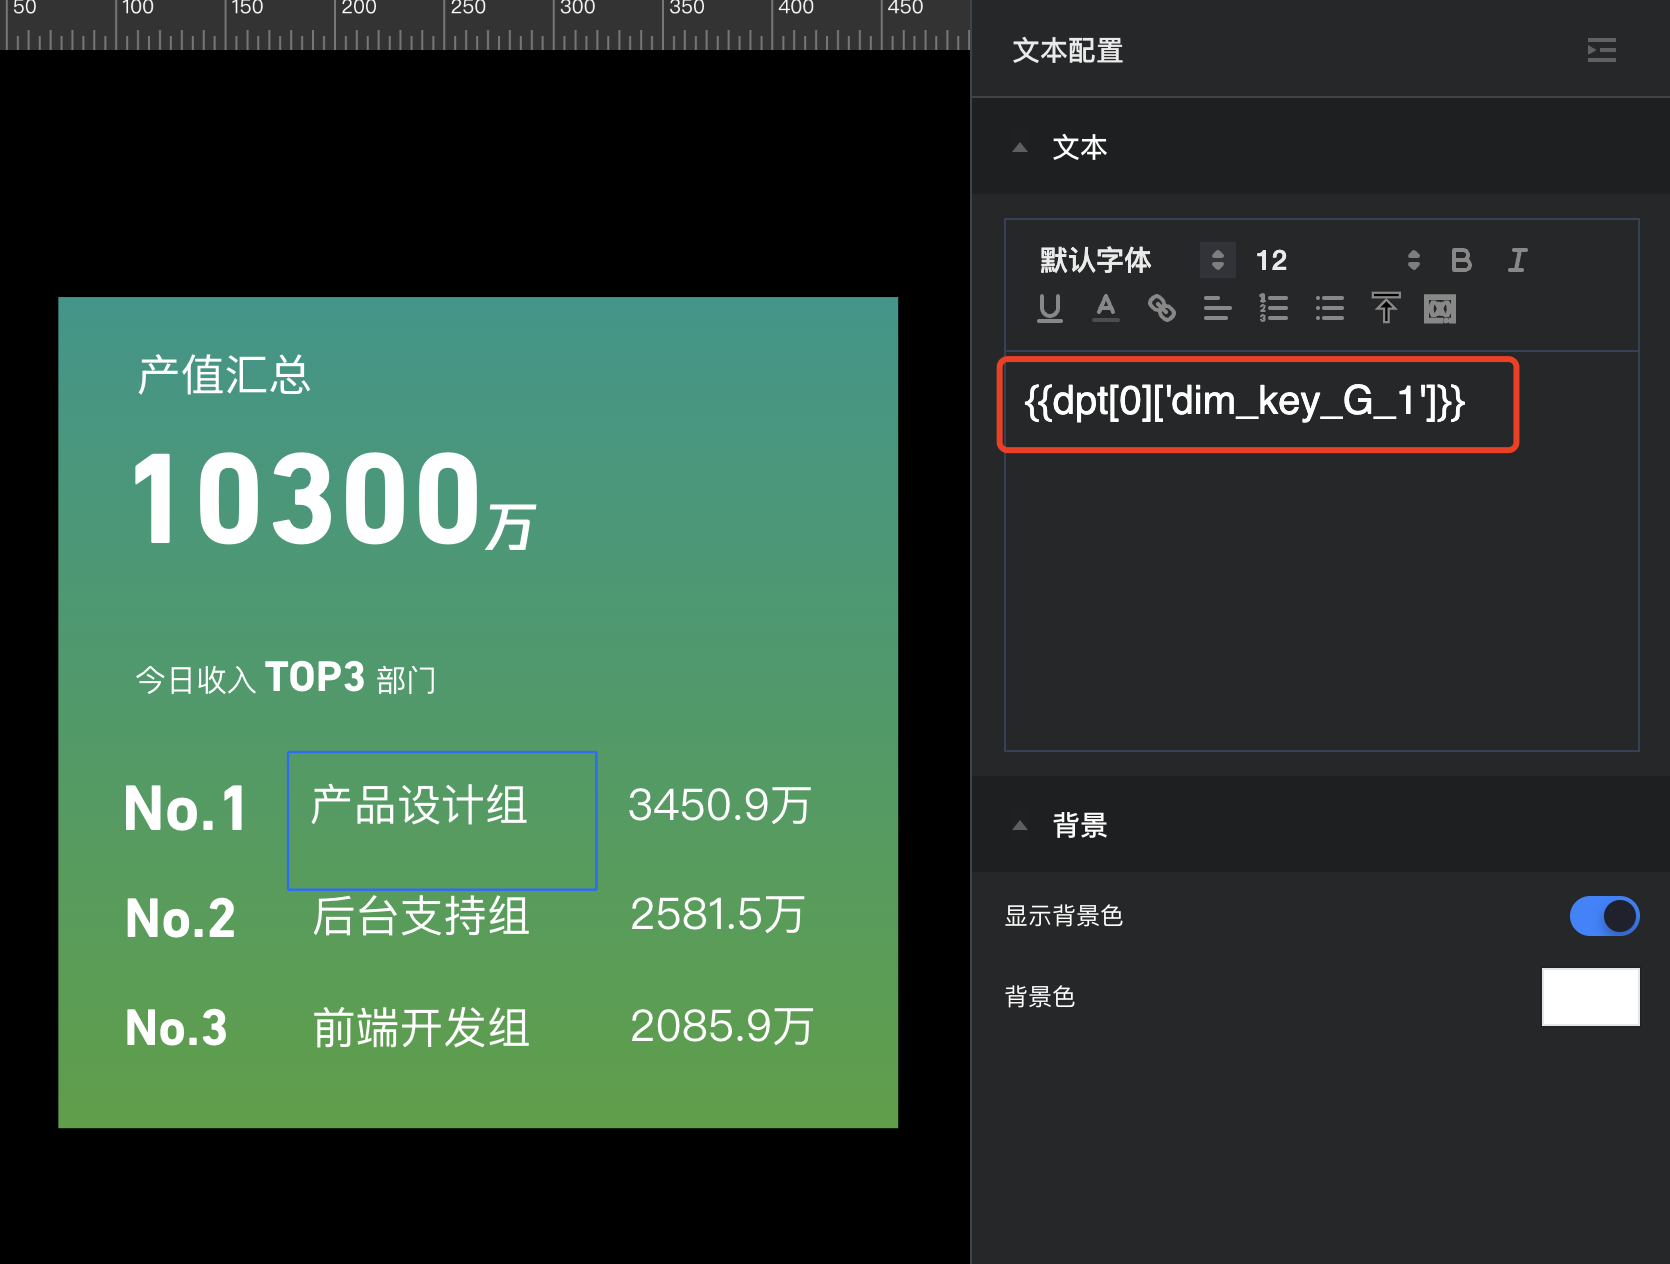
选中文本,设置字体和字号。
1.4 设置【值1】值:
在文本组件中替换文本为变量,并对变量进行格式化(通过数组取得第一行里的“index_key_H_1”列数据,并设置为以万为单位,保持1位小数):
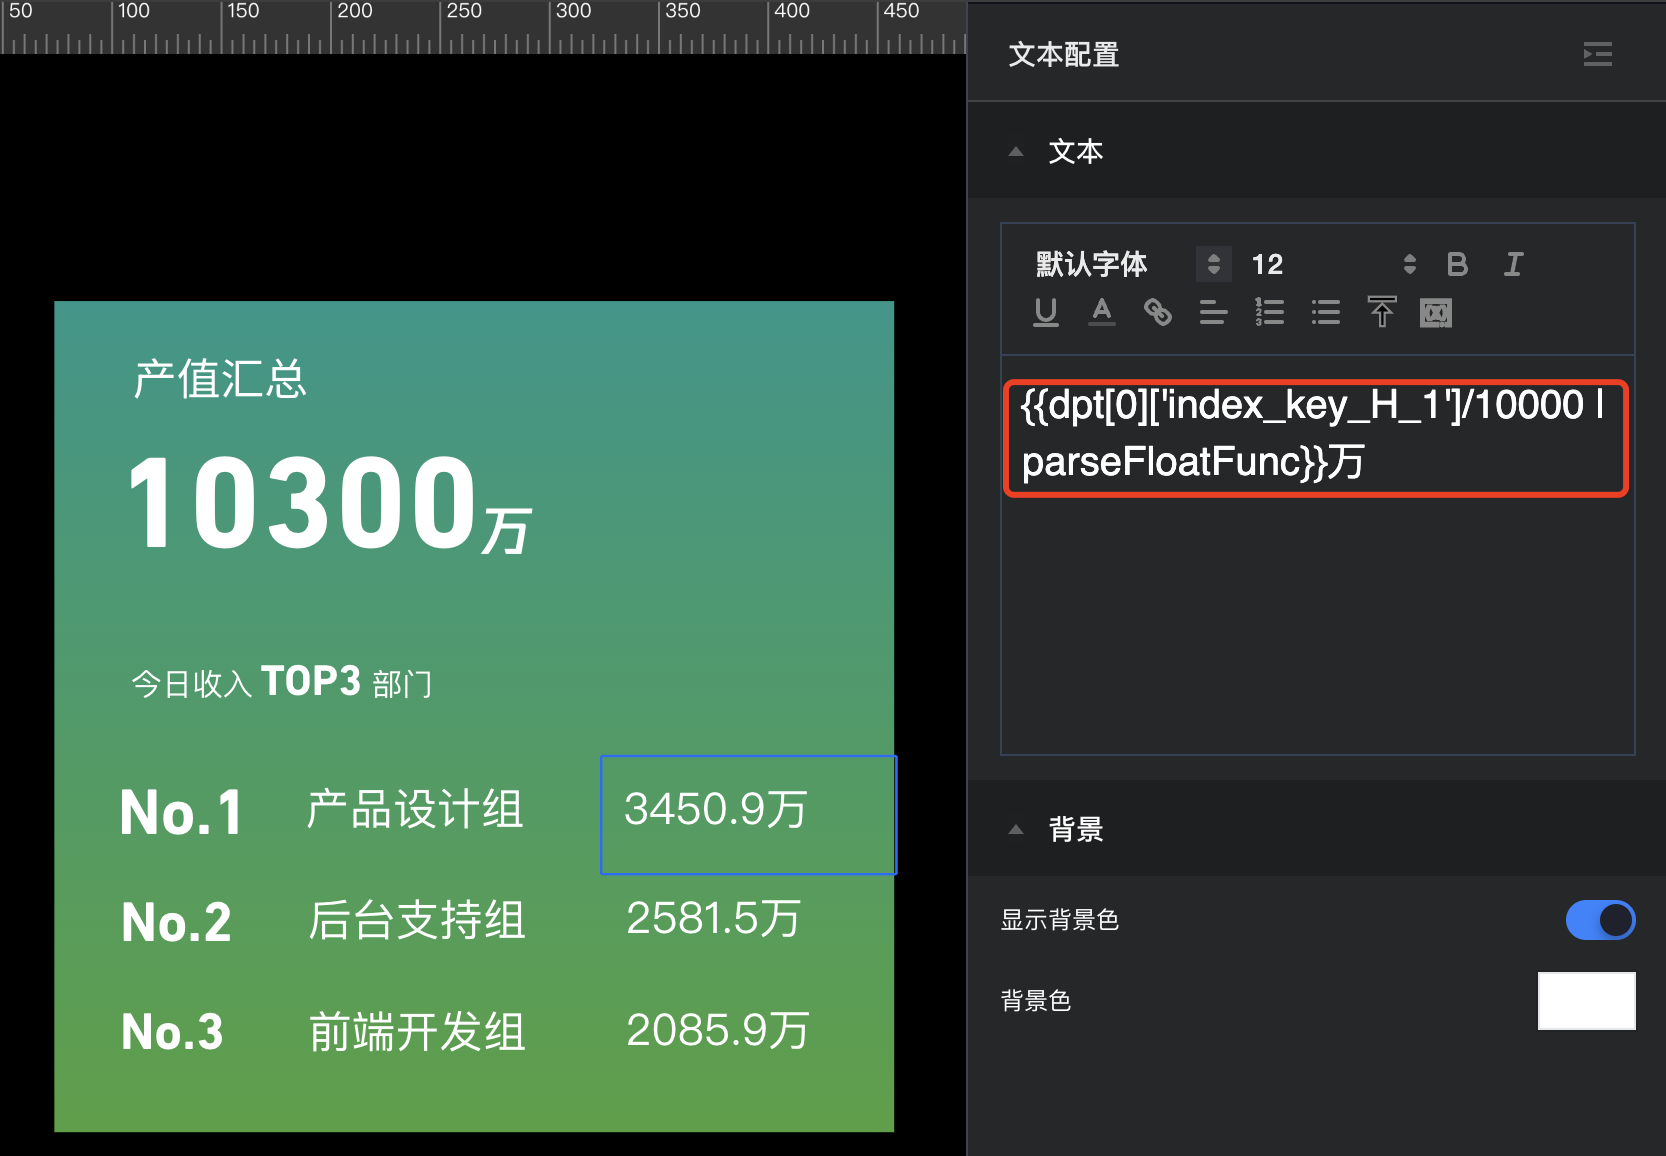
选中文本,设置字体和字号。
1.5 同理,设置【部门2】和【部门3】的值。
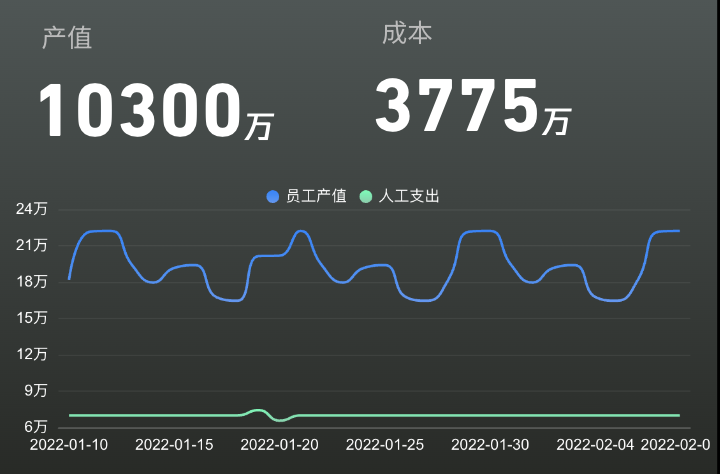
3. 带趋势图的指标卡
最终效果:
制作过程如下:
3.1 分别加入背景图片、文本及折线图,效果如下:
3.2 设置【收入】和【成本】值:
这个场景需要展示收入和成本两个汇总指标,所以我们修改下“total”变量,增加一个指标“人工成本”:
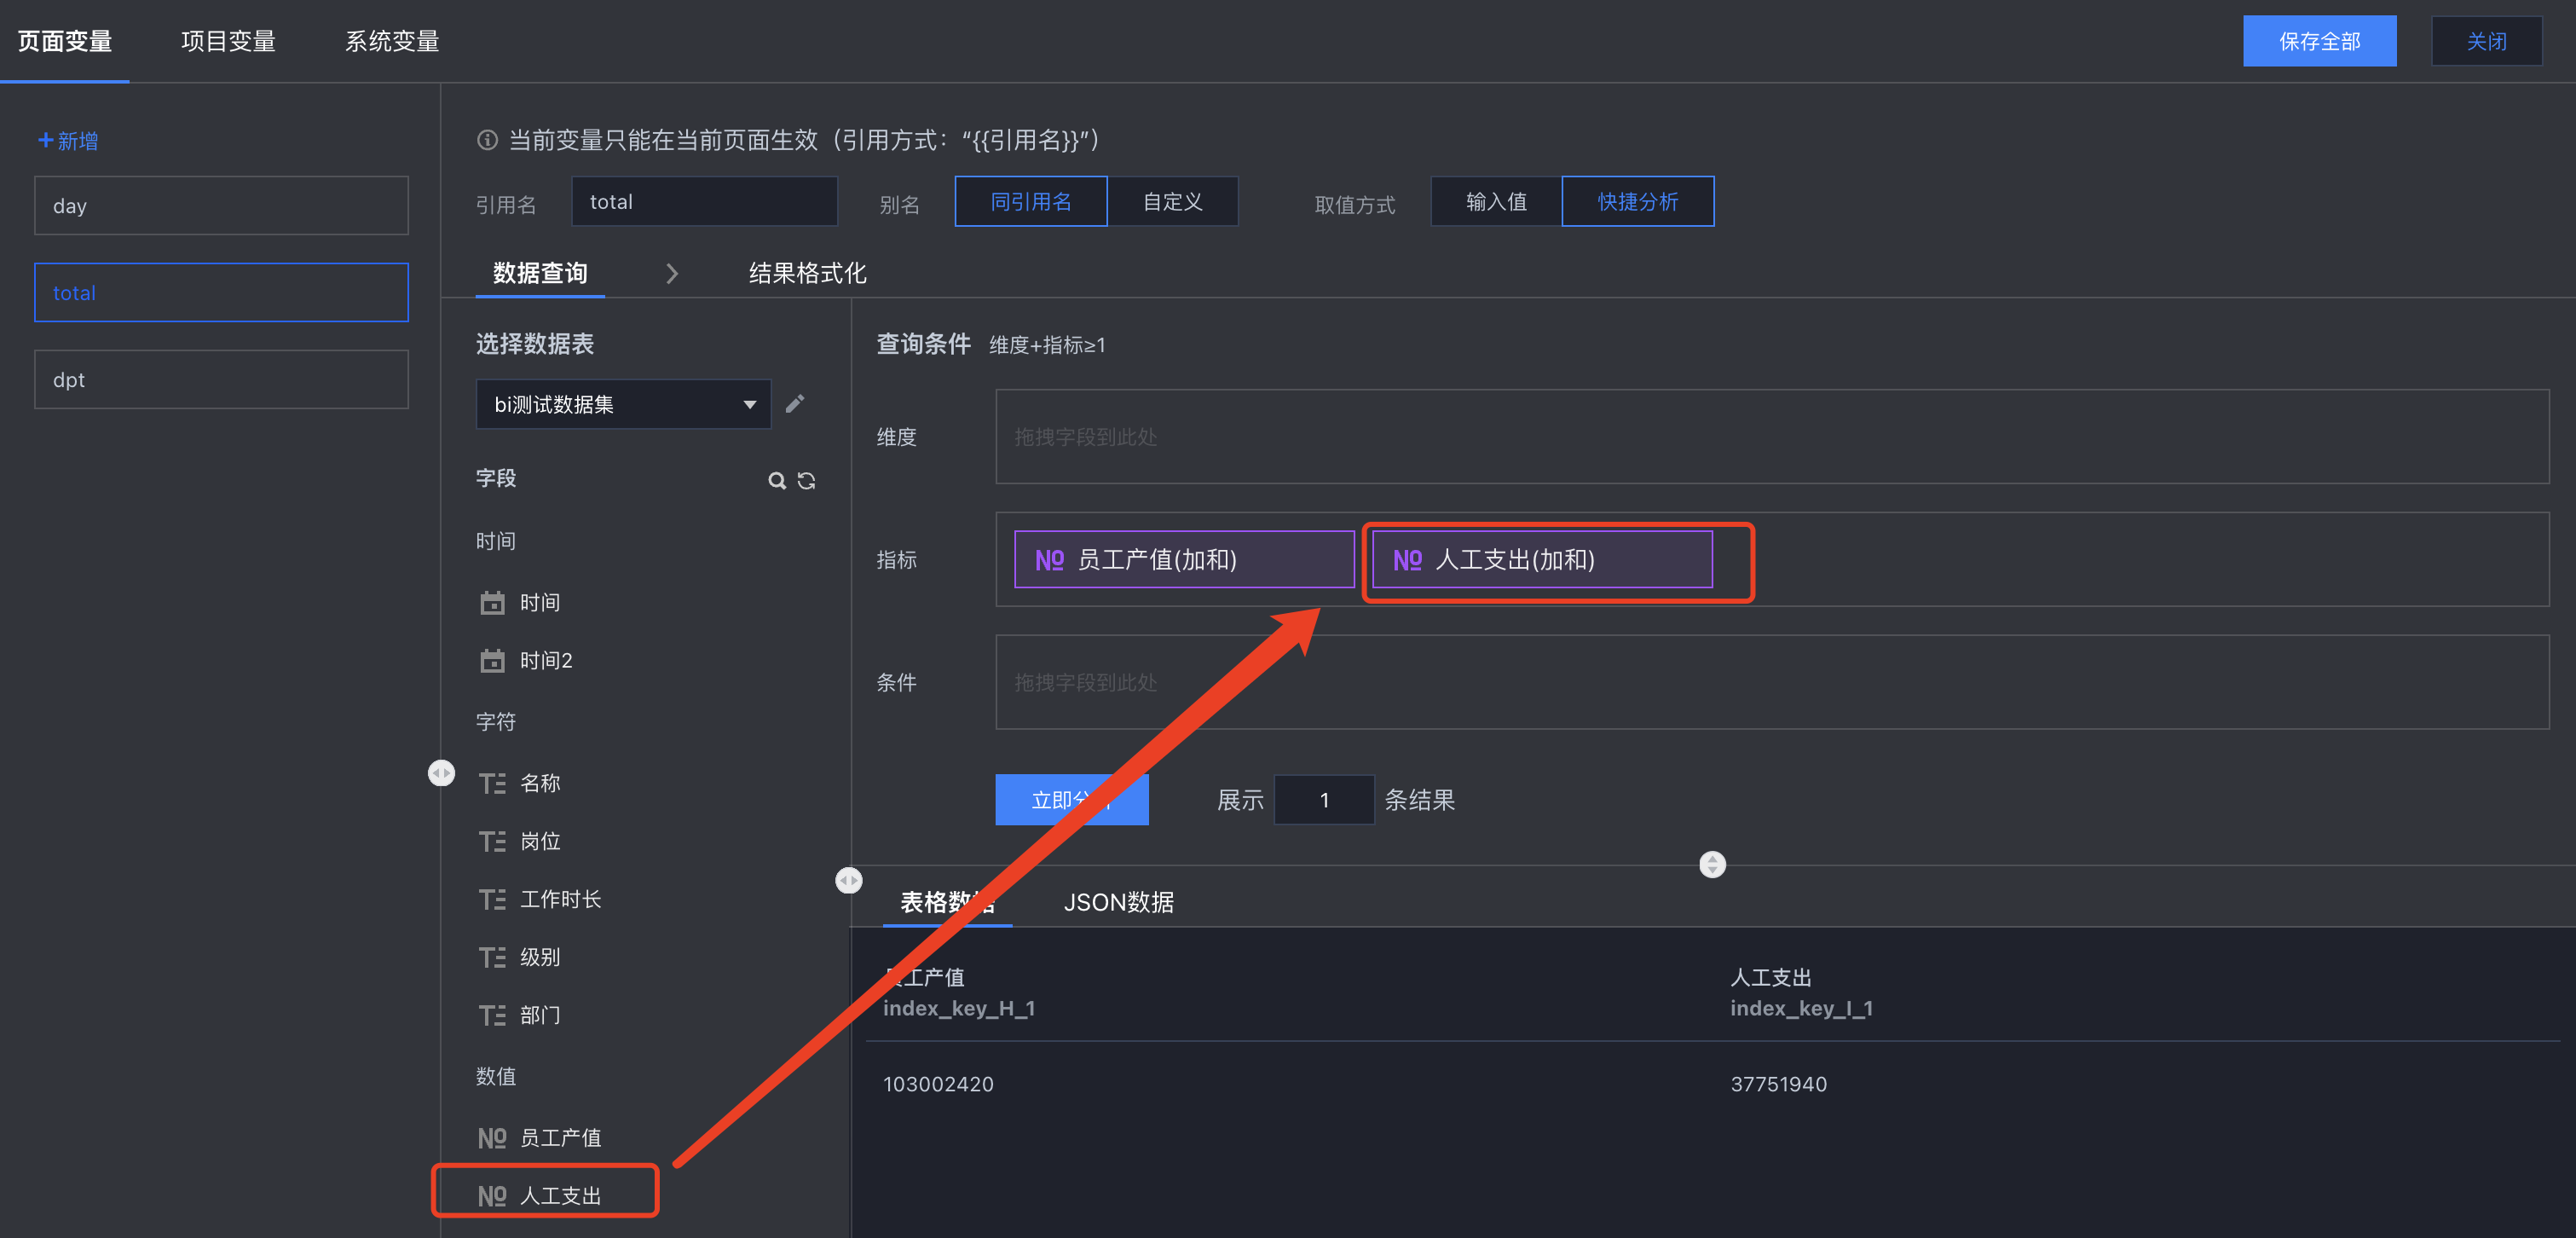
将结果格式化为返回整行:
在文本组件中替换文本为变量,并对变量进行格式化(通过数组取得第一行里的“index_key_H_1”列数据,并设置为以万为单位):
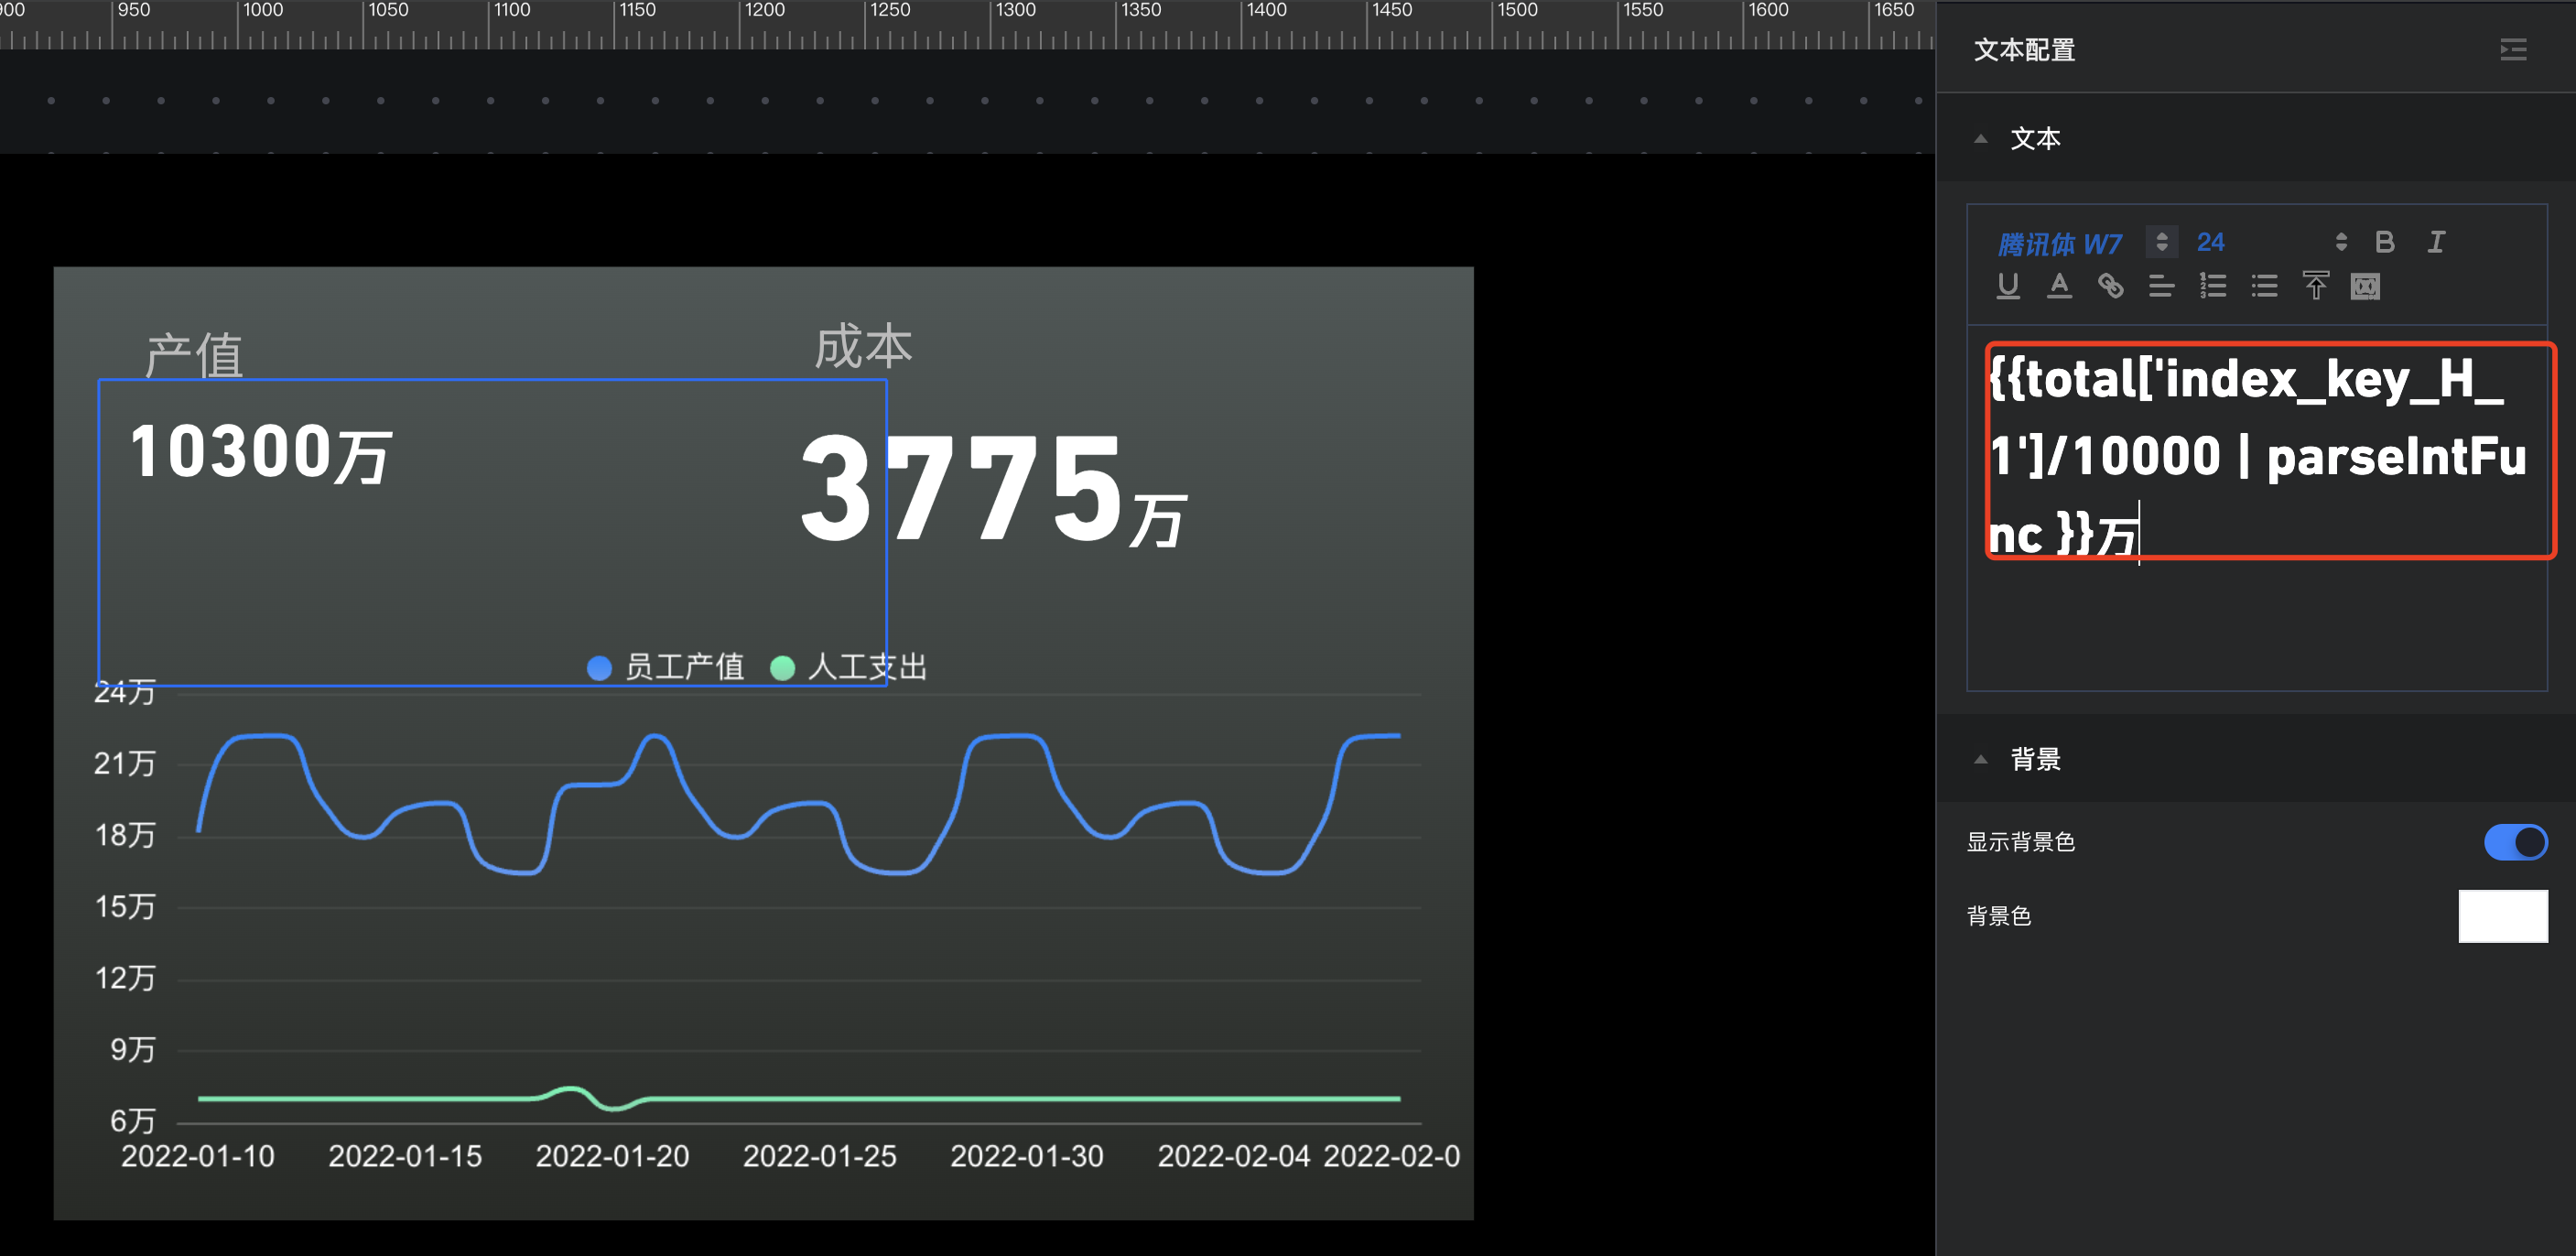
选中文本,设置字体和字号;
同理设置【成本】值,只需要将“index_key_H_1”列改成“index_key_I_1”列即可。
3.3 设置趋势图表:
选择数据表和字段,分别设置趋势图的维度和指标:
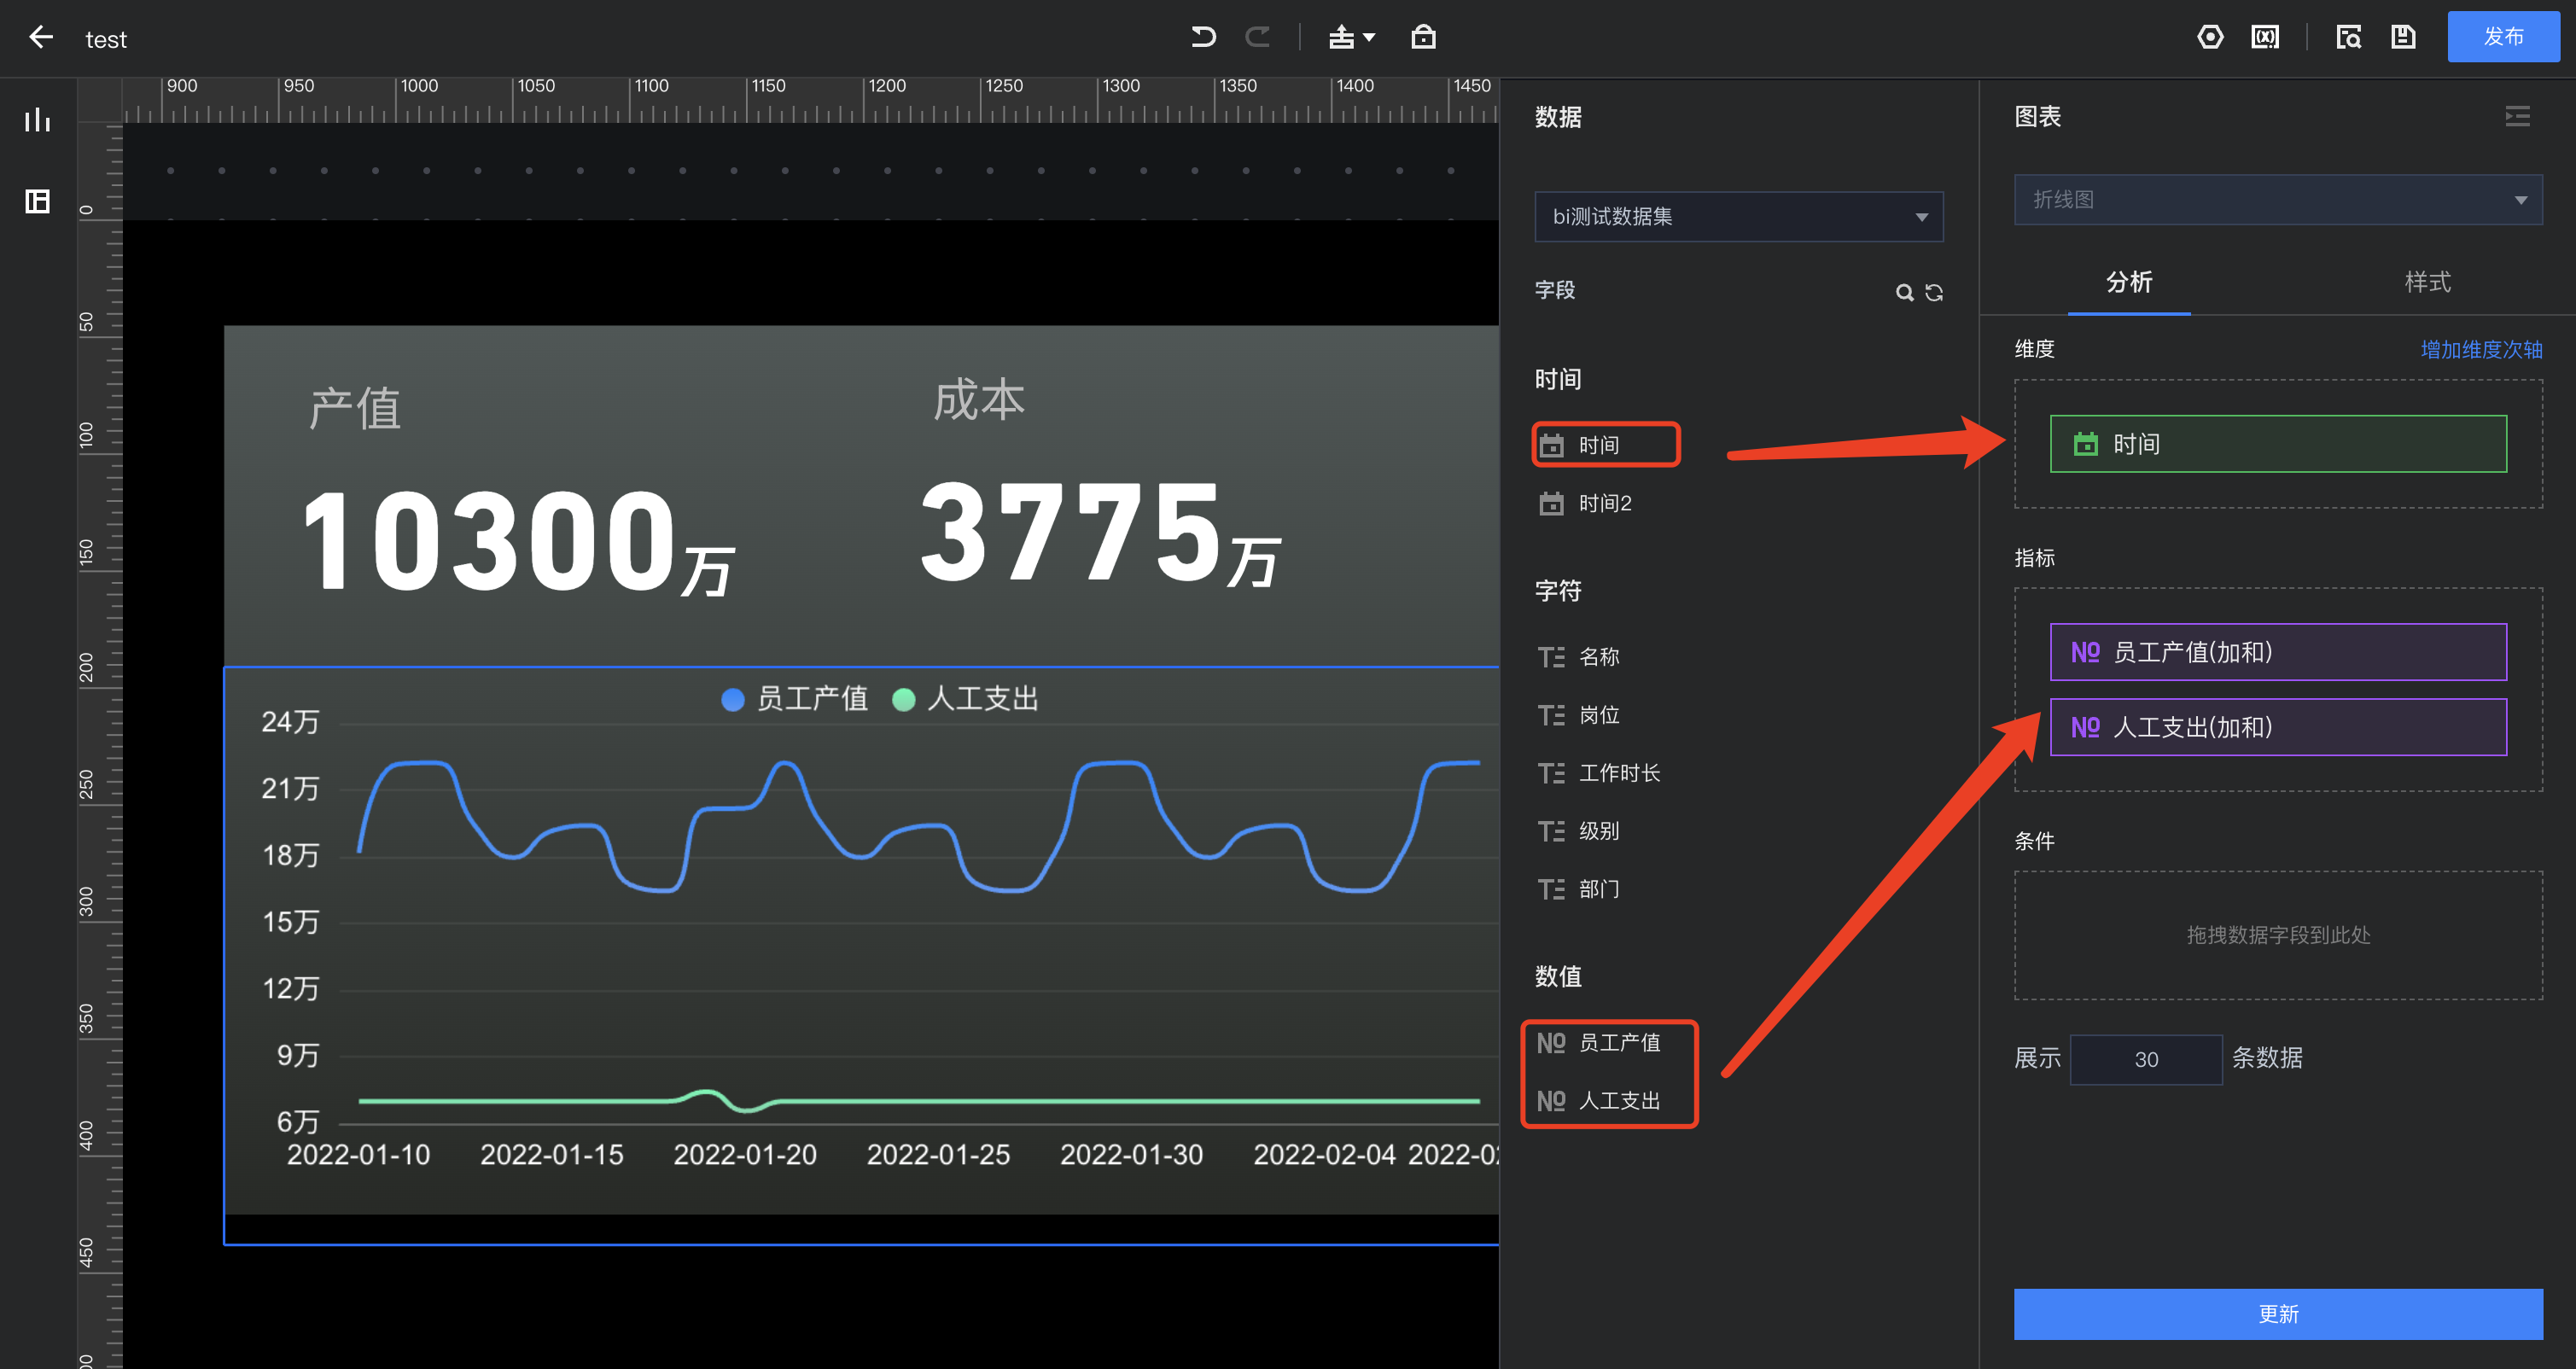
设置趋势图的样式: