【SNP 6.0】TCGA CNV数据分析一条龙
最近被TCGAbiolinks这个包迷住了,一直在探索它,所以就插空放几期TCGA的芯片数据分析吧
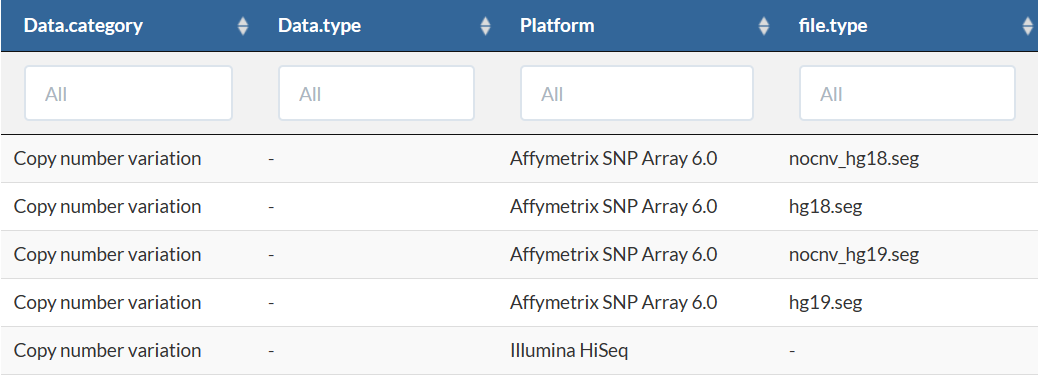
今天要讲的CNV数据是基于Affymetrix SNP 6.0 Affymetrix SNP 6.0 - GDC Docs (cancer.gov)得到的数据:
Affymetrix Genome-Wide Human SNP Array 6.0是Affymetrix的商业SNP阵列产品,包含遗传标记,包括单核苷酸多态性(SNPs)和用于检测拷贝数变异的探针。 来自Affymetrix SNP 6.0平台的数据被GDC用于生成统一的拷贝数变异文件。 与Affymetrix SNP 6.0探针相关的杂交水平被用来确定显示重复或缺失迹象的离散染色体区域。 关于GDC拷贝数变异管道的综合文件可在GDC文件网站上找到。 所有探针和与之相关的染色体区域(含GRCh38坐标)的列表可在GDC参考文件网页上找到。
1数据下载
TCGAbiolinks: Downloading and preparing files for analysis (bioconductor.org)
装包先~
# 建议在服务器跑,有的数据文件太大!!!

rm(list=ls())
options(stringsAsFactors = F)
library(TCGAbiolinks)
library(SummarizedExperiment )
library(data.table)
library(dplyr)
library(stringr)
library(maftools)
Masked Copy Number Segment
query <- GDCquery(
    project = "TCGA-ACC",
    data.category = "Copy Number Variation",
    data.type = "Masked Copy Number Segment",
    access = "open"
)
GDCdownload(query, files.per.chunk = 100)
data <- GDCprepare(query)
当然,也可以直接通过网页下载:
[UCSC Xena (xenabrowser.net)](https://xenabrowser.net/datapages/?cohort=GDC TCGA Ovarian Cancer (OV)&removeHub=https%3A%2F%2Fxena.treehouse.gi.ucsc.edu%3A443) https://gdc-hub.s3.us-east-1.amazonaws.com/download/TCGA-OV.masked_cnv.tsv.gz; Full metadata
可以在网页看到这个数据的基本信息:
type of data | copy number |
|---|---|
assembly | hg38(记好这个信息,后面要用到) |
unit | log2(copy-number/2) |
platform | Affymetrix SNP 6.0 |
2segment&marker文件获取
segment文件获取:
##参考:https://www.jianshu.com/p/b8351a86a40b
data_CNV <- data
dim(data_CNV)
ov_cnv <- data_CNV[,-1]
ov_cnv <- ov_cnv[,c(6,1:5)]
##提取肿瘤样品
tumor_seg <- ov_cnv[substr(ov_cnv$Sample,14,15)=="01",]
names(tumor_seg) <- c("Sample","Chromosome","Start Position","End Position","Num markers","Seg.CN")
dim(tumor_seg) ##336810      6
head(tumor_seg)
write.table(tumor_seg,file = "../output/tumor_seg.txt",sep = "\t",
            quote = F,col.names = T,row.names = F)
segment文件是这样滴⬇

marker文件获取:
GDC Reference Files | NCI Genomic Data Commons (cancer.gov) snp6.na35.remap.hg38.subset.txt.gz【特别强调:If you are using Masked Copy Number Segment for GISTIC analysis, please only keep probesets with freqcnv = FALSE】

##提取marker文件
hg_marker_file <- read.delim("../input/snp6.na35.remap.hg38.subset.txt.gz")
dim(hg_marker_file) ## 1837507       7
view(head(hg_marker_file))
Hg_marker_file <- hg_marker_file[hg_marker_file$freqcnv=="FALSE",]
head(Hg_marker_file)
Hg_marker_file <- Hg_marker_file[,1:3]
names(Hg_marker_file) <- c("Marker Name","Chromosome","Marker Position")
head(Hg_marker_file)
write.table(Hg_marker_file,file = "../output/Hg_marker.txt",sep = "\t",col.names = T,row.names = F)
# 后续网站分析:GenePattern[]
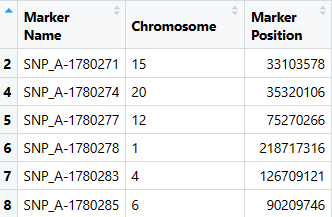
处理好的marker文件长这样⬇
3GISTIC2在线分析
Genepattern(https://cloud.genepattern.org/) GenePattern
Parameters[重要的参数设置]
Name | Flag | Description |
|---|---|---|
refgene file * | -refgene | The reference file including cytoband and gene location information.【通过前面的网页知道该肿瘤的CNV数据的参考基因组是hg38】 |
seg file * | -seg | The segmentation file contains the segmented data for all the samples identified by GLAD, CBS, or some other segmentation algorithm. (See GLAD file format in the Genepattern file formats documentation.) It is a six column, tab-delimited file with an optional first line identifying the columns. Positions are in base pair units. |
markers file * | -mk | The markers file identifies the marker names and positions of the markers in the original dataset (before segmentation). It is a three column, tab-delimited file with an optional header. If not already, markers are sorted by genomic position. |
Input Files【输入文件要求】
- Reference Genome File (-refgene) (REQUIRED) The reference genome file contains information about the location of genes and cytobands on a given build of the genome. Reference genome files are created in MATLAB TM and are not viewable with a text editor. The GISTIC 2.0 release includes the following reference genomes: hg16.mat, hg17.mat, hg18.mat, and hg19.mat).
- Segmentation File (-seg) (REQUIRED)
The segmentation file contains the segmented data for all the samples identified by GLAD, CBS, or some other segmentation algorithm. (See GLAD file format in the GenePattern file formats documentation.) It is a six column, tab-delimited file with an optional first line identifying the columns. Positions are in base pair units. Seg.CN values should be log transformed; if not, GISTIC will automatically log transform the values. The column headers【列名】 are:
- Sample (sample name)
- Chromosome (chromosome number)
- Start Position (segment start position, in bases)
- End Position (segment end position, in bases)
- Num markers (number of markers in segment)
- Seg.CN (log2() -1 of copy number)]
- Markers File (-mk) (REQUIRED)
The markers file identifies the marker names and positions of the markers in the original dataset (before segmentation). It is a three-column, tab-delimited file with an optional header. The column headers 【列名】are:
- Marker Name (marker name)
- Chromosome (chromosome number)
- Marker Position (in bases)
操作步骤:
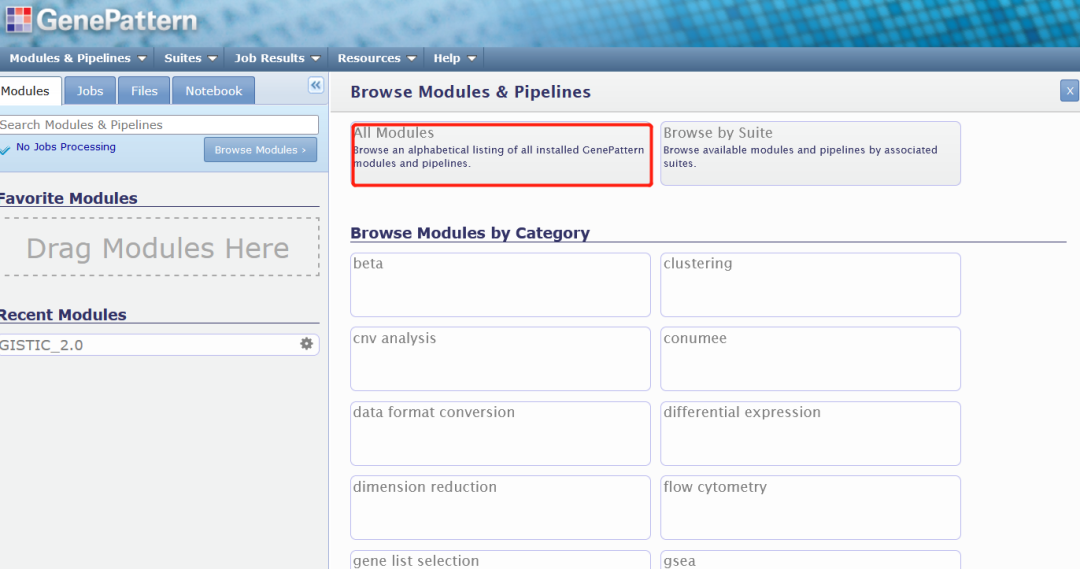
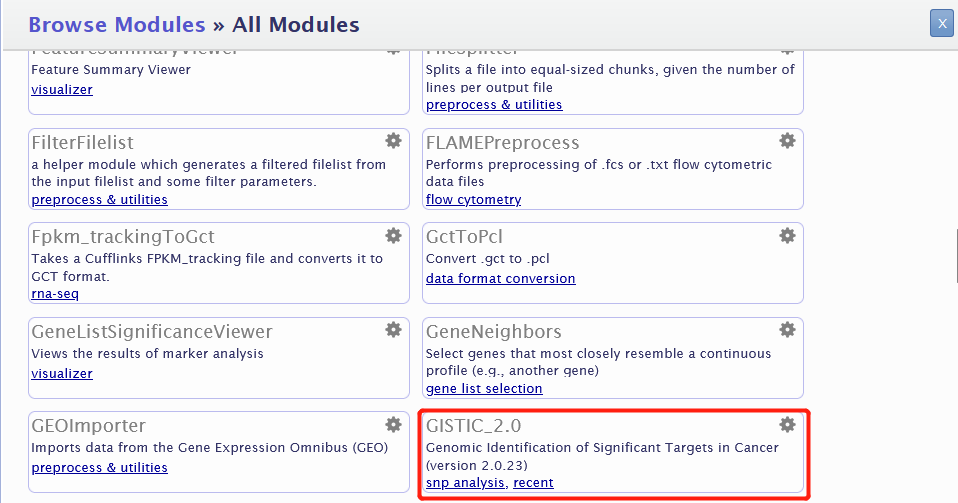
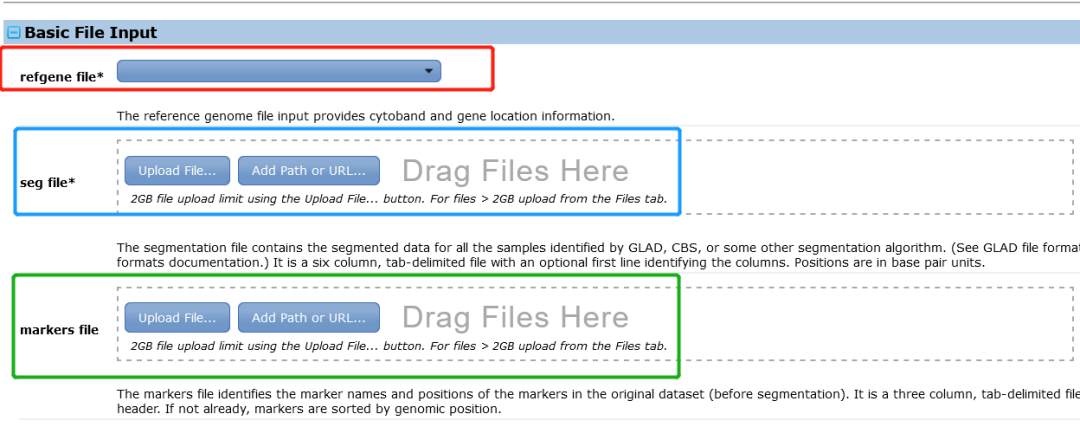
注意这里的refgene file只需要下拉选择即可,一般是最后一个hg38。其他的选项默认无需修改。
不知道为啥,我这里反复报错,被卡了一天,愣是解决不了。。。QAQ
放一下我的报错:
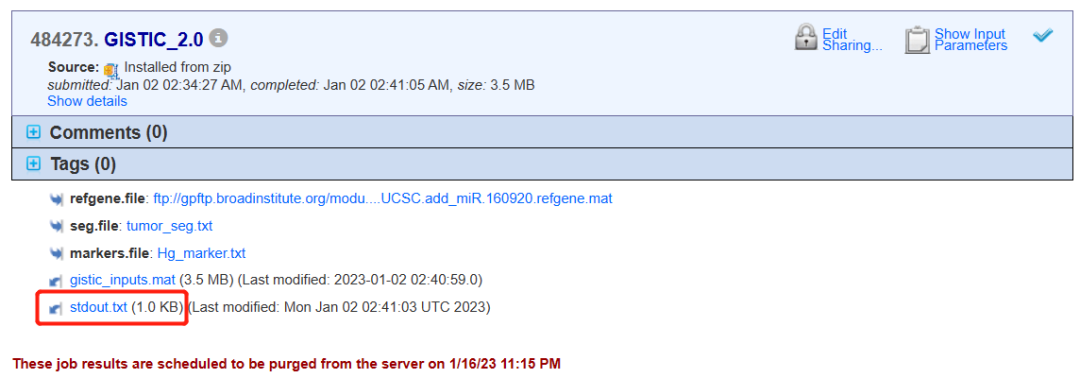
GISTIC version 2.0.23

GISTIC 2.0 input error detected:
2 segment start or end positions in '/opt/gpcloud/gp_home/users/lililing/uploads/tmp/run6121163688538704524.tmp/seg.file/1/tumor_seg.txt' do not match any markers in '/opt/gpcloud/gp_home/users/lililing/uploads/tmp/run5326984770428109351.tmp/markers.file/2/Hg_marker.txt'.
First bad position is 3:187999996 at line 20919.
也参考了很多帖子,看到很多同学好像也是跑不出来,然后大家的建议我总结起来放在这里——
- 改marker文件的列名,根据官网改成:"Marker Name", "Chromosome", "Marker Position";
- segment文件存在overlap,参考下面的代码调整数据➡https://github.com/ShixiangWang/install_GISTIC/blob/b920b541b95c6aea7545bc7164d22238e6df6eab/README.md【这个代码我实在是没理解,是在linux环境下用了R??】
- hg_marker_file文件中freqcnv=F的行一定要去除,并只输入该文件的前三列!
- 只填refgene文件和segment文件

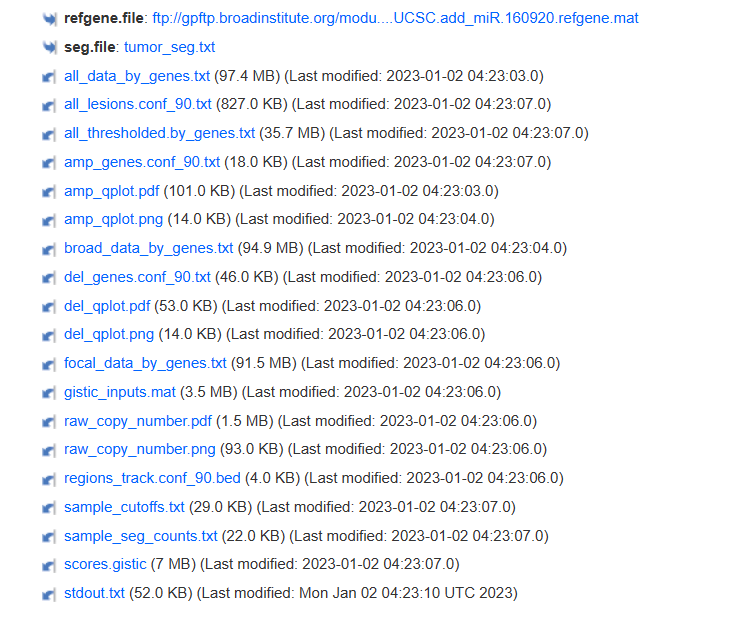
一个个试错,然后哇,终于成功了!!!
4结果解读
输出结果页面好多个文件(懒得数了),我们需要理解一下它们的意义,其中比较关键的是:
Output Files
【避免我拙劣的翻译给大家增加不必要的困难,这里放了官方的解释】
Tables of amplification peaks, followed by the genes contained in them, organized in "ragged columns." The amp genes file contains one column for each amplification peak identified in the GISTIC analysis. The first four rows are:
- cytoband
- q value
- residual q value
- wide peak boundaries
These rows identify the lesion in the same way as the all lesions file.
The remaining rows list the genes contained in each wide peak.
For peaks that contain no genes, the nearest gene is listed in brackets.
- All Lesions File (all_lesions.conf_XX.txt, where XX is the confidence level)
The all lesions file summarizes the results from the GISTIC run. It contains data about the significant regions of amplification and deletion as well as which samples are amplified or deleted in each of these regions. The identified regions are listed down the firstcolumn, and the samples are listed across the first row, starting in column 10.Region DataColumns 1-9 present the data about the significant regions as follows:
Sample Data
Each of the analyzed samples is represented in one of the columns following the lesion data (columns 10 through end). The data contained in these columns varies slightly by section of the file.
The first section can be identified by the key given in column 9 – it starts in row 2 and continues until the row that reads Actual Copy Change Given. This section contains summarized data for each sample. A ‘0’ indicates that the copy number of the sample was not amplified or deleted beyond the threshold amount in that peak region. A ‘1’ indicates that the sample had low-level copy number aberrations (exceeding the low threshold indicated in column 9), and a ‘2’ indicates that the sample had high-level copy number aberrations (exceeding the high threshold indicated in column 9).
The second section can be identified as the rows in which column 9 reads Actual Copy Change Given. The second section exactly reproduces the first section, except that here the actual changes in copy number are provided rather than zeroes, ones, and twos.
The final section is similar to the first section, except that here only broad events are included. A "1" in the samples columns (columns 10+) indicates that the median copy number of the sample across the entire significant region exceeded the threshold given in column 9. That is, it indicates whether the sample had a geographically extended event, rather than a focal amplification or deletion covering little more than the peak region.
- Unique Name: A name assigned to identify the region.
- Descriptor: The genomic descriptor of that region
- Wide Peak Limits: The “wide peak” boundaries most likely to contain the targeted genes. These are listed in genomic coordinates and marker (or probe) indices.
- Peak Limits: The boundaries of the region of maximal amplification or deletion.
- Region Limits: The boundaries of the entire significant region of amplification or deletion.
- q values: The q-value of the peak region.
- Residual q values after removing segments shared with higher peaks : The q-value of the peak region after removing (“peeling off”) amplifications or deletions that overlap other more significant peak regions in the same chromosome.
- Broad or Focal: Identifies whether the region reaches significance due primarily to broad events (called “broad”), focal events (called “focal”), or independently significant broad and focal events (called “both”).
- Amplitude Threshold: Key giving the meaning of values in the subsequent columns associated with each sample.
然后是对于拷贝数值的解释:
COPY NUMBER ESTIMATION Numeric focal-level Copy Number Variation (CNV) values were generated with "Masked Copy Number Segment" files from tumor aliquots using GISTIC2 on a project level. Only protein-coding genes were kept, and their numeric CNV values were further thresholded by a noise cutoff of 0.3:
- Genes with focal CNV values smaller than -0.3 are categorized as a "loss" (-1)
- Genes with focal CNV values larger than 0.3 are categorized as a "gain" (+1)
- Genes with focal CNV values between and including -0.3 and 0.3 are categorized as "neutral" (0).
5利用maftools进行可视化
https://github.com/PoisonAlien/maftools

#Install from Bioconductor repository
BiocManager::install("maftools")

#Install from GitHub repository
BiocManager::install("PoisonAlien/maftools")
因为我要的东西其实已经通过GISTIC2获得了,后续对maftools的分析就没有过多地了解,参考了其他的帖子来简单运行了一下,大家可以按需使用:
rm(list = ls())
# https://www.jianshu.com/p/db0312ef62d1

##全局布置
options(timeout = 10000)

#Install from GitHub repository
# BiocManager::install("PoisonAlien/maftools")
library(maftools)
library(tidyverse) ##如果报错,参考:https://www.jianshu.com/p/a56e27d8784a
library(dbplyr)

#读入GISTIC输出的文件
ov.gistic = readGistic(gisticAllLesionsFile = '../gistic_output/all_lesions.conf_90.txt',
                         gisticAmpGenesFile = '../gistic_output/amp_genes.conf_90.txt',
                         gisticDelGenesFile = '../gistic_output/del_genes.conf_90.txt',
                         gisticScoresFile = '../gistic_output/scores.gistic',
                         isTCGA = F)
ov.gistic


# 2.1 可视化 ---------------------------------------------------------------------
#genome plot 部分突出了明显的扩增和删失区域
gisticChromPlot(gistic = ov.gistic, ref.build = 'hg38',
                markBands = "all") ## 参考基因组选hg38

### Bubble plot
gisticBubblePlot(gistic = ov.gistic)


### oncoplot
gisticOncoPlot(ov.gistic,top = 20)

# 挑选q<0.25的基因
(sig_cytoband <- ov.gistic@cytoband.summary %>% filter(qvalues<0.25) %>% .$Unique_Name)
table(grepl(pattern = "AP",sig_cytoband))

## 挑选q值小于0.25的Amplification cytoband------------
sig_AP_cytoband <- ov.gistic@cytoband.summary %>%
  filter(qvalues<0.25) %>%
  .$Unique_Name %>%
  .[grepl(pattern = "AP",.)]
length(sig_AP_cytoband)
## 将Amplification 的基因挑选出来
sig_AP_gene <- ov.gistic@data %>% filter(Cytoband %in% sig_AP_cytoband) %>% .$Hugo_Symbol
length(unique(sig_AP_gene))

## 看一下经典的抑癌基因在那个Cytoband
"CCNE1"%in% sig_AP_gene
ov.gistic@data %>%
  filter(Hugo_Symbol %in% "CCNE1") %>%
  .$Cytoband %>%
  unique(.)

## 挑选q值小于0.25的Deletion cytoband------------
sig_DP_cytoband <- ov.gistic@cytoband.summary %>%
  filter(qvalues<0.25) %>%
  .$Unique_Name %>%
  .[grepl(pattern = "DP",.)]
length(sig_DP_cytoband)
## 将Deletion cytoband 的基因挑选出来
sig_DP_gene <- ov.gistic@data %>% filter(Cytoband %in% sig_DP_cytoband) %>% .$Hugo_Symbol
length(unique(sig_DP_gene))


## 扩增基因的富集分析---------------------------
library(clusterProfiler)
library(org.Hs.eg.db)
# BiocManager::install("topGO")
library(topGO)

sig_AP_entrezId = mapIds(x = org.Hs.eg.db,
                         keys = unique(sig_AP_gene),
                         keytype = "SYMBOL",
                         column = "ENTREZID")

table(is.na(sig_AP_entrezId))

sig_AP_entrezId <- na.omit(sig_AP_entrezId)

go_ALL <- enrichGO(gene = sig_AP_entrezId,
                   OrgDb = org.Hs.eg.db,
                   keyType = "ENTREZID",
                   ont = "ALL",
                   pvalueCutoff = 0.5,
                   qvalueCutoff = 0.5)

##分析完成后,作图
dotplot(go_ALL, split="ONTOLOGY")+ facet_grid(ONTOLOGY~.,scale="free")

### 数目太多,我只要各个条目的前6个
BP_df<- go_ALL@result %>% arrange(desc(Count)) %>% filter(ONTOLOGY=="BP") %>% head()
CC_df<- go_ALL@result %>% arrange(desc(Count)) %>% filter(ONTOLOGY=="CC") %>% head()
MF_df<- go_ALL@result %>% arrange(desc(Count)) %>% filter(ONTOLOGY=="MF") %>% head()
go_df <- rbind(BP_df,CC_df,MF_df)

go_df$go_term_order=factor(x = c(1:nrow(go_df)),labels = go_df$Description)
library(ggsci)
p1 <- ggplot(data=go_df, aes(x=go_term_order,y=Count, fill=ONTOLOGY)) +
  geom_bar(stat="identity", width=0.8)  +
  scale_fill_jama() +
  theme_classic() +
  xlab("GO term") + ylab("Number of Genes") + labs(title = "The Most Enriched GO Terms")+
  theme(axis.text.x=element_text(face = "bold", color="gray50",angle = 60,vjust = 1, hjust = 1 ))
p1


# 2.2 可视化 -----------------------------------------------------------------
# https://blog.csdn.net/Ayue0616/article/details/127824394
BiocManager::install("BSgenome.Hsapiens.UCSC.hg38")
library(BSgenome.Hsapiens.UCSC.hg38) # 加载R包
# 提取染色体名字及长度:
df <- data.frame(chromName = seqnames(BSgenome.Hsapiens.UCSC.hg38), # 染色体名字
                 chromlength = seqlengths(BSgenome.Hsapiens.UCSC.hg38)# 每条染色体长度
)
df$chromNum <- 1:length(df$chromName) # 染色体名字纯数字版,为了和scores.gistic里面的对应

# 我们用的原始CNV文件是没有性染色体信息的
df <- df[1:22,] # 只要前22条染色体信息
str(df)
还有一种情况是:如果GISTIC2运行不出来,还有什么其他办法可以直接获取CNV数据呢?
只要思想不滑坡,办法总比困难多~
[UCSC Xena (xenabrowser.net)](https://xenabrowser.net/datapages/?cohort=TCGA Ovarian Cancer (OV)&removeHub=https%3A%2F%2Fxena.treehouse.gi.ucsc.edu%3A443)
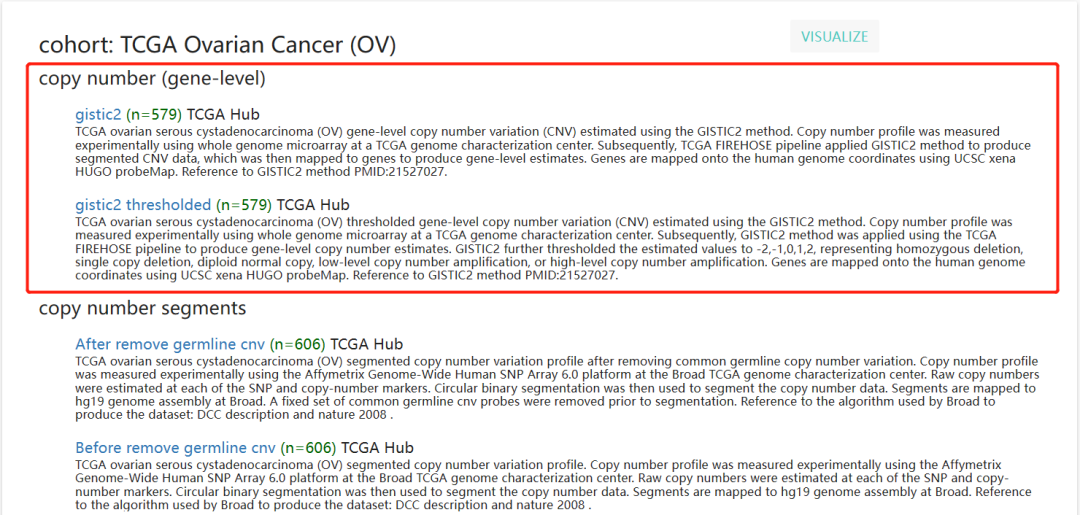
这部分的数据看样子是已经被GISTIC2 处理过的数据,行是基因,列是样本名,符合我要的数据挖掘的文件要求,就它了!
6参考资料:
[1] TCGA 拷贝数变异(CNV)分析 - 简书 (jianshu.com)
[2] TCGA数据库copy number variation数据分析(第一部分:从数据下载到GISTIC输出文件) - 简书 (jianshu.com)
[3] TCGA数据库copy number variation数据分析(第二部分:利用maftools进行可视化) - 简书 (jianshu.com)
[4] Bioinformatics Pipeline: Copy Number Variation Analysis - GDC Docs (cancer.gov)
[5] TCGA 拷贝数变异(CNV)数据整理(一) - 简书 (jianshu.com)
[6] TCGA 拷贝数变异(CNV)--Gistic 2.0在线分析(二) - 简书 (jianshu.com)
[7] TCGA 拷贝数变异(CNV)–使用maftools读取和汇总gistic输出文件(三) - 简书 (jianshu.com)
本文参与 腾讯云自媒体同步曝光计划,分享自微信公众号。
原始发表:2023-01-03,如有侵权请联系 cloudcommunity@tencent.com 删除
评论
登录后参与评论
推荐阅读
目录

