基于rpcx框架的服务器监控系统实践
原创本文将深入探讨如何使用Golang的RPCX框架构建一个基于客户端-服务器(CS)模式的微型服务器监控系统。该系统旨在通过微服务的方式,实现数据采集、传输、存储、分析和展示等功能,以便对服务器进行实时监控。我们将详细介绍如何使用RPCX框架进行服务治理,包括服务的注册与发现、负载均衡、容错处理等方面。

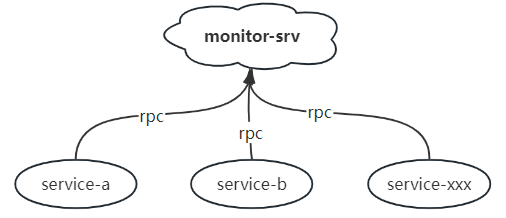
以上为该简易监控系统的基本架构图,由monitor-srv提供RPC接口,再由各个服务定时调接口进行监控数据的传输,存储后由Grafana进行展示。
monitor-srv(S端)
package main

import (
   "context"
   "database/sql"
   "fmt"
   "time"

   _ "github.com/go-sql-driver/mysql"
   "github.com/smallnest/rpcx/server"
)

/*
CREATE TABLE `monitor_tb` (
  `t` datetime DEFAULT NULL,
  `node` varchar(50) DEFAULT NULL,
  `service_name` varchar(50) DEFAULT NULL,
  `cpu_rate` float(100,2) DEFAULT NULL,
  `memory_used` float(100,2) DEFAULT NULL
) ENGINE=InnoDB DEFAULT CHARSET=utf8mb4;
*/

type MonitorRequest struct {
   Node        string
   ServiceName string
   ReportTime  int64
   CpuRate     float64
   MemoryUsed  uint64
}

type MonitorResponse struct {
   Code int
}

type MonitorServer struct {
   db *sql.DB
}

func (s *MonitorServer) CollectData(ctx context.Context, req *MonitorRequest, resp *MonitorResponse) error {
   // 将时间戳转换为时间对象
   t := time.Unix(req.ReportTime, 0).Format("2006-01-02 15:04:05")

   // 格式化日期为所需的格式
   sqlStr := fmt.Sprintf("INSERT INTO monitor_tb(t,node,service_name,cpu_rate,memory_used) VALUES('%v','%s','%s',%f,%v)",
      t, req.Node, req.ServiceName, req.CpuRate, req.MemoryUsed)

   if _, err := s.db.Exec(sqlStr); err != nil {
      return err
   }

   return nil
}

func main() {
   db, err := sql.Open("mysql", "root:12345@tcp(127.0.0.1:3306)/grafana_db")
   if err != nil {
      panic(err)
   }
   db.SetConnMaxLifetime(time.Minute * 3)
   db.SetMaxOpenConns(10)
   db.SetMaxIdleConns(10)

   s := server.NewServer()
   _ = s.Register(&MonitorServer{db: db}, "")
   _ = s.Serve("tcp", "127.0.0.1:9000")
}
service(C端)
package main

import (
   "context"
   "fmt"
   "log"
   "time"

   "github.com/shirou/gopsutil/cpu"
   "github.com/shirou/gopsutil/mem"
   "github.com/smallnest/rpcx/client"
)

type MonitorRequest struct {
   Node        string
   ServiceName string
   ReportTime  int64
   CpuRate     float64
   MemoryUsed  uint64
}

func main() {
   d, _ := client.NewPeer2PeerDiscovery("tcp@127.0.0.1:9000", "")
   cli := client.NewXClient("MonitorServer", client.Failtry, client.RandomSelect, d, client.DefaultOption)

   defer func() {
      _ = cli.Close()
   }()

   for {
      // 获取CPU使用率
      cpuPercent, _ := cpu.Percent(time.Second, false)
      v, _ := mem.VirtualMemory()

      fmt.Printf("CPU使用率:%v , 已使用内存:%vM\n", cpuPercent, v.Used/1e6)

      args := &MonitorRequest{
         Node:        "192.168.1.2",
         ServiceName: "service-a",
         ReportTime:  time.Now().Unix(),
         CpuRate:     cpuPercent[0],
         MemoryUsed:  v.Used,
      }
      reply := ""

      err := cli.Call(context.Background(), "CollectData", args, reply)
      if err != nil {
         log.Printf("failed to call: %v", err)
      }
      time.Sleep(5 * time.Second)
   }
}
配置Grafana
Grafana是一款开源的、炫酷的可视化监控、分析利器。它主要用于大规模指标数据的可视化展现,可以与各种数据源结合使用,如Graphite、InfluxDB、OpenTSDB、Prometheus、Elasticsearch和Cloudwatch等。Grafana拥有快速灵活的客户端图表,支持多种不同的时间序列数据存储后端,且每个数据源都有一个特定查询编辑器。
Grafana的功能特点包括:
- 丰富的可视化组件:Grafana提供了多种可视化组件,如折线图、柱状图、热力图、地理图等,可以满足各种数据可视化需求。
- 强大的数据源支持:Grafana支持多种数据源,包括常见的数据库、缓存、消息队列等,也支持一些特定的数据源,如Prometheus、Elasticsearch等。
- 灵活的配置和定制:Grafana的配置非常灵活,可以根据自己的需求进行定制,包括仪表盘的布局、数据源的配置、图表的样式等。
- 实时数据可视化:Grafana支持实时数据可视化,可以将最新的数据实时展示在图表上,方便用户及时了解系统的运行状态。
- 数据分析和预警:Grafana不仅可以将数据可视化,还可以进行数据分析和预警。用户可以通过Grafana进行数据的聚合、过滤、排序等操作,也可以设置预警规则,及时发现异常情况。
总之,Grafana是一款强大的数据可视化工具,可以满足各种不同的需求,无论是日常的监控、还是复杂的数据分析,都可以通过Grafana轻松实现。
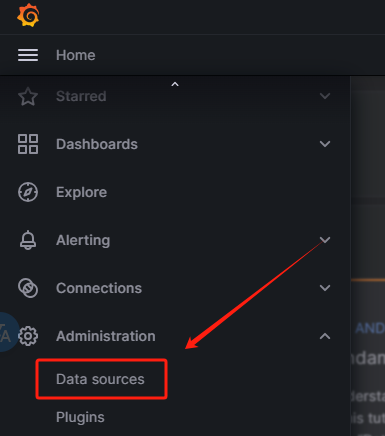
配置数据源

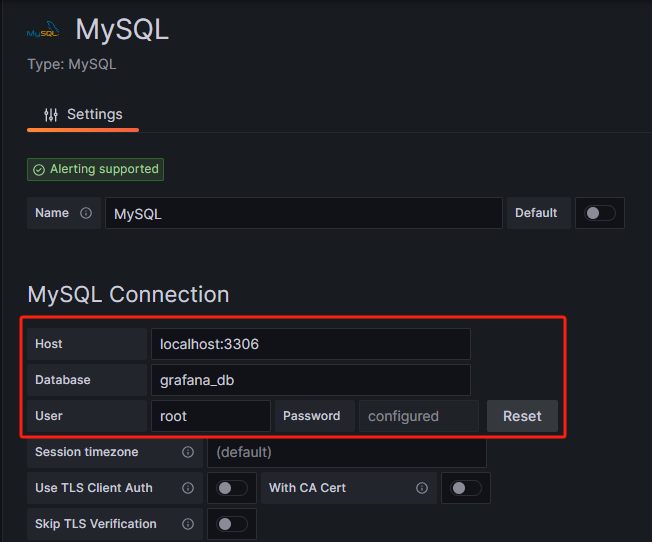
选择MySQL数据库

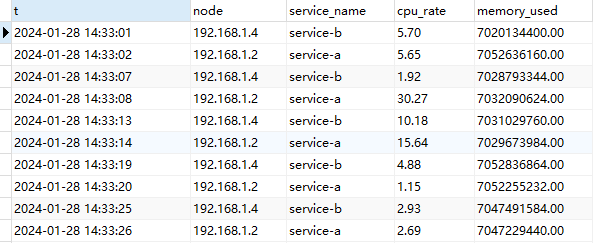
查看已有数据

新建视图进行展示

Grafana Dashboard:
{
  "__inputs": [
    {
      "name": "DS_MYSQL",
      "label": "MySQL",
      "description": "",
      "type": "datasource",
      "pluginId": "mysql",
      "pluginName": "MySQL"
    }
  ],
  "__elements": {},
  "__requires": [
    {
      "type": "grafana",
      "id": "grafana",
      "name": "Grafana",
      "version": "9.5.2"
    },
    {
      "type": "datasource",
      "id": "mysql",
      "name": "MySQL",
      "version": "1.0.0"
    },
    {
      "type": "panel",
      "id": "timeseries",
      "name": "Time series",
      "version": ""
    }
  ],
  "annotations": {
    "list": [
      {
        "builtIn": 1,
        "datasource": {
          "type": "grafana",
          "uid": "-- Grafana --"
        },
        "enable": true,
        "hide": true,
        "iconColor": "rgba(0, 211, 255, 1)",
        "name": "Annotations & Alerts",
        "type": "dashboard"
      }
    ]
  },
  "editable": true,
  "fiscalYearStartMonth": 0,
  "graphTooltip": 0,
  "id": null,
  "links": [],
  "liveNow": false,
  "panels": [
    {
      "datasource": {
        "type": "mysql",
        "uid": "${DS_MYSQL}"
      },
      "fieldConfig": {
        "defaults": {
          "color": {
            "mode": "palette-classic"
          },
          "custom": {
            "axisCenteredZero": false,
            "axisColorMode": "text",
            "axisLabel": "",
            "axisPlacement": "auto",
            "barAlignment": 0,
            "drawStyle": "line",
            "fillOpacity": 0,
            "gradientMode": "none",
            "hideFrom": {
              "legend": false,
              "tooltip": false,
              "viz": false
            },
            "lineInterpolation": "linear",
            "lineWidth": 1,
            "pointSize": 5,
            "scaleDistribution": {
              "type": "linear"
            },
            "showPoints": "auto",
            "spanNulls": false,
            "stacking": {
              "group": "A",
              "mode": "none"
            },
            "thresholdsStyle": {
              "mode": "off"
            }
          },
          "mappings": [],
          "thresholds": {
            "mode": "absolute",
            "steps": [
              {
                "color": "green",
                "value": null
              },
              {
                "color": "red",
                "value": 80
              }
            ]
          }
        },
        "overrides": []
      },
      "gridPos": {
        "h": 8,
        "w": 12,
        "x": 0,
        "y": 0
      },
      "id": 1,
      "options": {
        "legend": {
          "calcs": [],
          "displayMode": "list",
          "placement": "bottom",
          "showLegend": true
        },
        "tooltip": {
          "mode": "single",
          "sort": "desc"
        }
      },
      "pluginVersion": "9.5.2",
      "targets": [
        {
          "datasource": {
            "type": "mysql",
            "uid": "${DS_MYSQL}"
          },
          "editorMode": "code",
          "format": "time_series",
          "rawQuery": true,
          "rawSql": "SELECT unix_timestamp(t) as \"time\",cpu_rate as \"service-a\" from grafana_db.monitor_tb where service_name='service-a'",
          "refId": "A",
          "sql": {
            "columns": [
              {
                "parameters": [],
                "type": "function"
              }
            ],
            "groupBy": [
              {
                "property": {
                  "type": "string"
                },
                "type": "groupBy"
              }
            ],
            "limit": 50
          }
        },
        {
          "datasource": {
            "type": "mysql",
            "uid": "${DS_MYSQL}"
          },
          "editorMode": "code",
          "format": "table",
          "hide": false,
          "rawQuery": true,
          "rawSql": "SELECT unix_timestamp(t) as \"time\",cpu_rate as \"service-b\" from grafana_db.monitor_tb where service_name='service-b'",
          "refId": "B",
          "sql": {
            "columns": [
              {
                "parameters": [],
                "type": "function"
              }
            ],
            "groupBy": [
              {
                "property": {
                  "type": "string"
                },
                "type": "groupBy"
              }
            ],
            "limit": 50
          }
        }
      ],
      "title": "CPU使用率",
      "type": "timeseries"
    },
    {
      "datasource": {
        "type": "mysql",
        "uid": "${DS_MYSQL}"
      },
      "fieldConfig": {
        "defaults": {
          "color": {
            "mode": "palette-classic"
          },
          "custom": {
            "axisCenteredZero": false,
            "axisColorMode": "text",
            "axisLabel": "",
            "axisPlacement": "auto",
            "barAlignment": 0,
            "drawStyle": "line",
            "fillOpacity": 0,
            "gradientMode": "none",
            "hideFrom": {
              "legend": false,
              "tooltip": false,
              "viz": false
            },
            "lineInterpolation": "linear",
            "lineWidth": 1,
            "pointSize": 5,
            "scaleDistribution": {
              "type": "linear"
            },
            "showPoints": "auto",
            "spanNulls": false,
            "stacking": {
              "group": "A",
              "mode": "none"
            },
            "thresholdsStyle": {
              "mode": "off"
            }
          },
          "mappings": [],
          "thresholds": {
            "mode": "absolute",
            "steps": [
              {
                "color": "green",
                "value": null
              },
              {
                "color": "red",
                "value": 80
              }
            ]
          }
        },
        "overrides": []
      },
      "gridPos": {
        "h": 8,
        "w": 12,
        "x": 12,
        "y": 0
      },
      "id": 2,
      "options": {
        "legend": {
          "calcs": [],
          "displayMode": "list",
          "placement": "bottom",
          "showLegend": true
        },
        "tooltip": {
          "mode": "single",
          "sort": "desc"
        }
      },
      "pluginVersion": "9.5.2",
      "targets": [
        {
          "datasource": {
            "type": "mysql",
            "uid": "${DS_MYSQL}"
          },
          "editorMode": "code",
          "format": "time_series",
          "rawQuery": true,
          "rawSql": "SELECT unix_timestamp(t) as \"time\",memory_used/(1000*1000*1000) as \"service-a\" from grafana_db.monitor_tb where service_name='service-a'",
          "refId": "A",
          "sql": {
            "columns": [
              {
                "parameters": [],
                "type": "function"
              }
            ],
            "groupBy": [
              {
                "property": {
                  "type": "string"
                },
                "type": "groupBy"
              }
            ],
            "limit": 50
          }
        },
        {
          "datasource": {
            "type": "mysql",
            "uid": "${DS_MYSQL}"
          },
          "editorMode": "code",
          "format": "table",
          "hide": false,
          "rawQuery": true,
          "rawSql": "SELECT unix_timestamp(t) as \"time\",memory_used/(1000*1000*1000) as \"service-b\"  from grafana_db.monitor_tb where service_name='service-b'",
          "refId": "B",
          "sql": {
            "columns": [
              {
                "parameters": [],
                "type": "function"
              }
            ],
            "groupBy": [
              {
                "property": {
                  "type": "string"
                },
                "type": "groupBy"
              }
            ],
            "limit": 50
          }
        }
      ],
      "title": "内存使用情况",
      "type": "timeseries"
    }
  ],
  "refresh": "5s",
  "schemaVersion": 38,
  "style": "dark",
  "tags": [],
  "templating": {
    "list": []
  },
  "time": {
    "from": "now-5m",
    "to": "now"
  },
  "timepicker": {},
  "timezone": "",
  "title": "rpcx-service",
  "uid": "e240a1f4-d034-4766-b771-1c15cdc78534",
  "version": 2,
  "weekStart": ""
}
原创声明:本文系作者授权腾讯云开发者社区发表,未经许可,不得转载。
如有侵权,请联系 cloudcommunity@tencent.com 删除。
原创声明:本文系作者授权腾讯云开发者社区发表,未经许可,不得转载。
如有侵权,请联系 cloudcommunity@tencent.com 删除。
评论
登录后参与评论
推荐阅读

