Google earth engine(GEE)——根据点绘制折线图
Google earth engine(GEE)——根据点绘制折线图

此星光明
发布于 2024-02-01 20:01:11
发布于 2024-02-01 20:01:11
因为这次要用到点的数据,所以首先看要用到的工具:

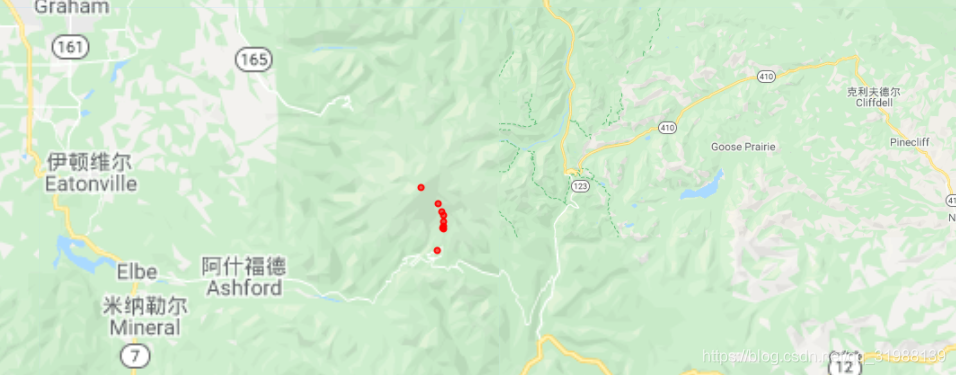
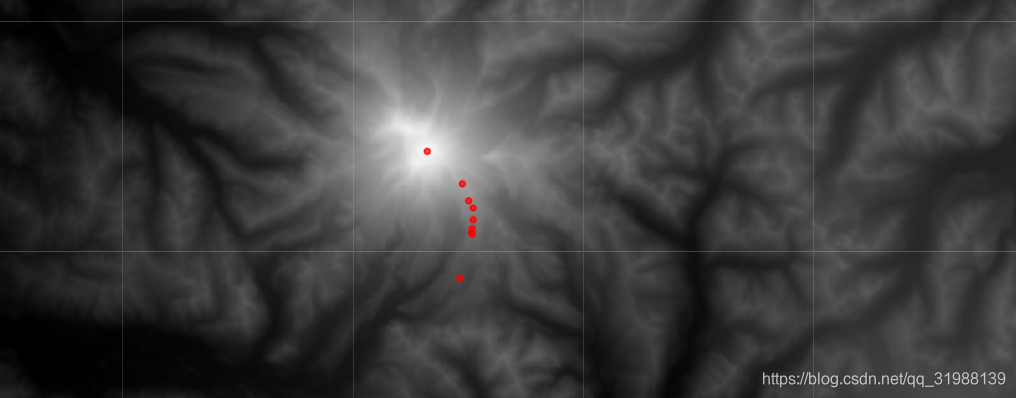
一座山从底下到山顶的一个爬坡变化情况


ui.Chart.image.byRegion(image, regions, reducer, scale, xProperty)
Generates a Chart from an image. Extracts and plots band values in one or more regions in the image, with each band in a separate series.
- X-axis = Region labeled by xProperty (default: 'system:index')
- Y-axis = Reducer output.
- Series = Band name.//这里明确给出了用byRegion就是返回一个序列
Returns a chart.
Arguments:
image (Image):
Image to extract band values from.
regions (Feature|FeatureCollection|Geometry|List<Feature>|List<Geometry>, optional):
Regions to reduce. Defaults to the image's footprint.
reducer (Reducer, optional):
Reducer that generates the value(s) for the y-axis. Must return a single value per band. Defaults to ee.Reducer.mean().
scale (Number, optional):
Scale to use with the reducer in meters.
xProperty (String, optional):
Property to be used as the label for each Region on the x-axis. Defaults to 'system:index'.
Returns: ui.Chart
var elevation = ee.Image('CGIAR/SRTM90_V4');
//这个就是你要测量的点的位置信息并且可以命名名字
var waypoints = [
  ee.Feature(
      ee.Geometry.Point([-121.7353, 46.78622]),
      {'name': 'Paradise Ranger Station'}),
  ee.Feature(
      ee.Geometry.Point([-121.72529, 46.8093]), {'name': 'Pebble Creek'}),
  ee.Feature(
      ee.Geometry.Point([-121.72585, 46.8102899]),
      {'name': 'Start of Glacier'}),
  ee.Feature(
      ee.Geometry.Point([-121.7252699, 46.81202]), {'name': 'Glacier Point 1'}),
  ee.Feature(
      ee.Geometry.Point([-121.72453, 46.81661]), {'name': 'Glacier Point 2'}),
  ee.Feature(
      ee.Geometry.Point([-121.72508, 46.82262]), {'name': 'Little Africa'}),
  ee.Feature(
      ee.Geometry.Point([-121.7278699, 46.82648]), {'name': 'Moon Rocks'}),
  ee.Feature(ee.Geometry.Point([-121.73281, 46.8354]), {'name': 'Camp Muir'}),
  ee.Feature(ee.Geometry.Point([-121.75976, 46.85257]), {'name': 'Summit'})
];

//把这些点的集合弄成一个矢量集合,就是点要素
var rainierWaypoints = ee.FeatureCollection(waypoints);
//绘图用通过地图元素的形式进行绘制
var chart = ui.Chart.image.byRegion({
  image: elevation,
  regions: rainierWaypoints,
//设置你要统计分辨率,越小越精确
  scale: 200,
  xProperty: 'name'
});
chart.setOptions({
  title: 'Mt. Rainier Summit Trail Elevation',
  width:1000,
  height:500,
  vAxis: {
    title: 'Elevation (meters)'
  },
//图例的设置
  legend: 'none',
  lineWidth: 1,
  pointSize: 4
});

print(chart);

Map.addLayer(elevation, {min: 500, max: 4500});
Map.addLayer(rainierWaypoints, {color: 'FF0000'});
Map.setCenter(-121.75976, 46.85257, 11);
这是修改参数后的图形,设置了图形的长宽看起来更加合理

本文参与 腾讯云自媒体同步曝光计划,分享自作者个人站点/博客。
原始发表:2024-02-01,如有侵权请联系 cloudcommunity@tencent.com 删除
评论
登录后参与评论
推荐阅读
目录

