跟着Nature Genetics学作图:R语言ggplot2画图展示基因树的拓扑结构冲突
跟着Nature Genetics学作图:R语言ggplot2画图展示基因树的拓扑结构冲突
用户7010445
发布于 2024-04-15 18:14:03
发布于 2024-04-15 18:14:03
文章被收录于专栏:小明的数据分析笔记本
论文
Genome assemblies of 11 bamboo species highlight diversification induced by dynamic subgenome dominance
https://doi.org/10.1038/s41588-024-01683-0
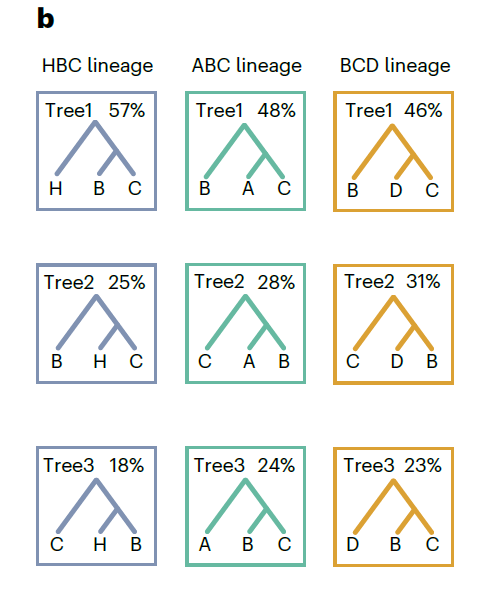
今天的推文我们来复现一下论文中的 Fig2b

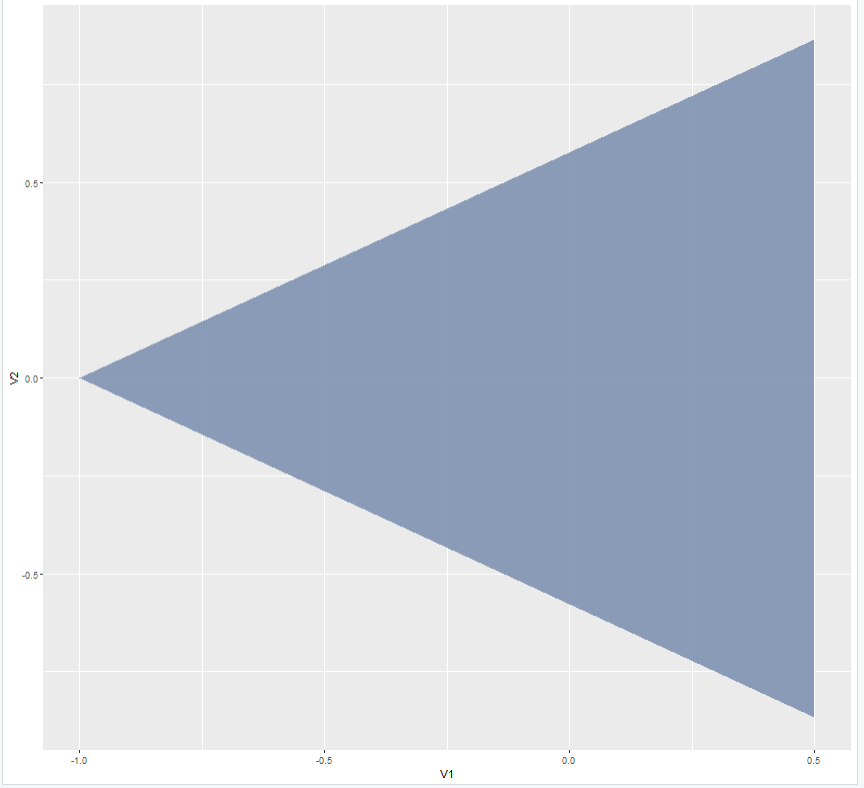
这里我的思路是画三条线段,用等腰三角形的三个顶点坐标来构造线段的起始和终止坐标,等腰三角形的三个顶点可以用函数polygon_regular()来获取,这个函数是用来构造多边形的顶点的,来自于gridExtra包。比如我要画一个等腰三角形
polygon_regular(n=3,phase = pi/2) %>%
  as.data.frame() %>%
  ggplot(aes(x=V1,y=V2))+
  geom_polygon(fill="#8092b2",alpha=0.9)

加载需要用到的R包
library(gridExtra)
library(tidyverse)
library(ggplot2)
library(patchwork)
构造一个函数用来单个图
myfun<-function(linecolor,linewid,
                label.01,label.01.size,
                label.02,label.02.size,
                title.text,
                title.size){
  polygon_regular(n=3) %>%
    as.data.frame() %>%
    head(n=3) -> dat
  dat[3,] %>%
    bind_cols(dat[1,] %>%
                rename("V3"="V1",
                       "V4"="V2")) -> dat01

  dat[1,] %>%
    bind_cols(dat[2,] %>%
                rename("V3"="V1",
                       "V4"="V2")) -> dat02

  (dat[3,]/2 + dat[1,]/2) %>%
    bind_cols((dat[3,]/2 + dat[2,]/2) %>%
                rename("V3"="V1",
                       "V4"="V2")) -> dat03
  dat01 %>%
    bind_rows(dat02) %>%
    bind_rows(dat03) %>%
    ggplot()+
    geom_segment(aes(x=V1,xend=V3,y=V2,yend=V4),
                 linewidth=linewid,
                 color=linecolor,
                 lineend = "round",
                 linejoin = "round")+
    theme_bw()+
    theme(panel.grid = element_blank(),
          axis.title = element_blank(),
          axis.text = element_blank(),
          axis.ticks = element_blank(),
          panel.border = element_rect(color=linecolor,linewidth=linewid))+
    coord_equal()+
    geom_text(data=dat[2,] %>%
                bind_rows(dat[3,]/2 + dat[2,]/2) %>%
                bind_rows(dat[3,]) %>%
                mutate(label=label.01),
              aes(x=V1,y=V2,label=label),
              vjust=1.5,size=label.01.size)+
    geom_text(data=data.frame(V1=c(dat[2,1],dat[3,1]),
                              V2=1,
                              label=label.02),
              aes(x=V1,y=V2,label=label),
              size=label.02.size,vjust=1,hjust=c(0,1))+
    labs(title=title.text)+
    theme(plot.title = element_text(hjust=0.5,size=title.size))+
    xlim(-1,1)+
    ylim(-1,1.2)

}
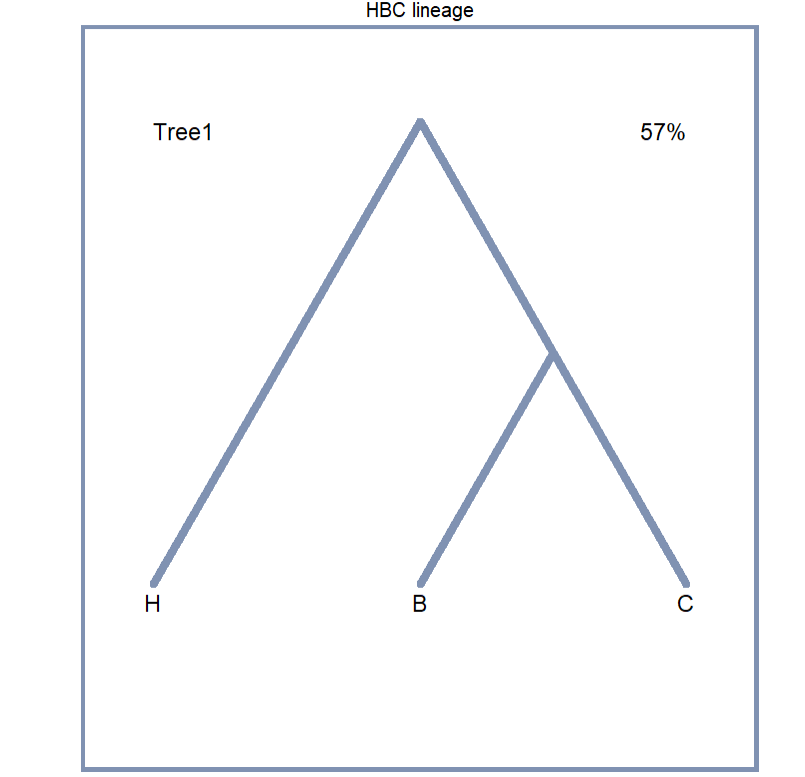
先画一个
myfun(linecolor = "#8092b2",
      linewid = 3,
      label.01 = c("H","B","C"),
      label.01.size = 8,
      label.02 = c("Tree1","57%"),
      label.02.size = 8,
      title.text = "HBC lineage",
      title.size = 20) -> p1
p1

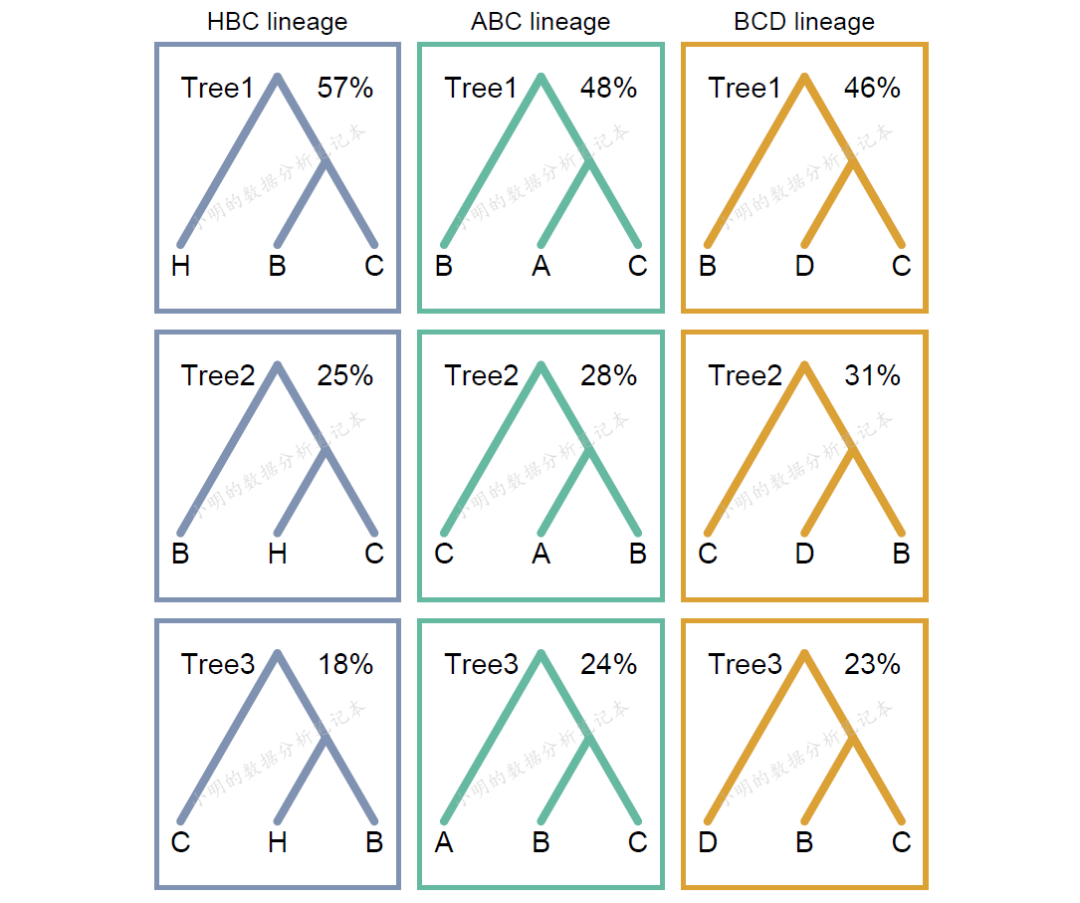
画9个然后拼图
myfun(linecolor = "#8092b2",
      linewid = 3,
      label.01 = c("H","B","C"),
      label.01.size = 8,
      label.02 = c("Tree1","57%"),
      label.02.size = 8,
      title.text = "HBC lineage",
      title.size = 20) -> p1

myfun(linecolor = "#66b9a1",
      linewid = 3,
      label.01 = c("B","A","C"),
      label.01.size = 8,
      label.02 = c("Tree1","48%"),
      label.02.size = 8,
      title.text = "ABC lineage",
      title.size = 20) -> p2

myfun(linecolor = "#dba134",
      linewid = 3,
      label.01 = c("B","D","C"),
      label.01.size = 8,
      label.02 = c("Tree1","46%"),
      label.02.size = 8,
      title.text = "BCD lineage",
      title.size = 20) -> p3

myfun(linecolor = "#8092b2",
      linewid = 3,
      label.01 = c("B","H","C"),
      label.01.size = 8,
      label.02 = c("Tree2","25%"),
      label.02.size = 8,
      title.text = NULL,
      title.size = 20) -> p4

myfun(linecolor = "#8092b2",
      linewid = 3,
      label.01 = c("C","H","B"),
      label.01.size = 8,
      label.02 = c("Tree3","18%"),
      label.02.size = 8,
      title.text = NULL,
      title.size = 20) -> p7


myfun(linecolor = "#66b9a1",
      linewid = 3,
      label.01 = c("C","A","B"),
      label.01.size = 8,
      label.02 = c("Tree2","28%"),
      label.02.size = 8,
      title.text = NULL,
      title.size = 20) -> p5


myfun(linecolor = "#66b9a1",
      linewid = 3,
      label.01 = c("A","B","C"),
      label.01.size = 8,
      label.02 = c("Tree3","24%"),
      label.02.size = 8,
      title.text = NULL,
      title.size = 20) -> p8


myfun(linecolor = "#dba134",
      linewid = 3,
      label.01 = c("C","D","B"),
      label.01.size = 8,
      label.02 = c("Tree2","31%"),
      label.02.size = 8,
      title.text = NULL,
      title.size = 20) -> p6


myfun(linecolor = "#dba134",
      linewid = 3,
      label.01 = c("D","B","C"),
      label.01.size = 8,
      label.02 = c("Tree3","23%"),
      label.02.size = 8,
      title.text = NULL,
      title.size = 20) -> p9


wrap_plots(list(p1,p2,p3,p4,p5,
                        p6,p7,p8,p9))

本文参与 腾讯云自媒体同步曝光计划,分享自微信公众号。
原始发表:2024-04-11,如有侵权请联系 cloudcommunity@tencent.com 删除
评论
登录后参与评论
推荐阅读
目录
