[pcl][原创]python-pcl安装配置支持windows和ubuntu完美流程 2021版本

[pcl][原创]python-pcl安装配置支持windows和ubuntu完美流程 2021版本

git clone firc-dataset
发布于 2025-07-18 15:34:59
发布于 2025-07-18 15:34:59
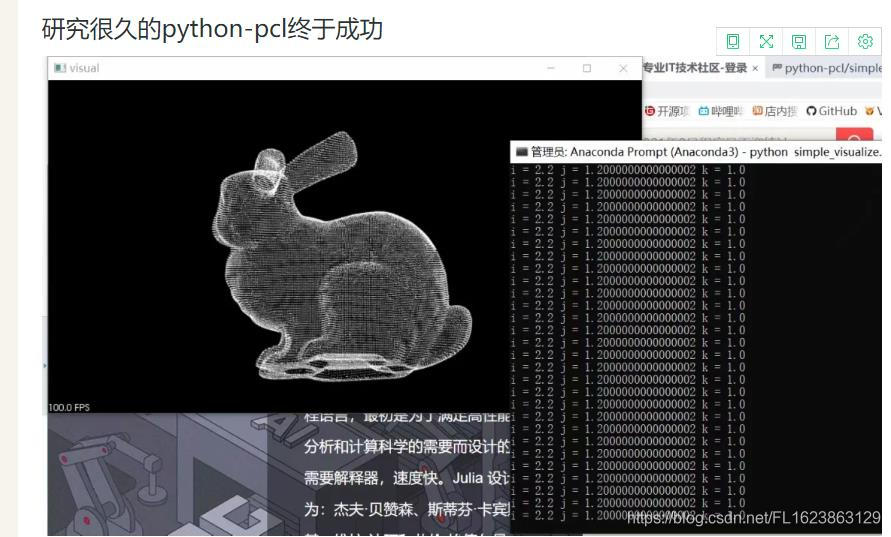
纵观全网pcl python版本配置存在各种各样的问题,基本没有一个文章可以完整搞定。直到今日,断断续续我也耗费数月终于打通整个流程,并且实现了windows和ubuntu2个系统安装和测试,先上一个结果图
其中windows测试成功环境为:
windows 10
VS2019专业版
PCL1.11.1
Anaconda3
python=3.6或者python3.7
安装流程:
第一步:安装VS2019和PCL1.11.1,由于安装过程简单我们省略
第二步:安装Anaconda3,我们仅仅需要anaconda3环境即可
第三步:打开我们的软件(注意必须要以管理员身份运行)
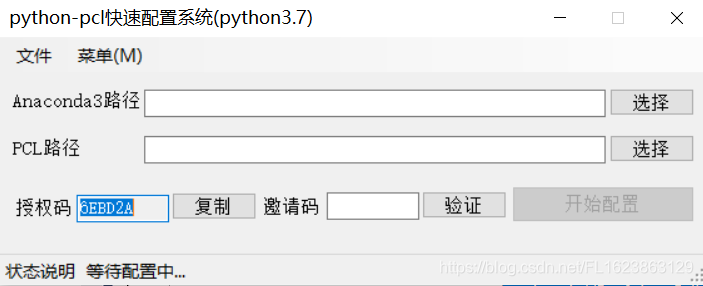
选择anaconda3的安装目录和PCL安装目录,点击开始配置,稍等4分钟左右,即可自动完成所有配置任务。
测试:我们打开anaconda3环境,并切换到pcl虚拟环境
conda activate pcl
然后我们一个读取pcd的代码测试一下,注意此代码是官网提供的代码
# -*- coding: utf-8 -*- # Point cloud library import pcl import pcl.pcl_visualization
# Opencv # import opencv import cv2
def main(): # These are track bar initial settings adjusted to the given pointcloud to make it completely visible. # Need to be adjusted depending on the pointcloud and its xyz limits if used with new pointclouds. # int a = 22; # int b = 12; # int c= 10; a = 22 b = 12 c = 10
# PCL Visualizer to view the pointcloud # pcl::visualization::PCLVisualizer viewer ("Simple visualizing window"); viewer = pcl.pcl_visualization.PCLVisualizering()
# int main (int argc, char** argv) # { # pcl::PointCloud<pcl::PointXYZRGBA>::Ptr cloud (new pcl::PointCloud<pcl::PointXYZRGBA>); # pcl::PointCloud<pcl::PointXYZRGBA>::Ptr cloud_filtered (new pcl::PointCloud<pcl::PointXYZRGBA>); # if (pcl::io::loadPLYFile<pcl::PointXYZRGBA> (argv[1], *cloud) == -1) //* load the ply file from command line # { # PCL_ERROR ("Couldn't load the file\n"); # return (-1); # } cloud = pcl.load("rabbit.pcd") #cloud = pcl.load("Tile_173078_LD_010_017_L22.obj")
# pcl::copyPointCloud( *cloud,*cloud_filtered); # cloud_filtered = cloud.copyPointCloud() cloud_filtered = cloud
# float i # float j # float k
# cv::namedWindow("picture"); # // Creating trackbars uisng opencv to control the pcl filter limits # cvCreateTrackbar("X_limit", "picture", &a, 30, NULL); # cvCreateTrackbar("Y_limit", "picture", &b, 30, NULL); # cvCreateTrackbar("Z_limit", "picture", &c, 30, NULL); # cv2.CreateTrackbar("X_limit", "picture", a, 30) # cv2.CreateTrackbar("Y_limit", "picture", b, 30) # cv2.CreateTrackbar("Z_limit", "picture", c, 30)
# // Starting the while loop where we continually filter with limits using trackbars and display pointcloud # char last_c = 0; last_c = 0
# while(true && (last_c != 27)) while last_c != 27:
# pcl::copyPointCloud(*cloud_filtered, *cloud); # // i,j,k Need to be adjusted depending on the pointcloud and its xyz limits if used with new pointclouds. i = 0.1 * a j = 0.1 * b k = 0.1 * c
# Printing to ensure that the passthrough filter values are changing if we move trackbars. # cout << "i = " << i << " j = " << j << " k = " << k << endl; print("i = " + str(i) + " j = " + str(j) + " k = " + str(k))
# Applying passthrough filters with XYZ limits # pcl::PassThrough<pcl::PointXYZRGBA> pass; # pass.setInputCloud (cloud); # pass.setFilterFieldName ("y"); # // pass.setFilterLimits (-0.1, 0.1); # pass.setFilterLimits (-k, k); # pass.filter (*cloud); pass_th = cloud.make_passthrough_filter() pass_th.set_filter_field_name("y") pass_th.set_filter_limits(-k, k) cloud = pass_th.filter()
# pass.setInputCloud (cloud); # pass.setFilterFieldName ("x"); # // pass.setFilterLimits (-0.1, 0.1); # pass.setFilterLimits (-j, j); # pass.filter (*cloud); # pass_th.setInputCloud(cloud) pass_th.set_filter_field_name("x") pass_th.set_filter_limits(-j, j) cloud = pass_th.filter()
# pass.setInputCloud (cloud); # pass.setFilterFieldName ("z"); # // pass.setFilterLimits (-10, 10); # pass.setFilterLimits (-i, i); # pass.filter (*cloud); # pass_th.setInputCloud(cloud) pass_th.set_filter_field_name("z") pass_th.set_filter_limits(-10, 10) cloud = pass_th.filter()
# // Visualizing pointcloud # viewer.addPointCloud (cloud, "scene_cloud"); # viewer.spinOnce(); # viewer.removePointCloud("scene_cloud"); viewer.AddPointCloud(cloud, b'scene_cloud', 0) viewer.SpinOnce() # viewer.Spin() viewer.RemovePointCloud(b'scene_cloud', 0)
if __name__ == "__main__": # import cProfile # cProfile.run('main()', sort='time') main() 以上代码我们保存test.py
执行python test.py即可正常显示结果,即就是上面的图片。
此外我们尝试了ubuntu18.04安装python-pcl和上面达到一样的效果。
本文参与 腾讯云自媒体同步曝光计划,分享自作者个人站点/博客。
原始发表:2025-07-17,如有侵权请联系 cloudcommunity@tencent.com 删除
评论
登录后参与评论
推荐阅读
腾讯云开发者

Copyright © 2013 - 2026 Tencent Cloud. All Rights Reserved. 腾讯云 版权所有
深圳市腾讯计算机系统有限公司 ICP备案/许可证号:粤B2-20090059 ![]() 粤公网安备44030502008569号
粤公网安备44030502008569号
腾讯云计算(北京)有限责任公司 京ICP证150476号 | 京ICP备11018762号