H5 面板脚手架
我们可以使用以下命令初始化一个 H5 面板项目:
npx --package caz@1.0.0 caz tencentyun/iotexplorer-h5-panel-template my-h5-panel
如果您用过 vue-cli 等工具来初始化项目,那么这个命令和它很像。这个命令会拉取 iotexplorer-h5-panel-template 作为模板, 然后会进行一些特性的选择,例如版本号,选择使用的框架等,如下图所示,最后会初始化一个 H5 面板项目。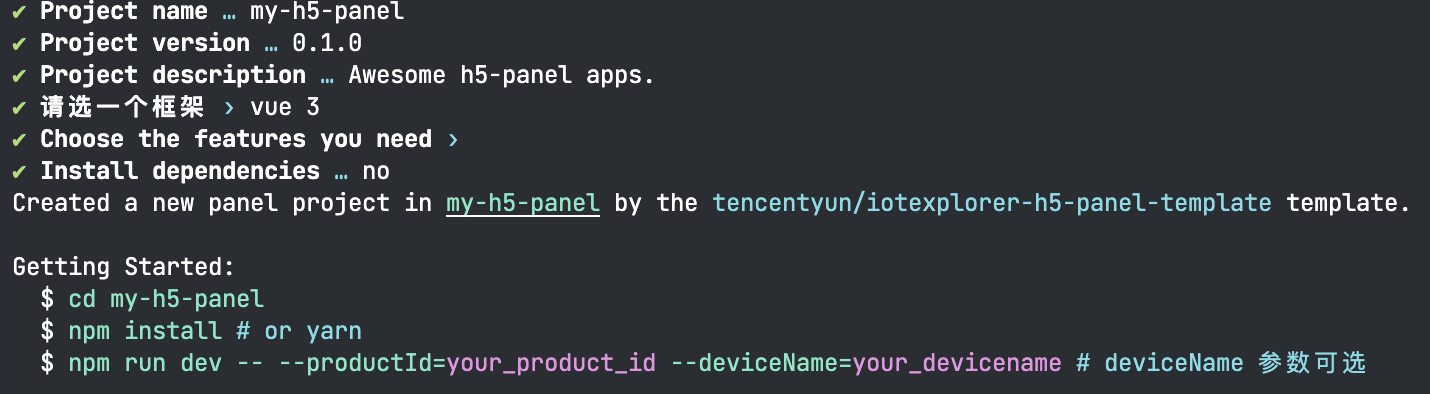
创建项目完成后,开发者可以参考项目目录下的 README.md。在安装完依赖之后,通过以下命令将将项目运行起来:
npm run dev -- --productId=your_productId
其中
your_productId为 H5 面板对应产品的 productId。H5 面板 Demo
物联网开发平台提供一个 H5 面板 Demo 供开发者参考,H5 面板 Demo 以开源的方式向开发者开放,便于开发者在开发 H5 面板时进行参考。
启动调试
H5 面板开发调试时,需要执行以下命令。
1. 安装依赖(下载 Demo 后执行一次即可)。
npm install
2. 实时编译 H5 面板(开发过程中需要保持运行)。
npm run dev
该命令执行时,H5 面板的 JS 文件可通过
http://127.0.0.1:9000/index.js 访问,CSS 文件可通过 http://127.0.0.1:9000/index.css 访问。当 H5 面板源代码文件更改后,将自动重新编译 JS 文件和 CSS 文件,刷新 H5 面板页面即可加载到更新后的 JS 文件和 CSS 文件。编译构建
在 H5 面板开发完成后,需要执行以下命令构建 H5 面板的 JS 文件和 CSS 文件。
npm run release
构建完成后,JS 文件和 CSS 文件将会分别输出到
dist/index.js 文件和 dist/index.css 文件。开发者需要在 物联网开发平台控制台 将这些文件上传到产品的交互开发配置项中。上传操作请参见 上传 H5 面板。H5 面板调试
开发模式下,H5 面板框架将分别从以下两个 URL 加载 JS 文件和 CSS 文件。您需要配置代理,使得浏览器或微信开发者工具可通过这两个 URL 加载 H5 面板的 JS 文件和 CSS 文件,从而进行 H5 面板的调试。
JS 文件 URL:
https://developing.script/developing.jsCSS 文件 URL:
https://developing.style/developing.css说明:
开发模式需要用到您的腾讯云登录态,必须使用对该产品有操作权限的腾讯云账号登录,才可以进入相应产品的 H5 面板开发模式。
本地调试
本地调试将会注册一个与您腾讯云账号关联的腾讯连连用户作为调试用户,并创建一个家庭和一个用于调试的设备,让您无需关注创建家庭、设备绑定等逻辑,只需专注于 H5 面板的开发。
访问以下 URL 可进行 H5 面板的本地调试,请将 ABCDEFG 替换为实际的产品 ID。
https://iot.cloud.tencent.com/h5panel/developing?productId=ABCDEFG
下面以微信开发者工具进行 H5 面板 Demo 的本地调试为例,描述具体的操作步骤。
步骤1:下载 Demo 项目
1. 拉取 Demo 项目源代码。
git clone https://github.com/tencentyun/iotexplorer-h5-panel-demo.git
2. 安装依赖。
cd iotexplorer-h5-panel-demonpm install
步骤2:安装并配置 whistle
1. 安装 whistle,执行如下命令:
npm install -g whistle
2. 启动 whistle,执行如下命令:
w2 start
whistle 启动成功后,命令行有如下输出:
[i] whistle@2.5.7 started[i] 1. use your device to visit the following URL list, gets the IP of the URL you can access:http://127.0.0.1:8899/...(其后输出省略)
3. 通过浏览器打开
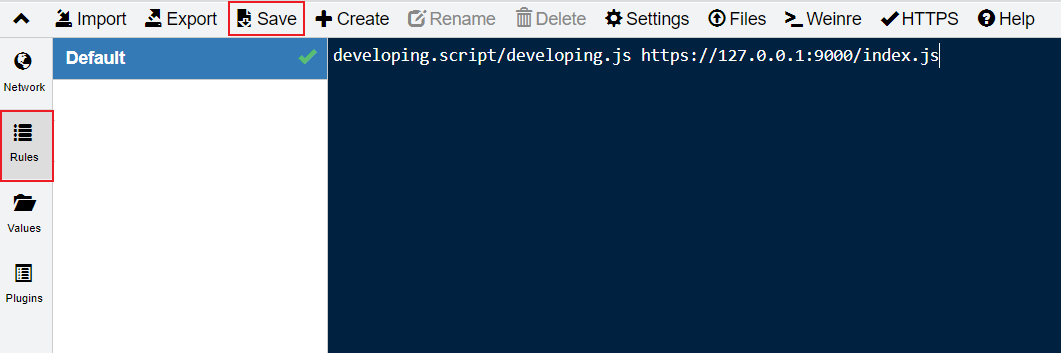
http://127.0.0.1:8899/,进入 whistle 的用户界面。4. 选择 Rules > Default,进入规则配置页面。在输入框中填入以下代理规则:
developing.script/developing.js http://127.0.0.1:9000/index.jsdeveloping.style/developing.css http://127.0.0.1:9000/index.css
单击 Save,保存更改内容。
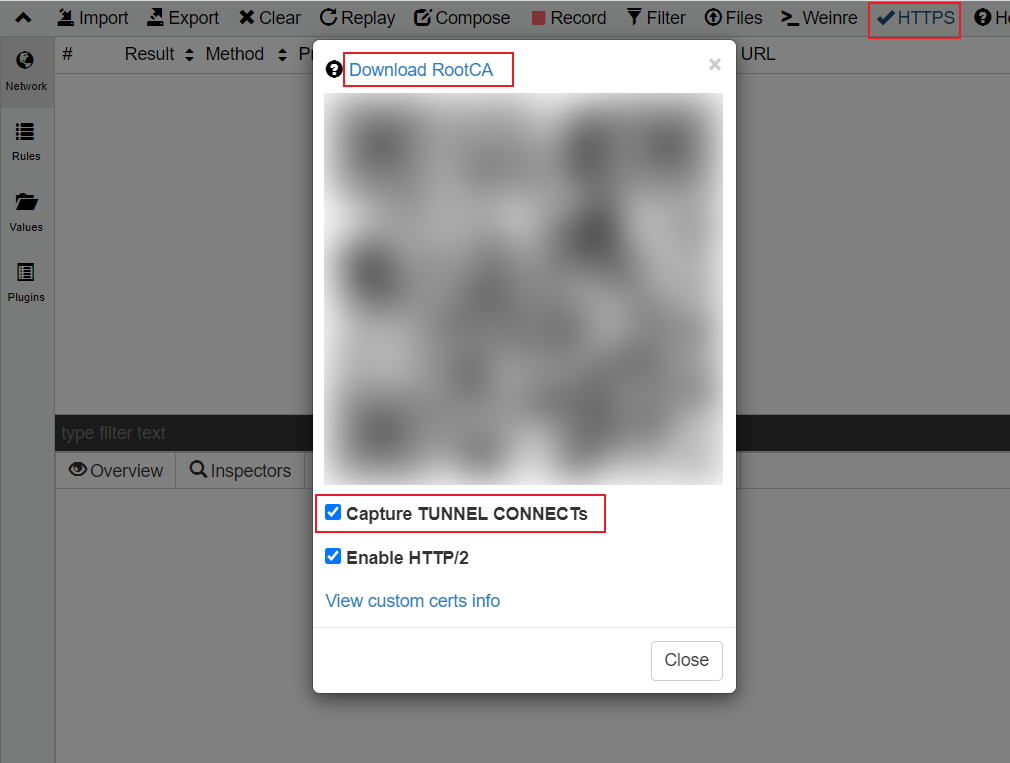
5.
单击菜单栏的 HTTPS
,进入 HTTPS 配置页面。勾选 “Capture TUNNEL CONNECTs”。6. 单击 Download RootCA,下载根证书到本地。
注意:
此步骤无需关注二维码信息,单击 Download RootCA 并勾选 “Capture TUNNEL CONNECTs”即可。
7. 安装根证书,具体步骤请参见 安装根证书。
步骤3:启动 Demo 项目的实时编译
在 Demo 项目目录下,执行如下命令:
npm run dev
编译成功后命令行有如下输出:
i 「wds」: Project is running at https://localhost:9000/...(中间输出省略)i 「wdm」: Compiled successfully.
步骤4:配置微信开发者工具
1. 打开微信开发者工具,选择菜单栏的设置 > 代理 > 代理设置。
2. 选择手动设置代理,代理地址填写 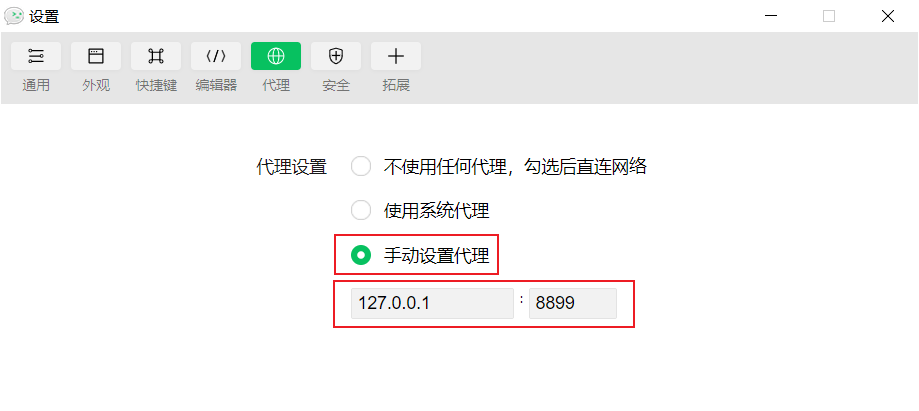
127.0.0.1,端口填写 8899。
步骤5:微信开发者工具打开 H5 面板
1. 打开微信开发者工具,在新建项目页面,单击公众号网页,进入公众号调试页面。
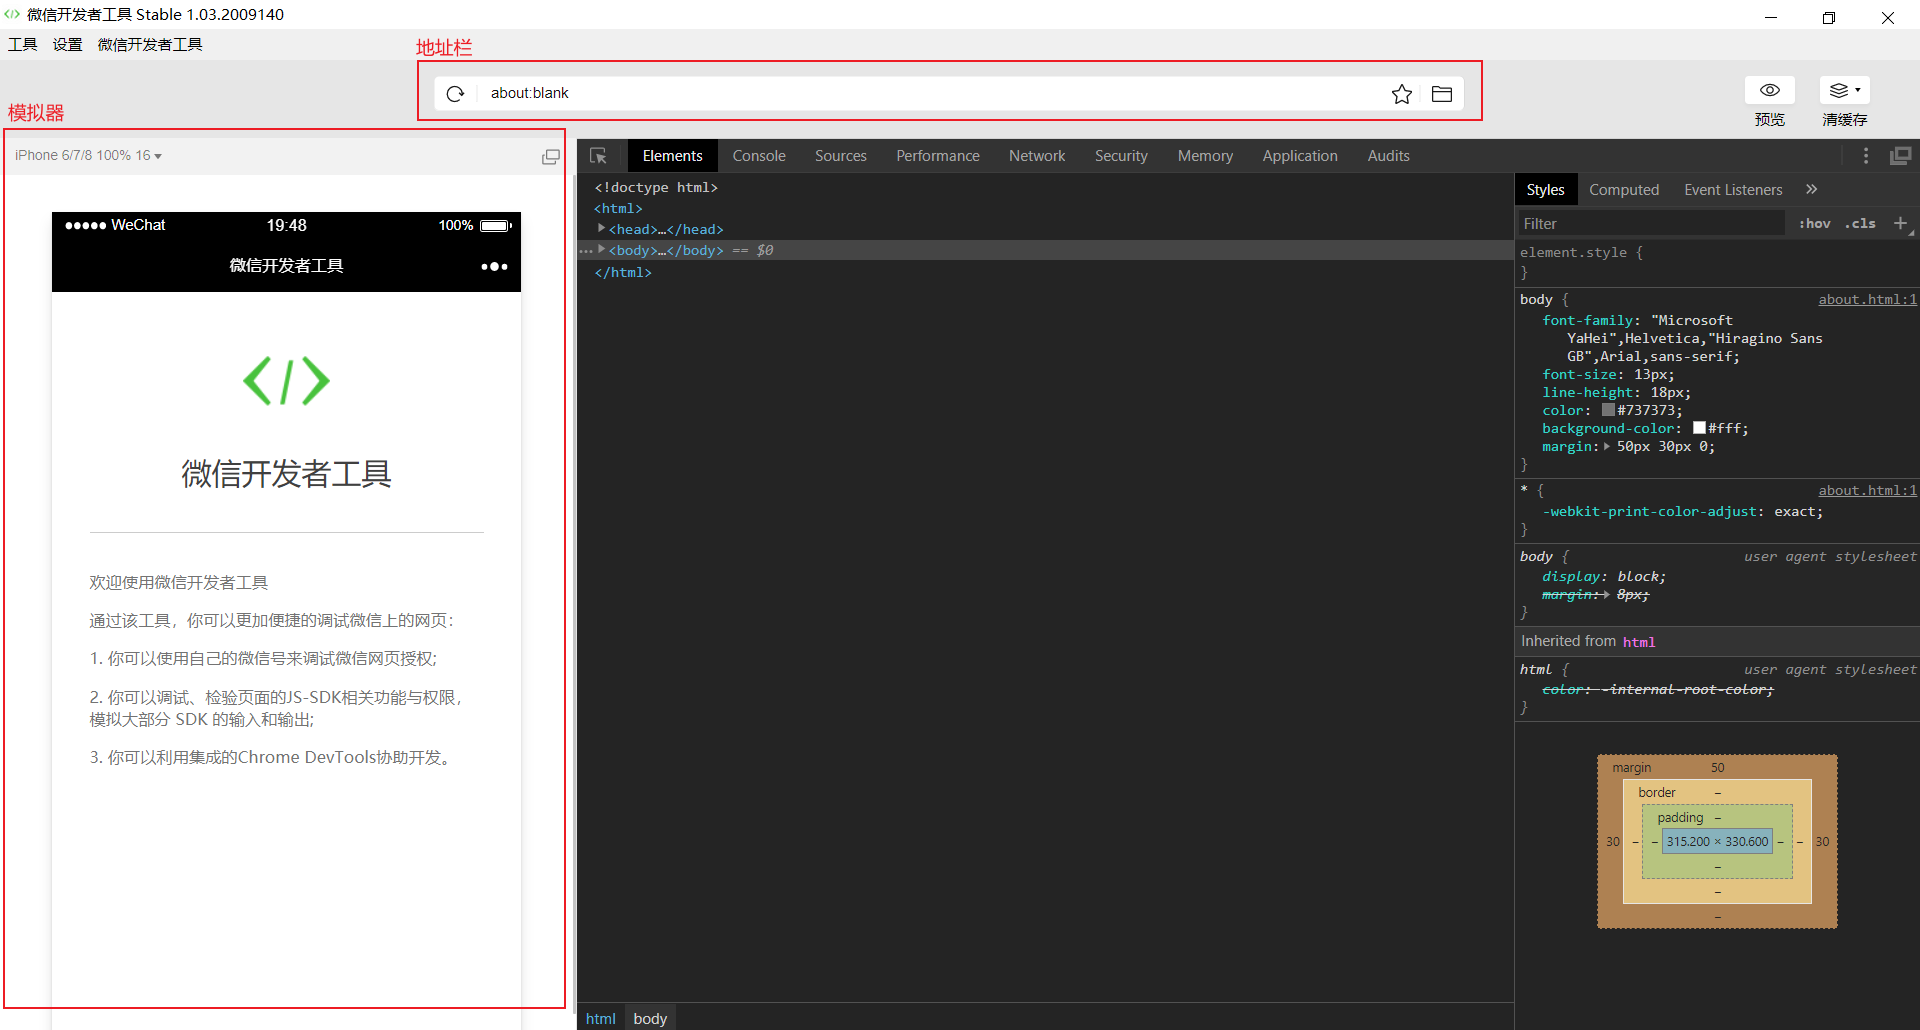
2. 验证 H5 面板 JS 文件是否可以访问。
在地址栏输入
https://developing.script/developing.js,按回车键。若模拟器中可加载并显示 JS 文件代码,则表明 H5 面板 JS 文件可以访问。3. 在地址栏输入 本地调试 URL,按回车键,模拟器将跳转到腾讯云控制台的登录页面。
4. 在模拟器菜单中选择机型 > “Windows (480×800 | Dpr:2)” 。
说明:
若模拟器模拟的是手机环境,则不能正常进行微信或 QQ 登录,此处先更改为 Windows 机型,登录完成后可改回原来的机型设定。
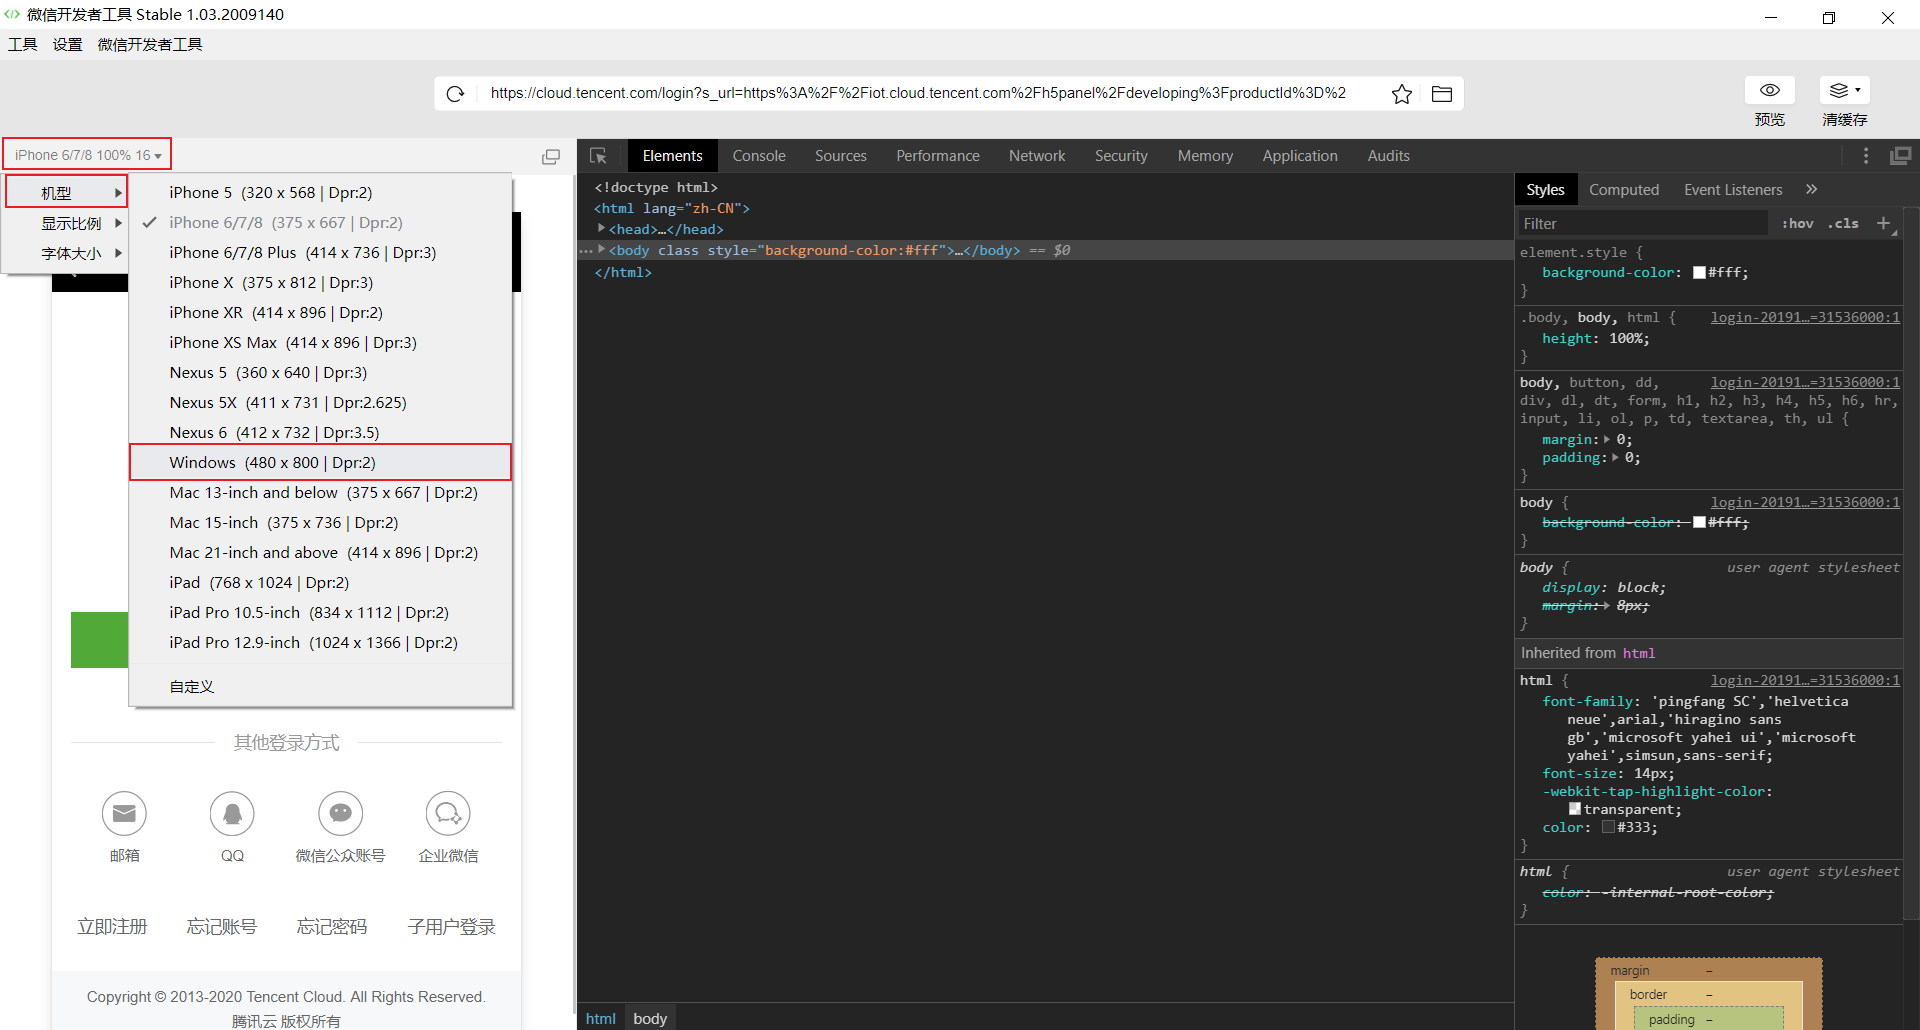
5. 在模拟器页面中登录腾讯云控制台,登录成功后,模拟器将跳转至 H5 面板,可进行 H5 面板调试。
免代理模式
开启免代理模式的方式也很简单,就是在开发面板的链接后面加入一个参数:
&sw=true,假设我们要开发一个设备,它的 productId 为 ABCDEFG, deviceName 为 dev1,那么通过以下链接即可开启免代理模式- https://iot.cloud.tencent.com/h5panel/developing?productId=ABCDEFG&deviceName=dev1+ https://iot.cloud.tencent.com/h5panel/developing?productId=ABCDEFG&deviceName=dev1&sw=true
通过加入
sw=true,页面会开启一个 service-worker, 通过 service-worker 对请求的拦截和转发,将developing.script, developing.style的请求代理到 localhost 开发服务器。这种方式对于后面的真实设备调试,真机调试同样有效。免代理模式原理简述
如前文所述,开发模式下,H5 面板框架将分别从以下两个 URL 加载 JS 文件和 CSS 文件:
JS 文件 URL:
https://developing.script/developing.jsCSS 文件 URL:
https://developing.style/developing.css而开发服务器打包出来的文件通过 localhost 来访问的,因此我们需要在两者之间进行一个代理,上述的 whistle 就是起着这样的作用。如果不借助 whistle,我们也可以借助浏览器自带的 service-worker,通过监听
fetch事件,进而拦截和修改请求来完成这样的工作,这就是免代理模式。也就是说,所谓免代理模式并不是真正的免代理,只是避免了安装 whistle 这样的工具,而通过浏览器自身的能力(service-worker)实现了请求的代理。真实设备调试
通过真实设备调试,您可以对指定的设备进行 H5 面板调试。请将 ABCDEFG 替换为实际的产品 ID,abcdefg 替换为实际的设备名称。如需调试物联网开发平台提供的虚拟设备,请将 abcdefg 替换为
~virtualDev。https://iot.cloud.tencent.com/h5panel/developing?productId=ABCDEFG&deviceName=abcdefg
注意:
对指定设备进行调试时,会自动将该设备绑定到您的调试用户的家庭下,同时会解除该设备原来的绑定关系。
“已发布”状态的产品不支持真实设备调试,因为存在将真实用户正在使用的设备解除绑定关系的风险。
真机调试
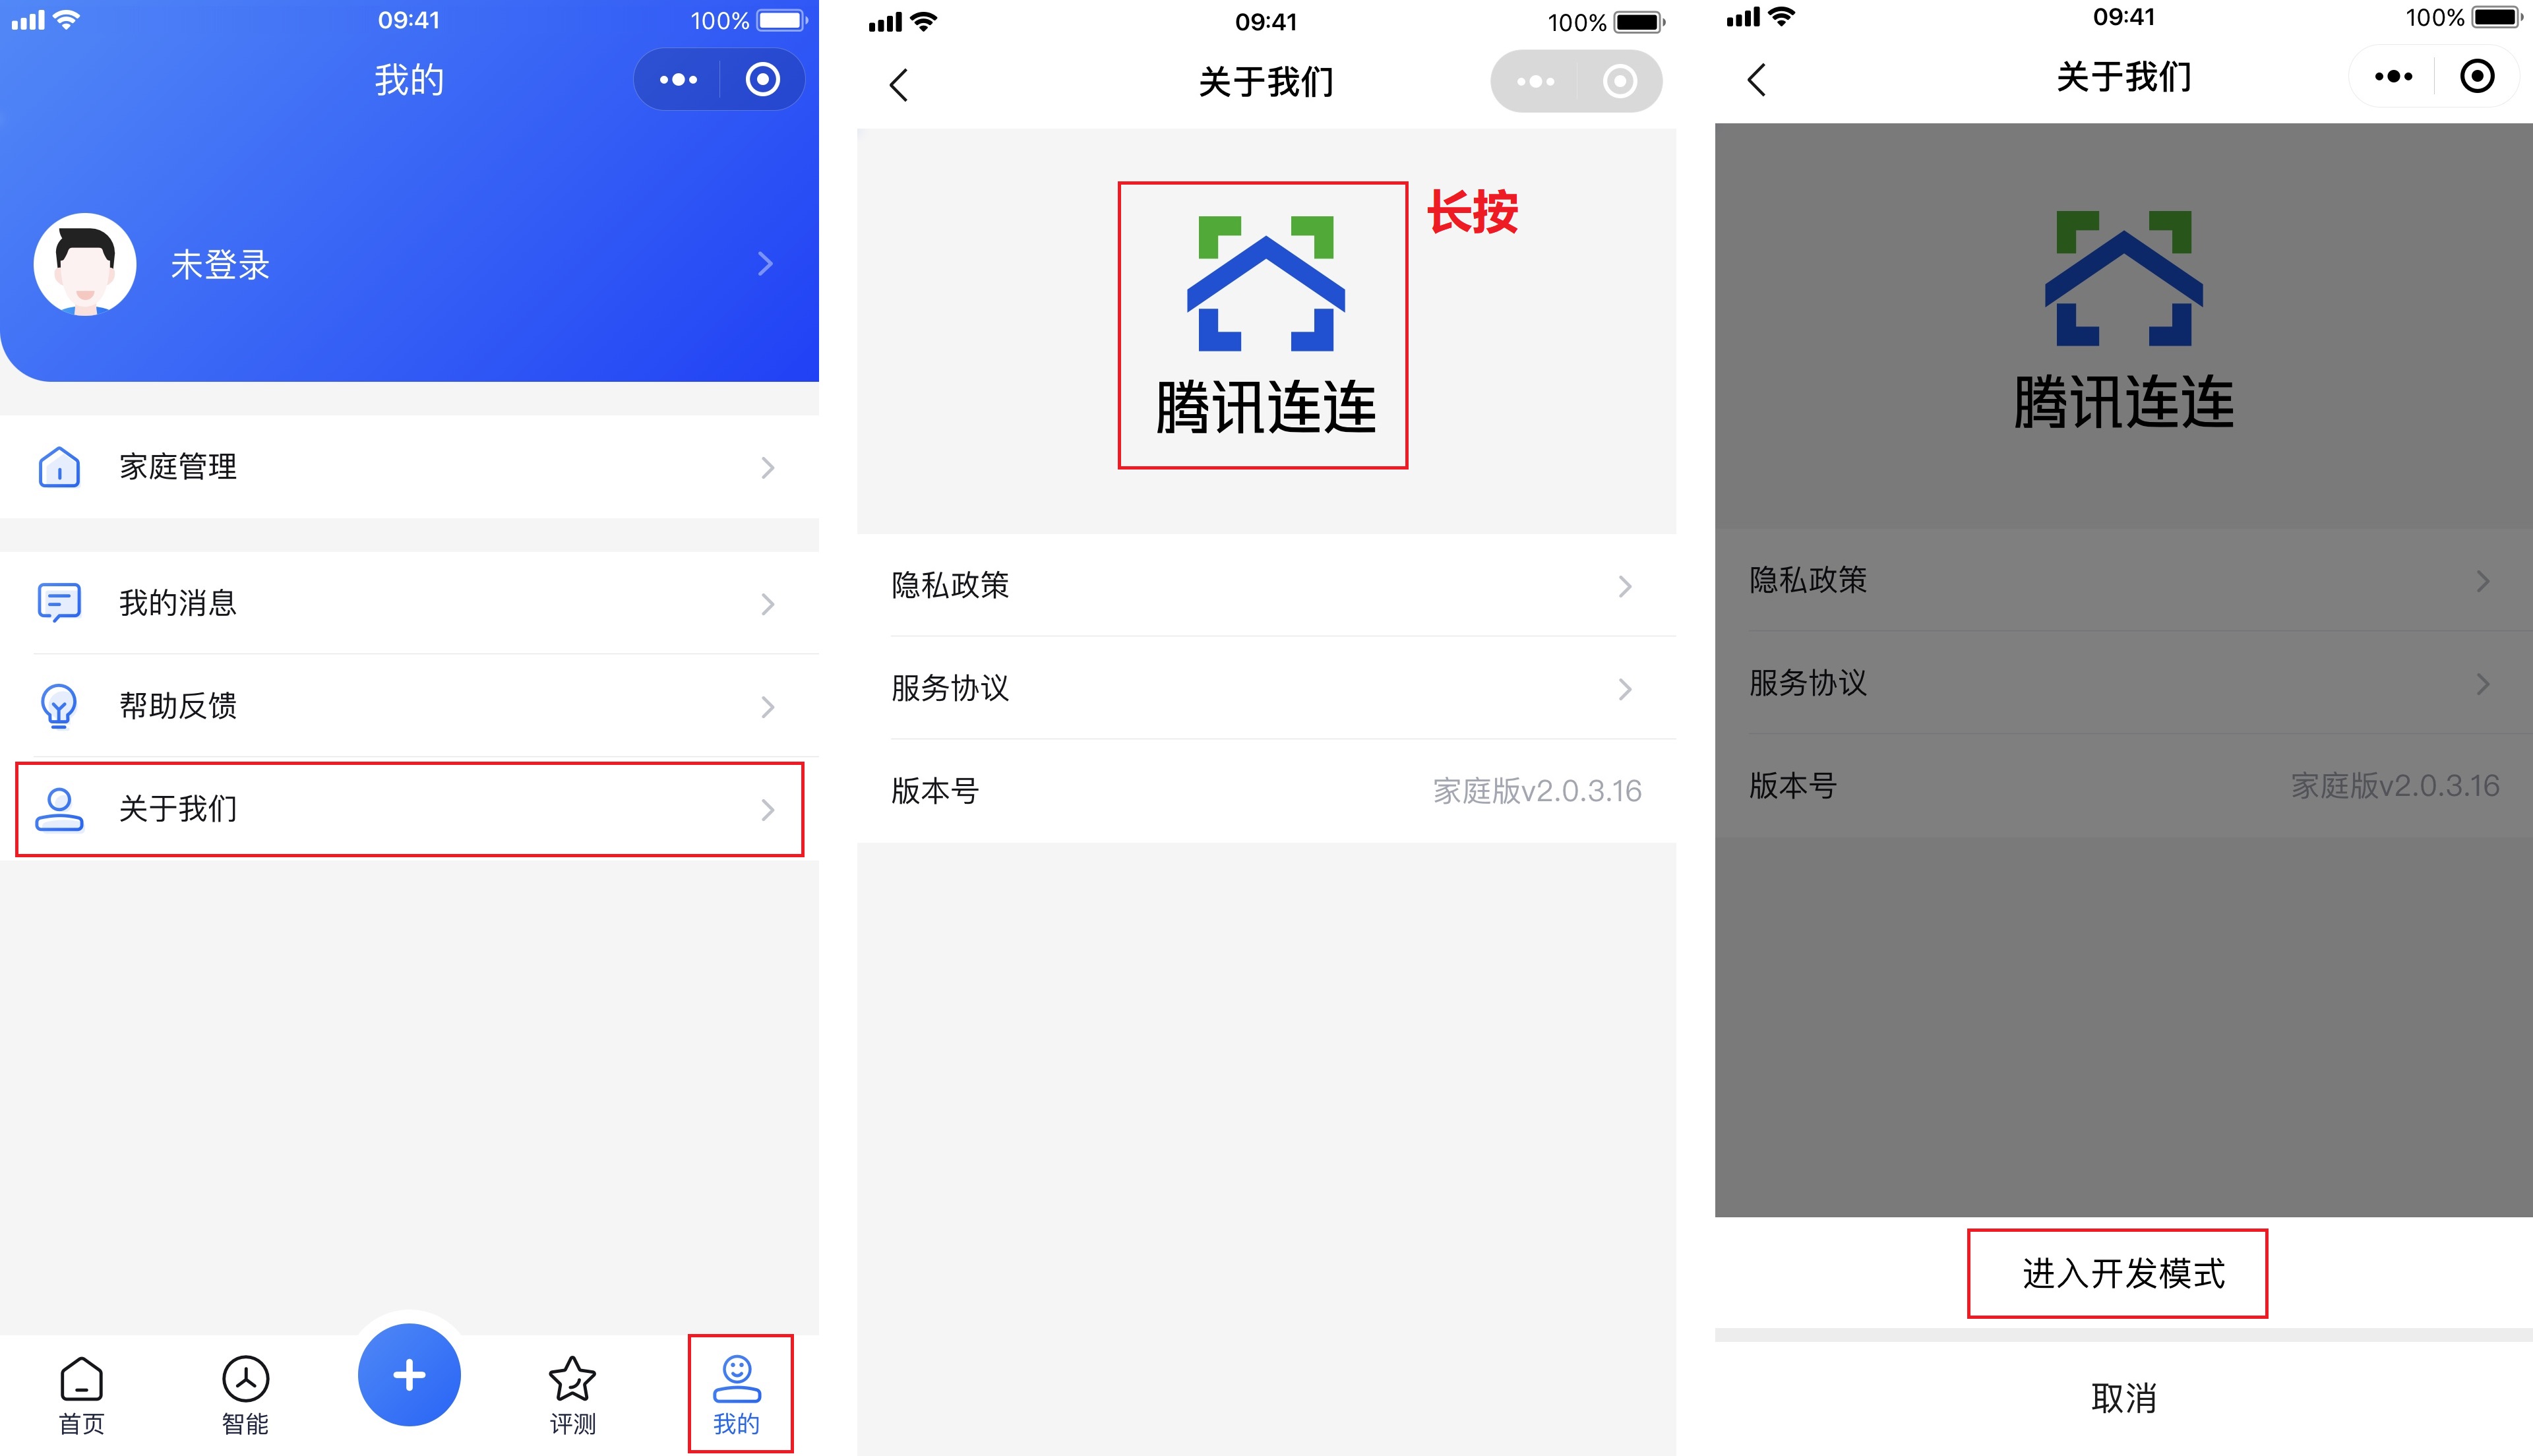
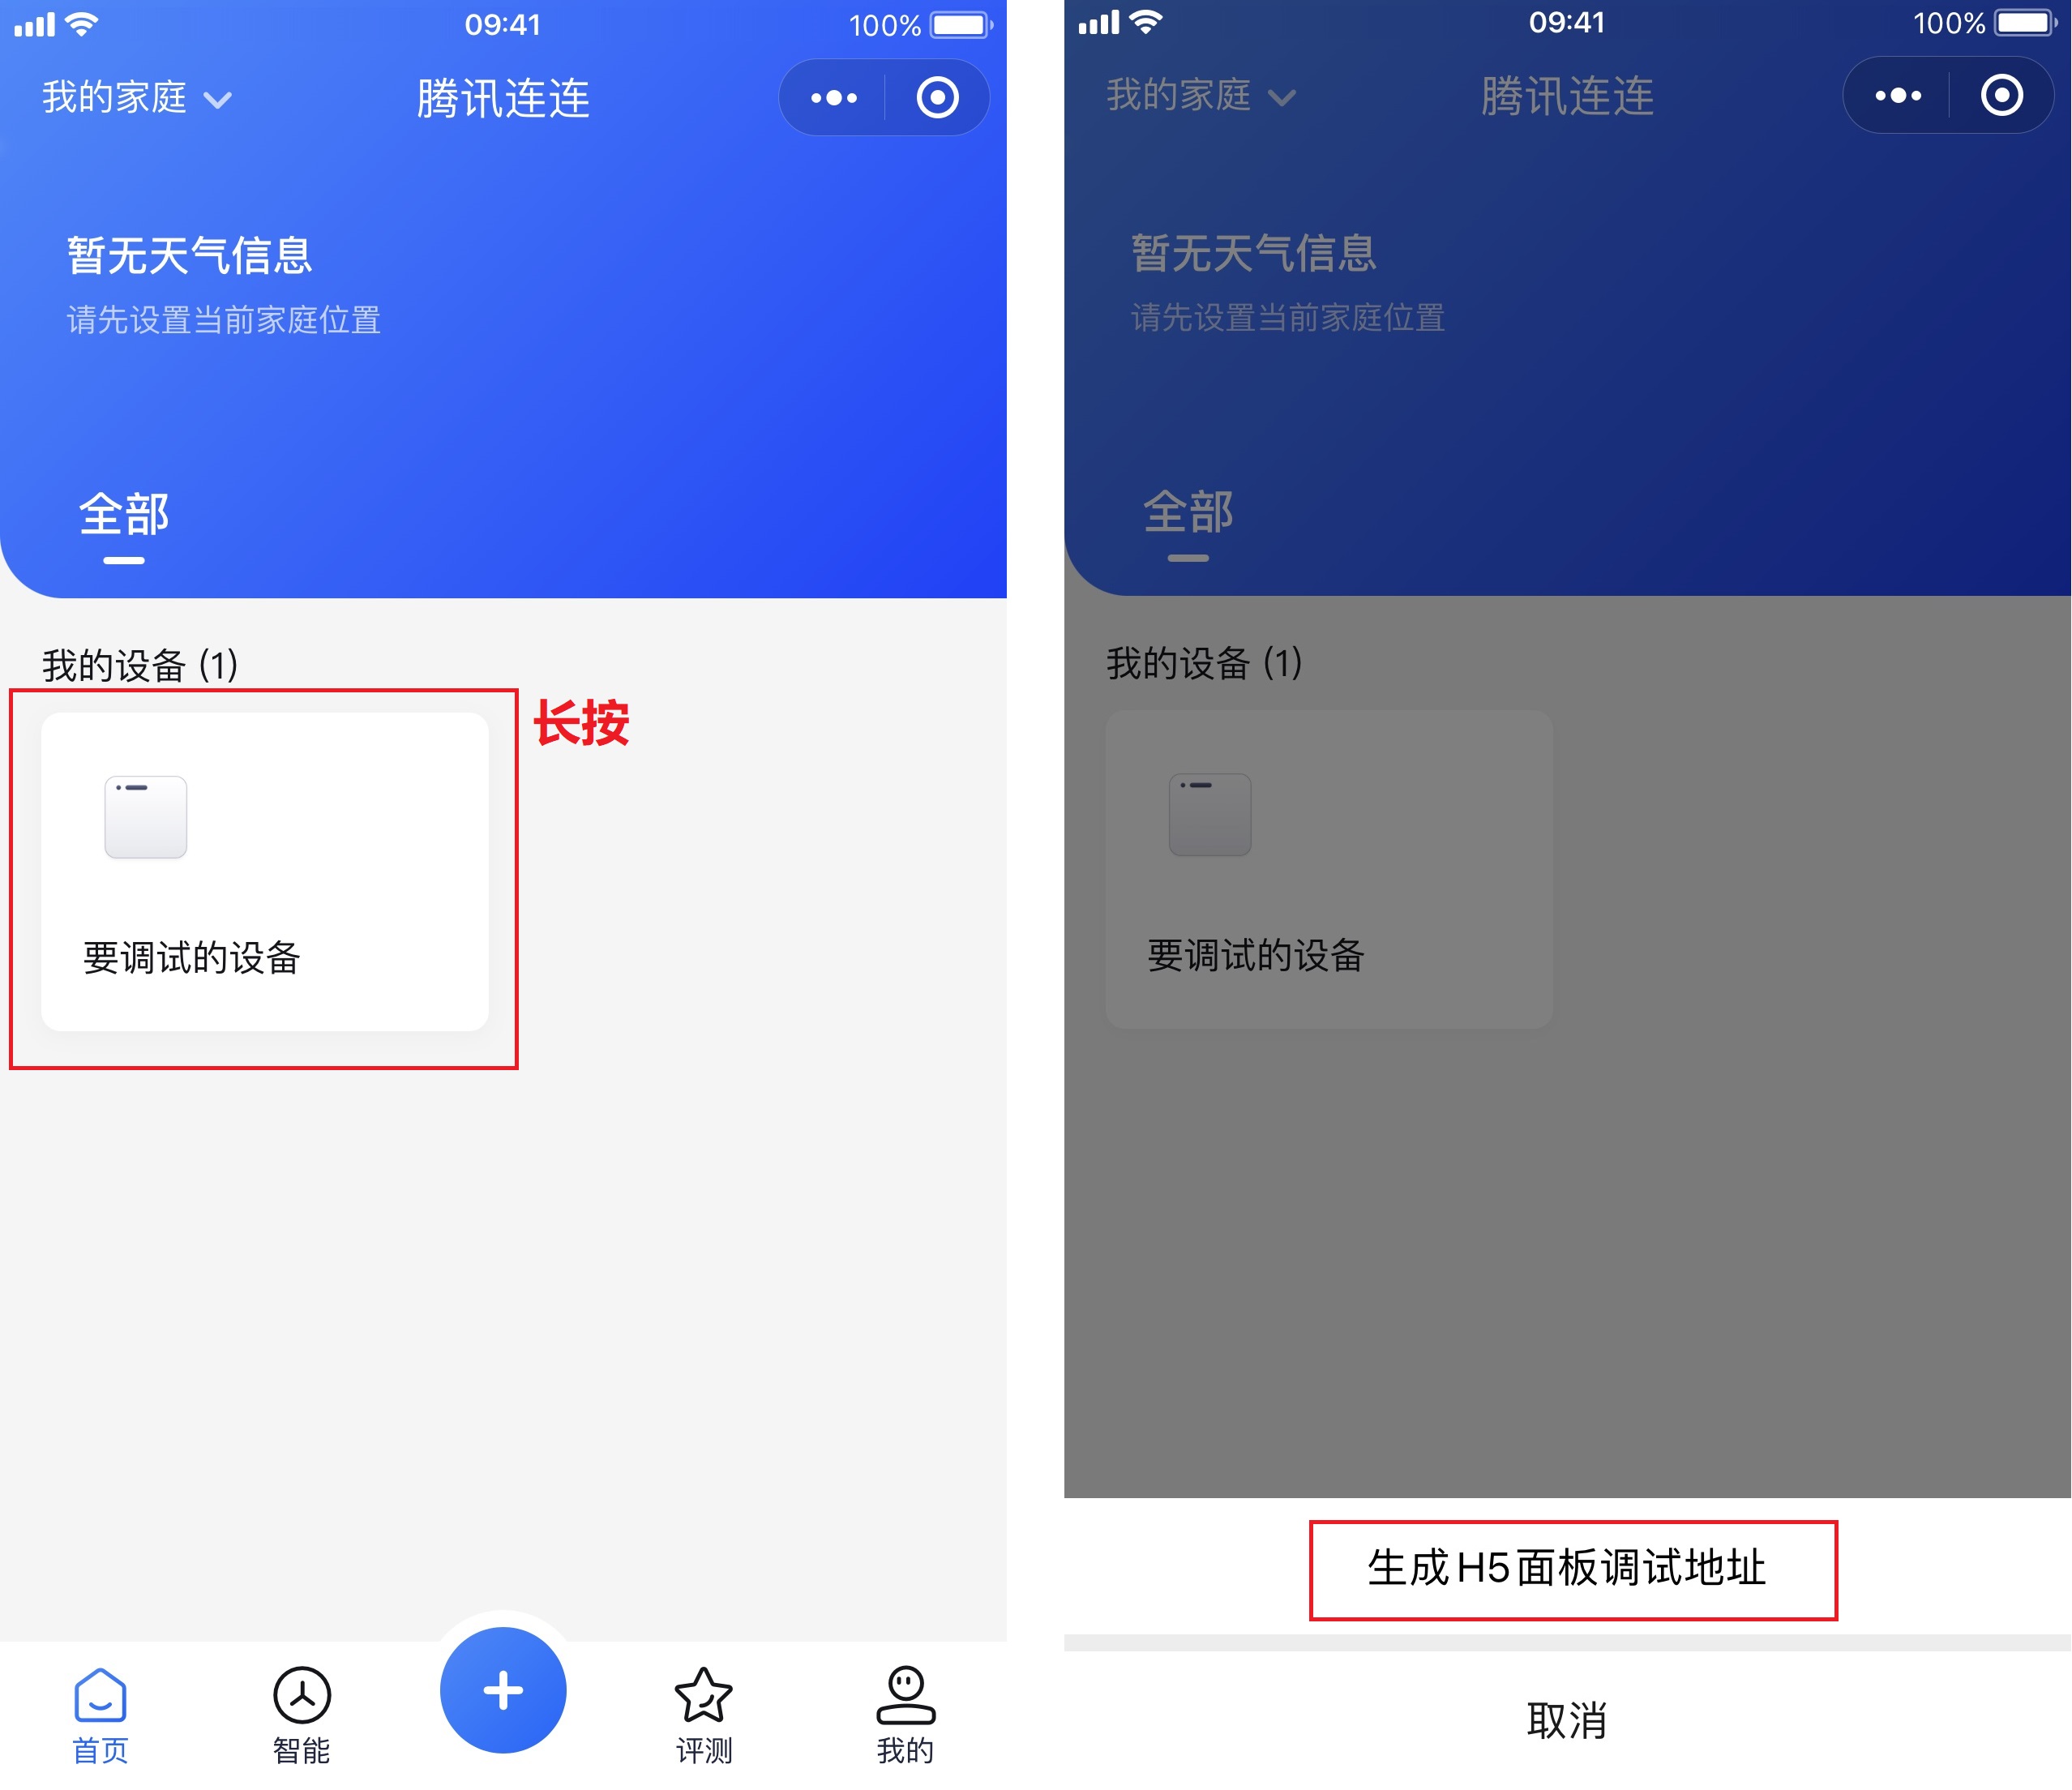
对于已发布的产品,不开放真实设备调试,且在小程序中调试 H5 面板又非常困难,为了解决这一问题,平台提供真机调试方案。真机调试可以在保持设备原有绑定关系的情况下,对 H5 面板进行调试。在开始之前,需要先使用腾讯连连小程序,将待调试的设备进行绑定。具体操作步骤如下。
1. 打开腾讯连连小程序,选择我的 > 关于我们,进入关于我们页面。
2. 长按腾讯连连 Logo,在弹出菜单中选择进入开发模式。页面提示进入开发模式成功。
3. 返回腾讯连连小程序首页,在设备列表中,长按需要调试的设备,在弹出菜单中选择“生成H5面板调试地址”,之后该调试地址将被复制到剪贴板。
4. 通过浏览器访问该调试地址,可以进行 H5 面板真机调试。
上传 H5 面板
在 H5 面板开发完成以后,需要在控制台上传 H5 面板的 JS 文件和 CSS 文件,具体操作如下:
1. 登录腾讯云 物联网开发平台控制台,选择项目与产品,进入产品详情页面。
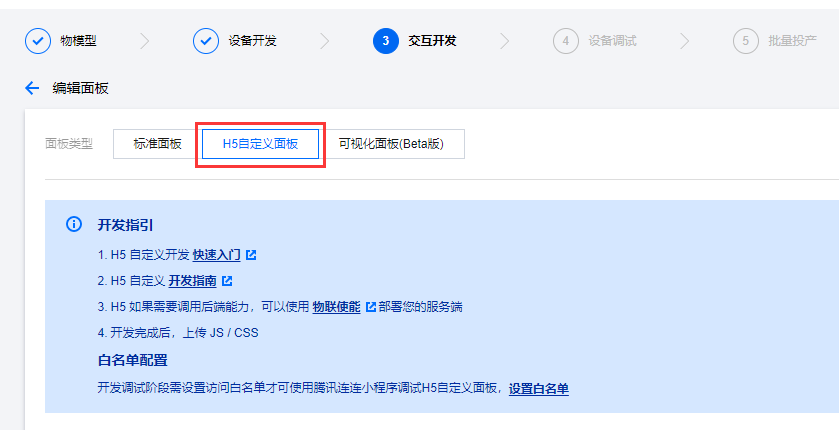
2. 选择交互开发 > 面板配置,单击配置,进入面板配置页面。
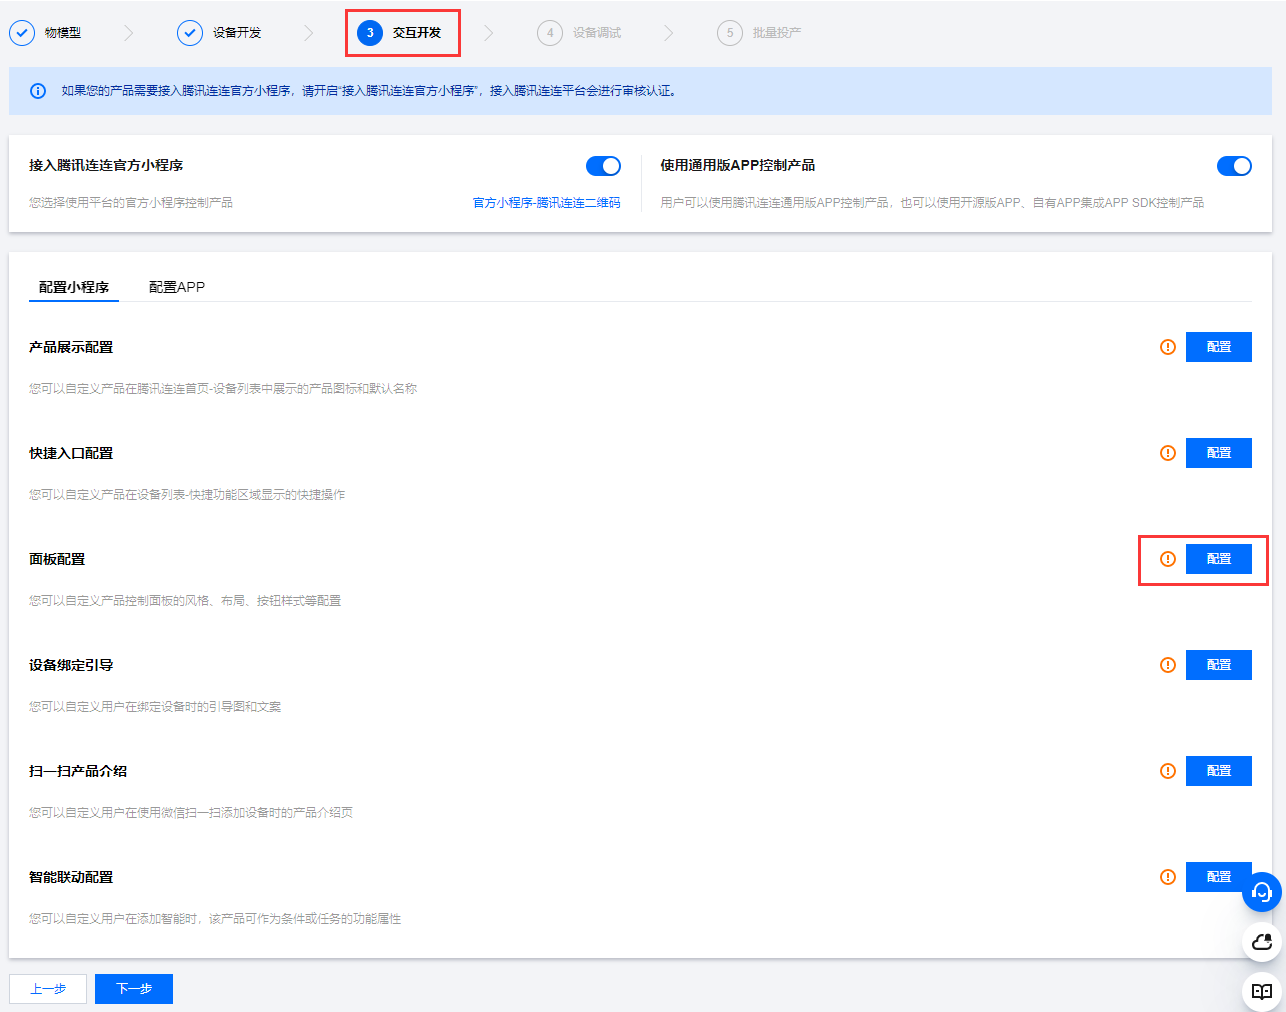
3. 在面板类型中选择 H5自定义面板。
4. 在上传 JS表单中,单击上传,选择 H5 面板的 JS 文件。上传完成后,页面显示 JS 文件的名称、大小和 MD5 信息。
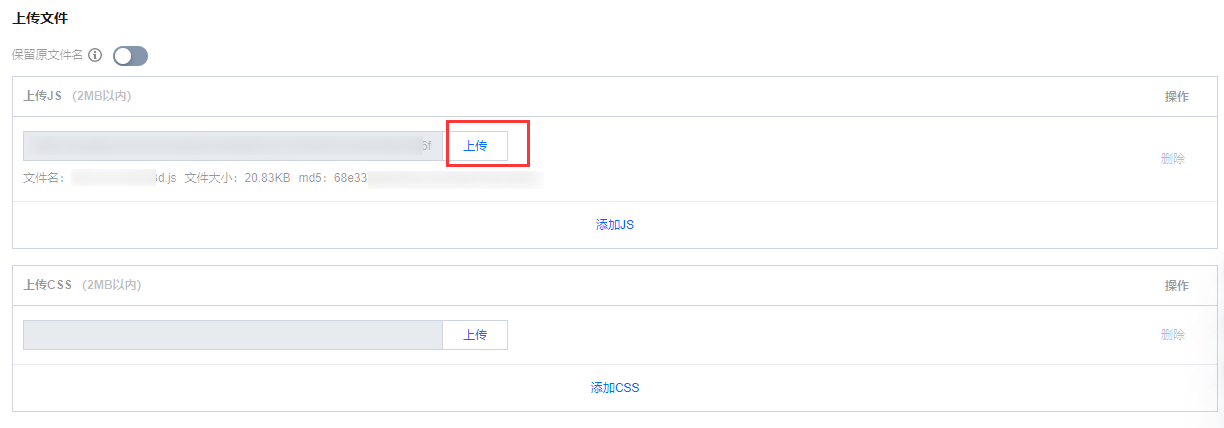
5. 如果需要上传 CSS 文件,在“上传 CSS”表单中,单击上传,选择 H5 面板的 CSS 文件。上传完成后,页面显示 CSS 文件的名称、大小和 MD5 信息。
6. 单击保存,页面提示保存成功,上传的 JS 文件与 CSS 文件保存生效。
说明:
如果面板中包含小图片,可以通过构建工具内联到代码中,如果图片比较大,建议上传到 COS 后,通过链接引用。


