西西嘛呦
作者相关精选
c语言之指针数据类型的不同定义含义
前往小程序,Get更优阅读体验!
立即前往
定义 | 含义 |
|---|---|
int i; | 定义整型变量i |
int* p; | p为指向整型数据的指针变量 |
int a[n]; | 定义整型数组a,它有n个元素 |
int* p[n]; | 定义指针数组p,它由n个指向整型数据的指针元素构成 |
int (*p)[n]; | p为指向含n个元素的一维数组的指针变量 |
int f(); | f为返回整型值的函数 |
int* p(); | p为返回一个指针的函数,该指针指向整型数据 |
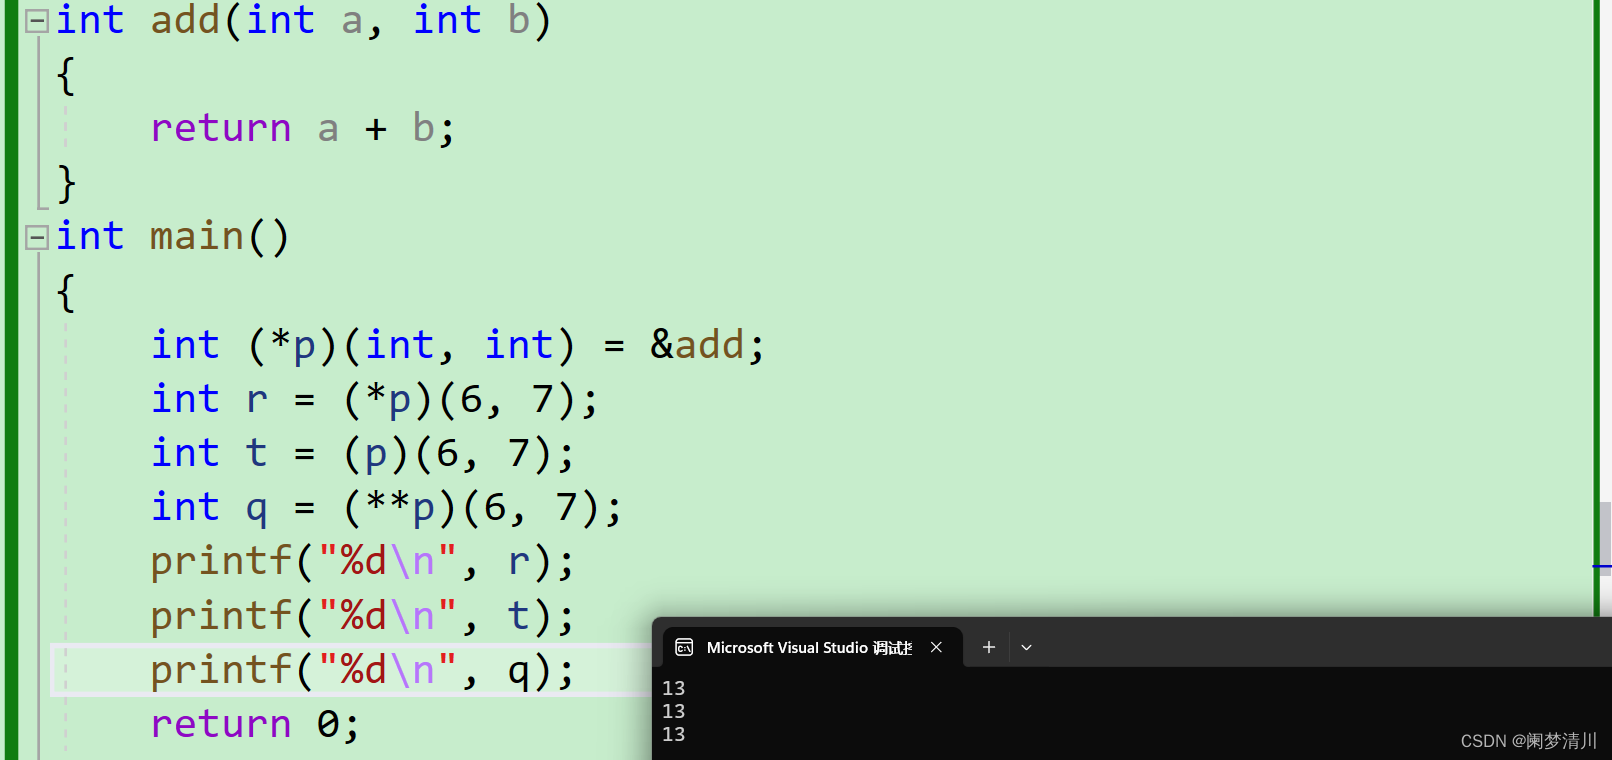
int (*p)(); | p为函数指针。该函数返回一个整型值 |
int **P; | p是一个指针变量,它指向一个指向整型数据的指针变量 |
本文参与 腾讯云自媒体同步曝光计划,分享自作者个人站点/博客。
原始发表:2020-01-01 ,如有侵权请联系 cloudcommunity@tencent.com 删除
评论
登录后参与评论
暂无评论
登录 后参与评论
推荐阅读
初识C语言·指针(3)
750
C语言进阶-高阶指针
4080
深入浅出C语言指针(进阶篇)
1400
C语言之指针详解(3)
770
【指针合集】全方位理解C语言指针
2850
C语言进阶——指针
1410
C语言指针进阶
2610
【C语言】指针总结3
850
指针进阶(C语言)
1570
【C指针详解】进阶篇
2730
OC学习3——C语言特性之指针
1.5K0
C语言:深入理解指针(3)
1310
相关推荐
【C语言】带你手把手拿捏指针(3)(含转移表)
更多 >领券
腾讯云开发者

扫码关注腾讯云开发者
领取腾讯云代金券
Copyright © 2013 - 2025 Tencent Cloud. All Rights Reserved. 腾讯云 版权所有
深圳市腾讯计算机系统有限公司 ICP备案/许可证号:粤B2-20090059 深公网安备号 44030502008569
腾讯云计算(北京)有限责任公司 京ICP证150476号 | 京ICP备11018762号 | 京公网安备号11010802020287
Copyright © 2013 - 2025 Tencent Cloud.
All Rights Reserved. 腾讯云 版权所有
登录 后参与评论


