kaggle实战-精美可视化与时序预测
kaggle实战-销售数据的精美可视化分析与时序预测
本文是基于一份商品销售数据,使用Pandas、seaborn、statmodels、sklearn、线性回归预测、xgboost等库和方法进行多角度的可视化分析和时序预测。

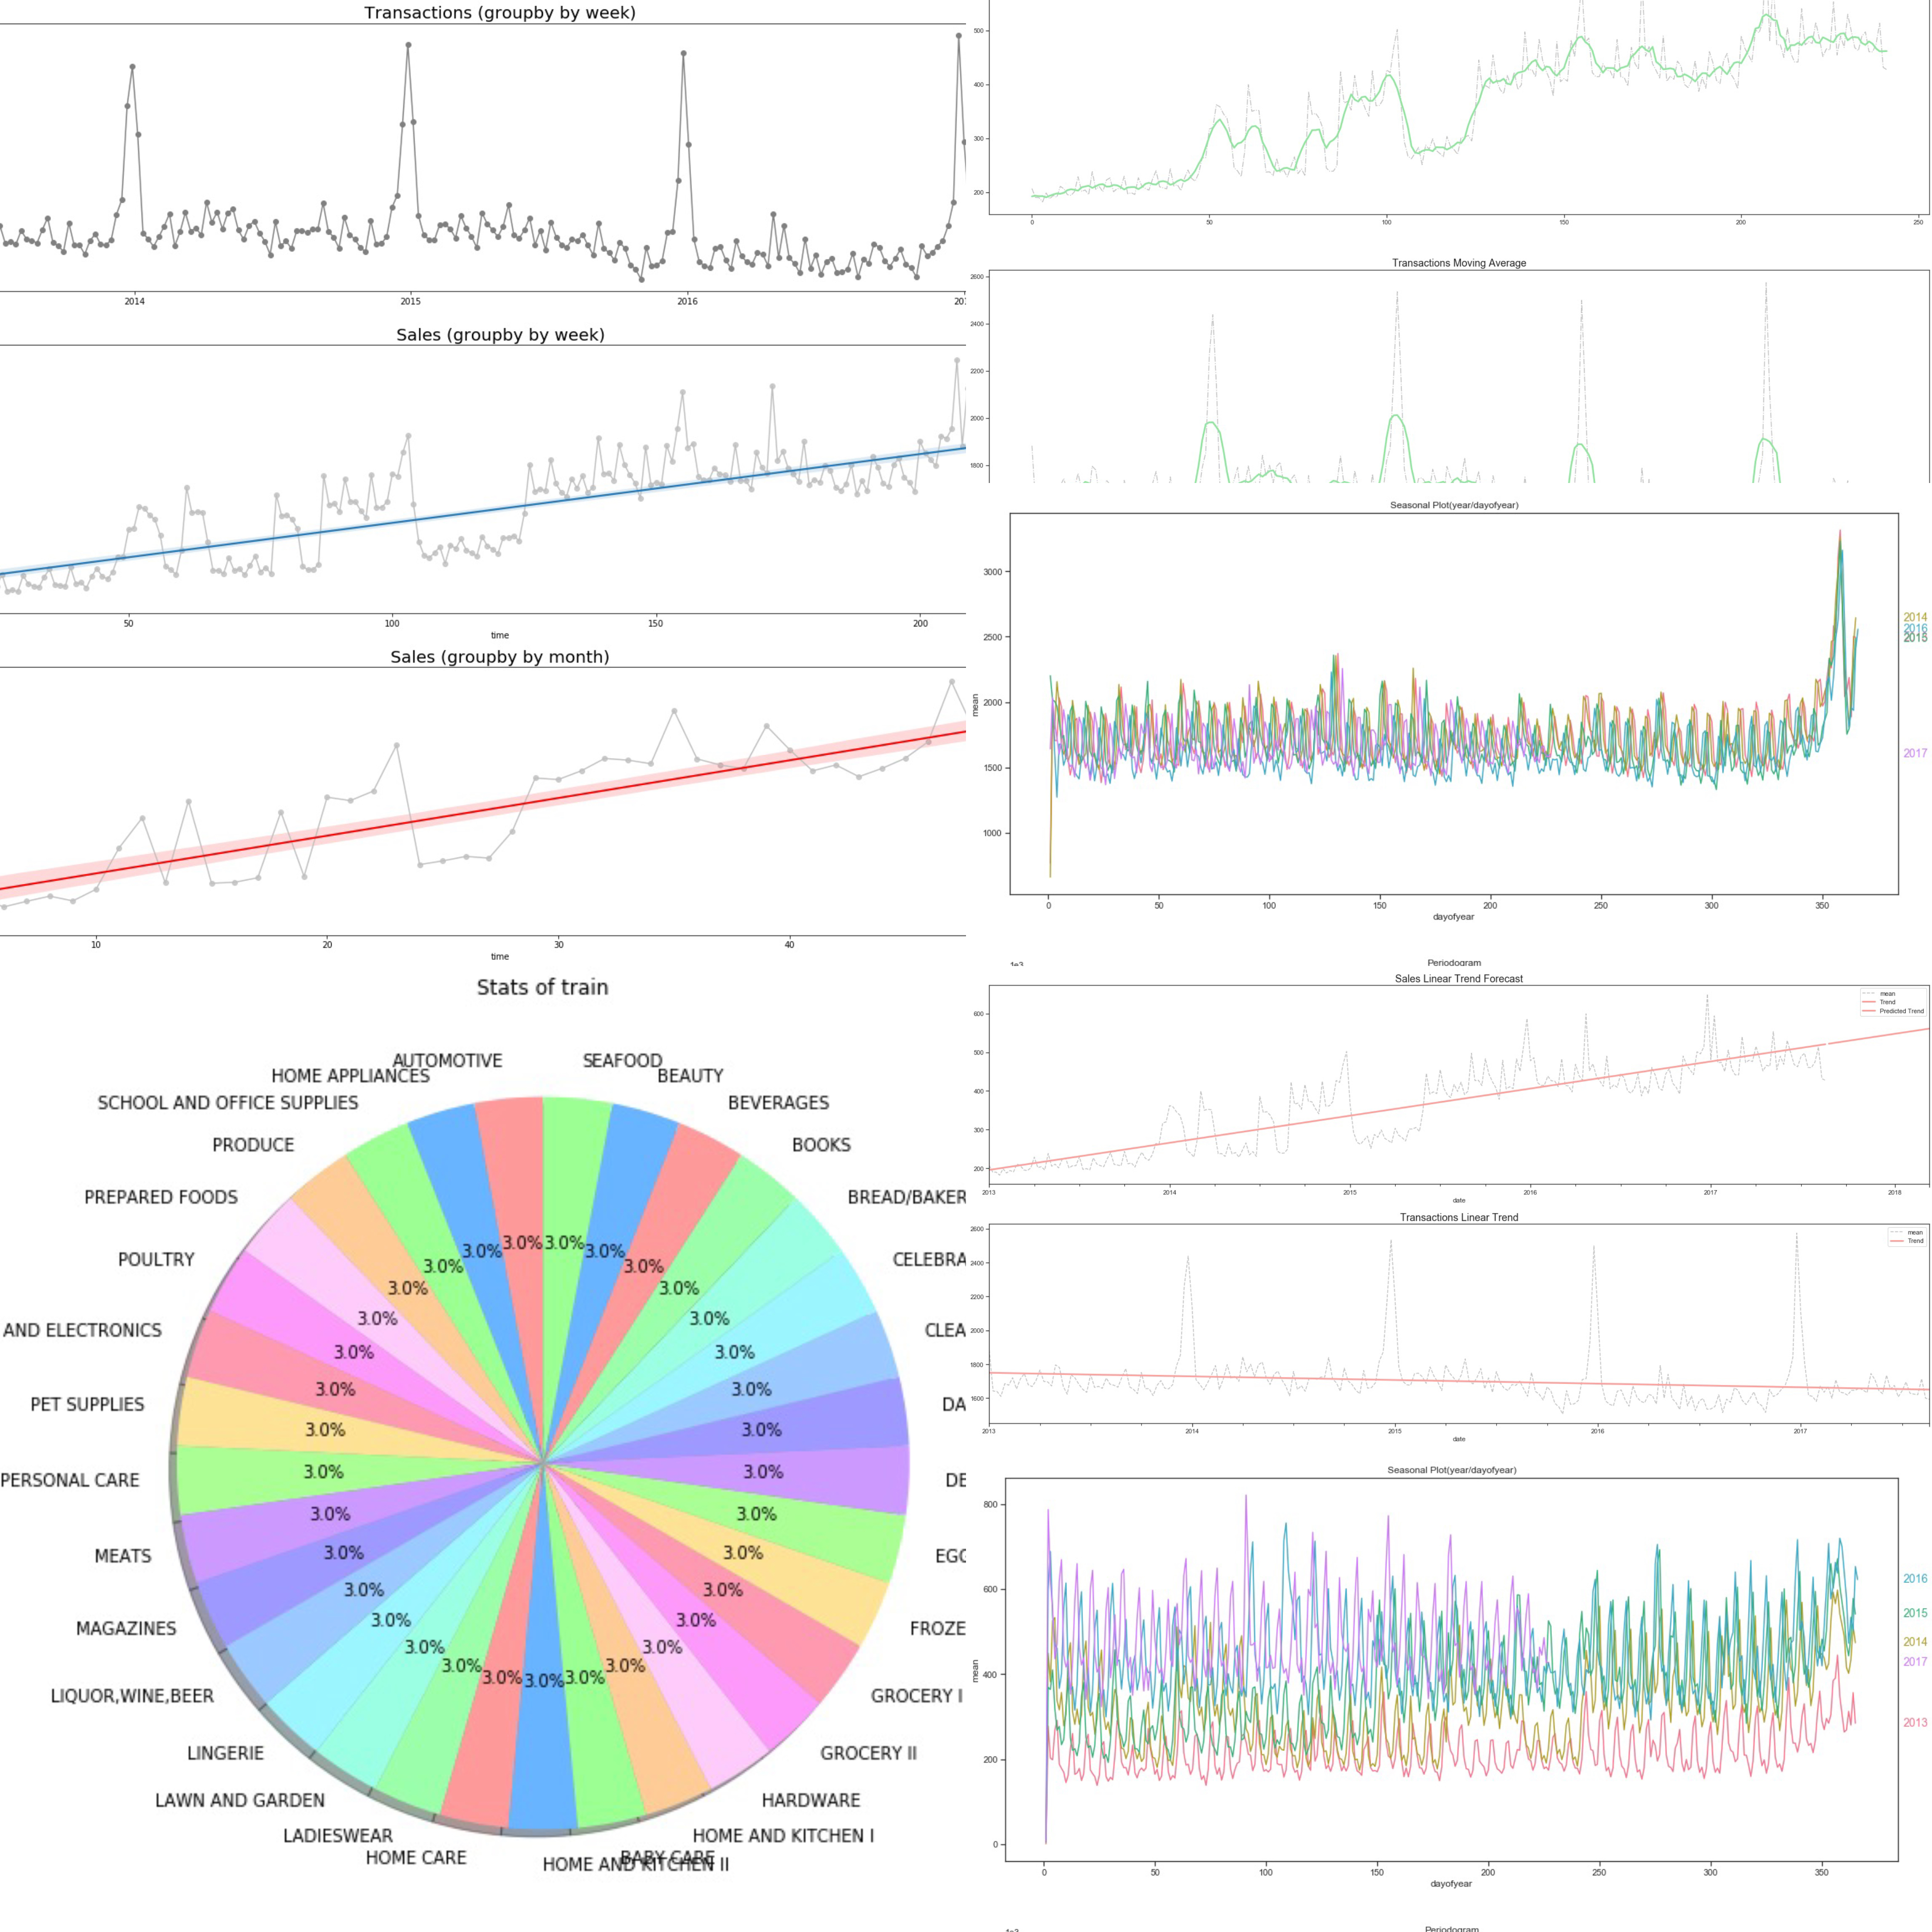
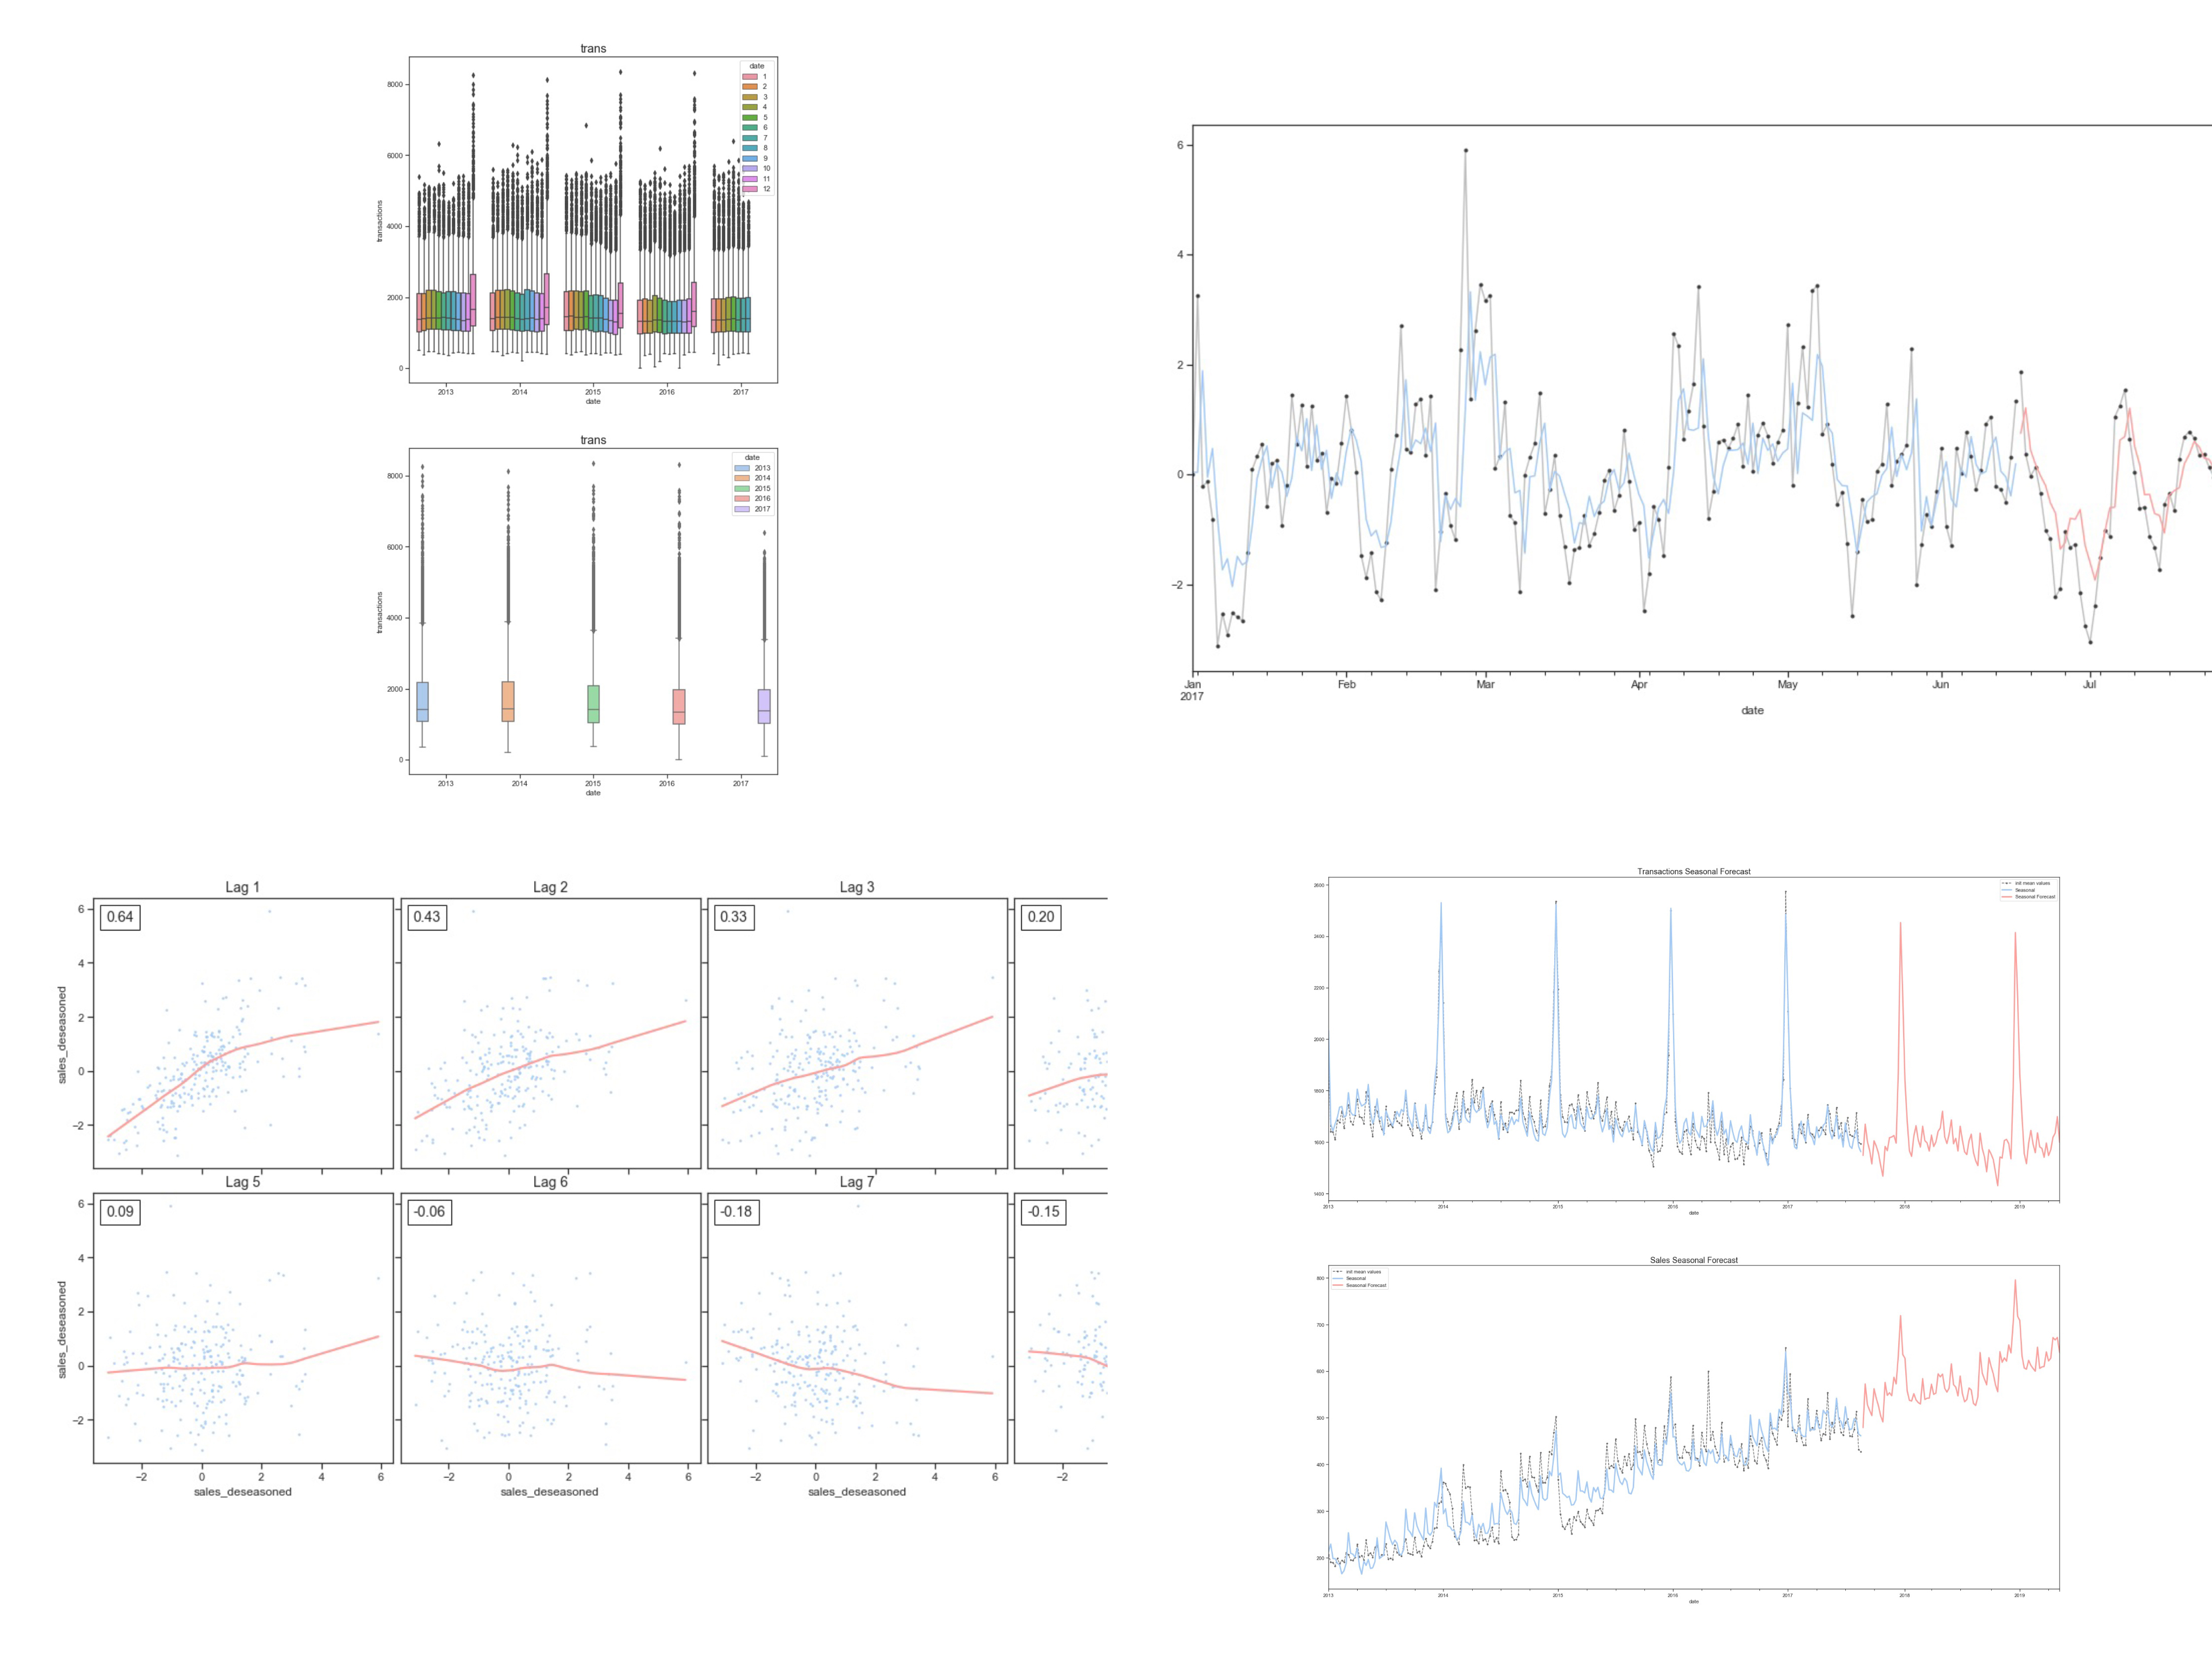
结果
先展示部分的可视化结果:
导入库
import math
import numpy as np
import pandas as pd
import seaborn as sns
import matplotlib.pyplot as plt
from matplotlib.colors import ListedColormap
from statsmodels.tsa.deterministic import CalendarFourier, DeterministicProcess
from sklearn.linear_model import LinearRegression
from pandas import date_range
from statsmodels.graphics.tsaplots import plot_pacf

from sklearn.model_selection import train_test_split

from sklearn.preprocessing import LabelEncoder
from xgboost import XGBRegressor

from sklearn.linear_model import ElasticNet, Lasso, Ridge

from sklearn.ensemble import ExtraTreesRegressor, RandomForestRegressor
from sklearn.neighbors import KNeighborsRegressor
from sklearn.neural_network import MLPRegressor
from sklearn.multioutput import RegressorChain
import warnings
warnings.filterwarnings("ignore")
读取数据
holidays = pd.read_csv('holidays_events.csv')
oil = pd.read_csv('oil.csv')
stores = pd.read_csv('stores.csv')
trans = pd.read_csv('transactions.csv')

train = pd.read_csv('train.csv')
test = pd.read_csv('test.csv')
下面是具体的字段解释:
train/test
id:id号
date:日期
store_nbr:所在商店;比如1-2-3-4…
family:所属商品类型;比如:AUTOMOTIVE, HOME APPLIANCES, SCHOOL AND OFFICE SUPPLIES
sales:当日的销售额
onpromotion:商品在当日的进货数量
holidays
date:日期
type:类型;包含Holiday/Event/Other3个取值
locale:事件范围区域;National/Local/Other(全国的、本地的或者其他)
locale_name:区域名称
description:节日的描述信息
transferred:是否是推迟后节日;True或者False
oil
id:日期
dcoilwtico:当天的油价
stores
store_nbr:所属商店类型
city:所在城市
state:所在州
type:类型;A-B-C-D-E
cluster:聚类结果;就是一群类似的商店组成的团体;1-2-3-4-5…
trans
date:日期
store_nbr:所在商店
transcations:当天的交易额
思维导图
思维导图中整理了5个csv文件中的数据字段以及它们之间的关联关系:

数据基本信息
以holidays数据为例,查看数据的基本信息:
1、head方法查看前5条数据
# holidays

holidays.head()
2、shape方法查看数据和行和列
holidays.shape(350, 6)3、describe查看数据的描述统计信息;只针对数值型字段
holidays.describe()
4、isnull方法查看数据的缺失值情况
holidays.isnull().sum()date 0
type 0
locale 0
locale_name 0
description 0
transferred 0
dtype: int64train.head()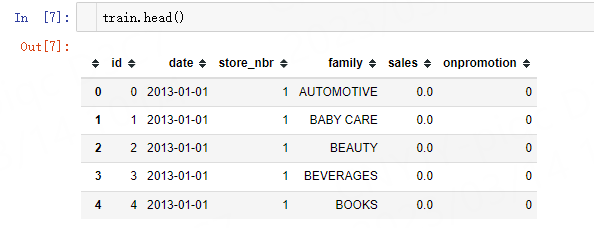
oil.head()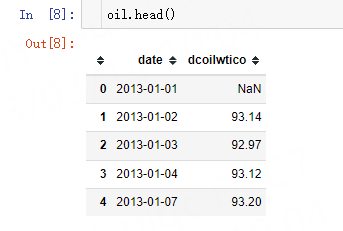
stores.head()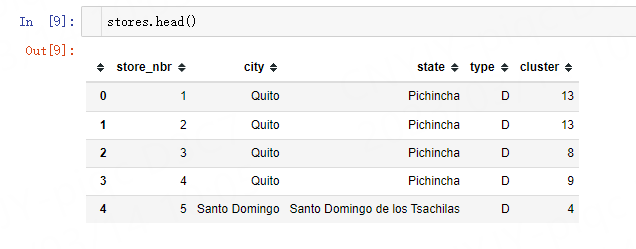
trans.head()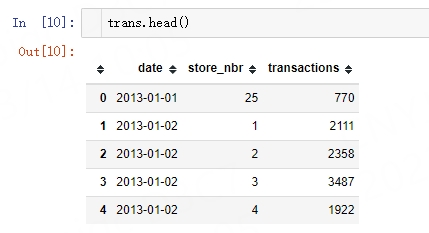
时间格式转化
holidays['date'] = pd.to_datetime(holidays['date'], format = "%Y-%m-%d")
oil['date'] = pd.to_datetime(oil['date'], format = "%Y-%m-%d")
trans['date'] = pd.to_datetime(trans['date'], format = "%Y-%m-%d")
train['date'] = pd.to_datetime(train['date'], format = "%Y-%m-%d")
test['date'] = pd.to_datetime(test['date'], format = "%Y-%m-%d")
精美可视化
油价随时间变化(原始数据)
oil.head()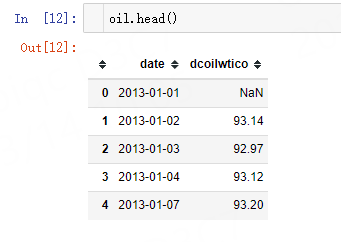
fig, axes = plt.subplots(nrows=1, ncols=1, figsize=(25,15))
oil.plot.line(x="date",
              y="dcoilwtico",
              color='b',  # 颜色
              title ="dcoilwtico",  # 标题
              ax = axes,
              rot=0)
plt.show()
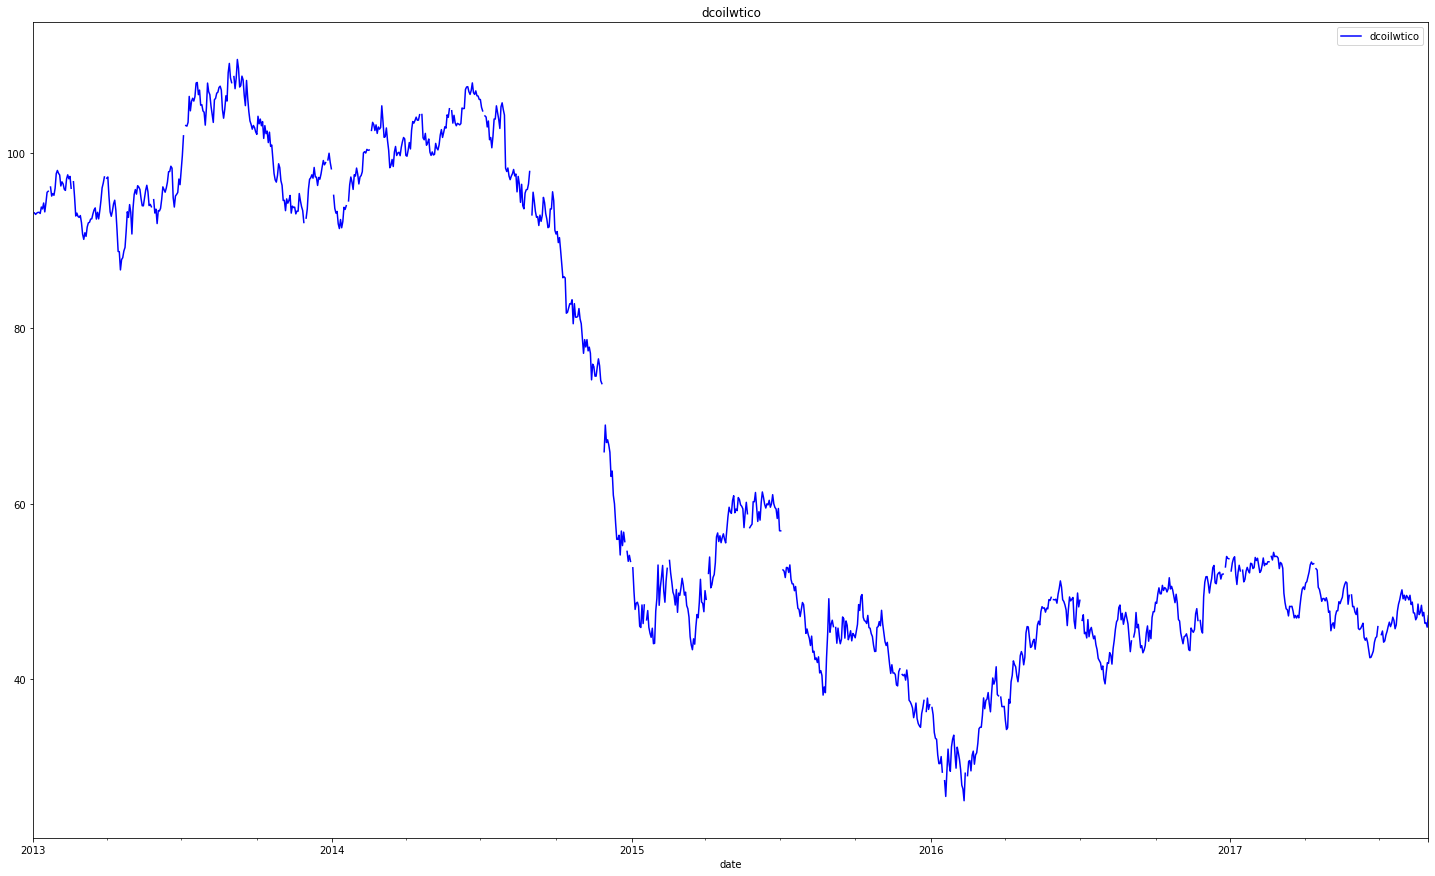
原始数据分组可视化-groupby
# 定义分组统计函数

def grouped(df, key, freq, col):
    """
    定义分组统计均值的函数
    """
    df_groupby = df.groupby([pd.Grouper(key=key,freq=freq)]).agg(mean=(col,'mean'))
    df_groupby = df_groupby.reset_index()
return df_groupbydf_groupby_trans_w = grouped(trans, 'date', 'W', 'transactions')
df_groupby_trans_w.head(10)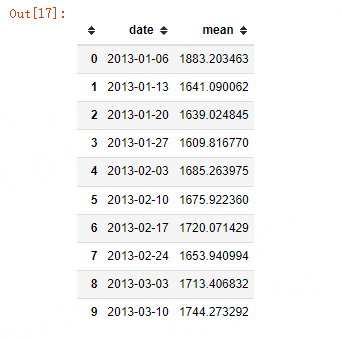
在分组统计后的信息中加入time字段:
def add_time(df, key, freq, col):
    # 调用上面的函数
    df_groupby = grouped(df, key, freq, col)
    # 添加time字段
    df_groupby['time'] = np.arange(len(df_groupby.index))
    # 将time字段放在索引为1的位置
    column_time = df_groupby.pop('time')
    df_groupby.insert(1, 'time', column_time)
    return df_groupby
将训练集train分别按照不同的时间频率进行统计:
# 基于week和month
df_groupby_train_w = add_time(train, 'date', 'W', 'sales')
df_groupby_train_m = add_time(train, 'date', 'M', 'sales')

df_groupby_train_w.head()
.dataframe tbody tr th:only-of-type { vertical-align: middle; } <pre><code>.dataframe tbody tr th { vertical-align: top; } .dataframe thead th { text-align: right; } </code></pre>
date | time | mean | |
|---|---|---|---|
0 | 2013-01-06 | 0 | 206.843478 |
1 | 2013-01-13 | 1 | 190.285220 |
2 | 2013-01-20 | 2 | 189.835452 |
3 | 2013-01-27 | 3 | 182.152050 |
4 | 2013-02-03 | 4 | 198.564267 |
线性回归-Linear Regression
对原始数据的先线性回归
fig, axes = plt.subplots(nrows=3,
                         ncols=1,
                         figsize=(30,20)
                        )

# transactions基于weekly
axes[0].plot('date',
             'mean',
             data=df_groupby_trans_w,
             color='grey',
             marker='o')

axes[0].set_title("Transactions (groupby by week)", fontsize=20)

# sales-weekly
axes[1].plot('time',
             'mean',
             data=df_groupby_train_w,
             color='0.75')
axes[1].set_title("Sales (groupby by week)", fontsize=20)

# 线性回归
axes[1] = sns.regplot(x='time',
                      y='mean',
                      data=df_groupby_train_w,
                      scatter_kws=dict(color='0.75'),
                      ax = axes[1])

# sales-monthly
axes[2].plot('time',
             'mean',
             data=df_groupby_train_m,
             color='0.75')

axes[2].set_title("Sales (groupby by month)", fontsize=20)
# 基于线性回归
axes[2] = sns.regplot(x='time',
                      y='mean',
                      data=df_groupby_train_m,
                      scatter_kws=dict(color='0.75'),
                      line_kws={"color": "red"},
                      ax = axes[2])

plt.show()
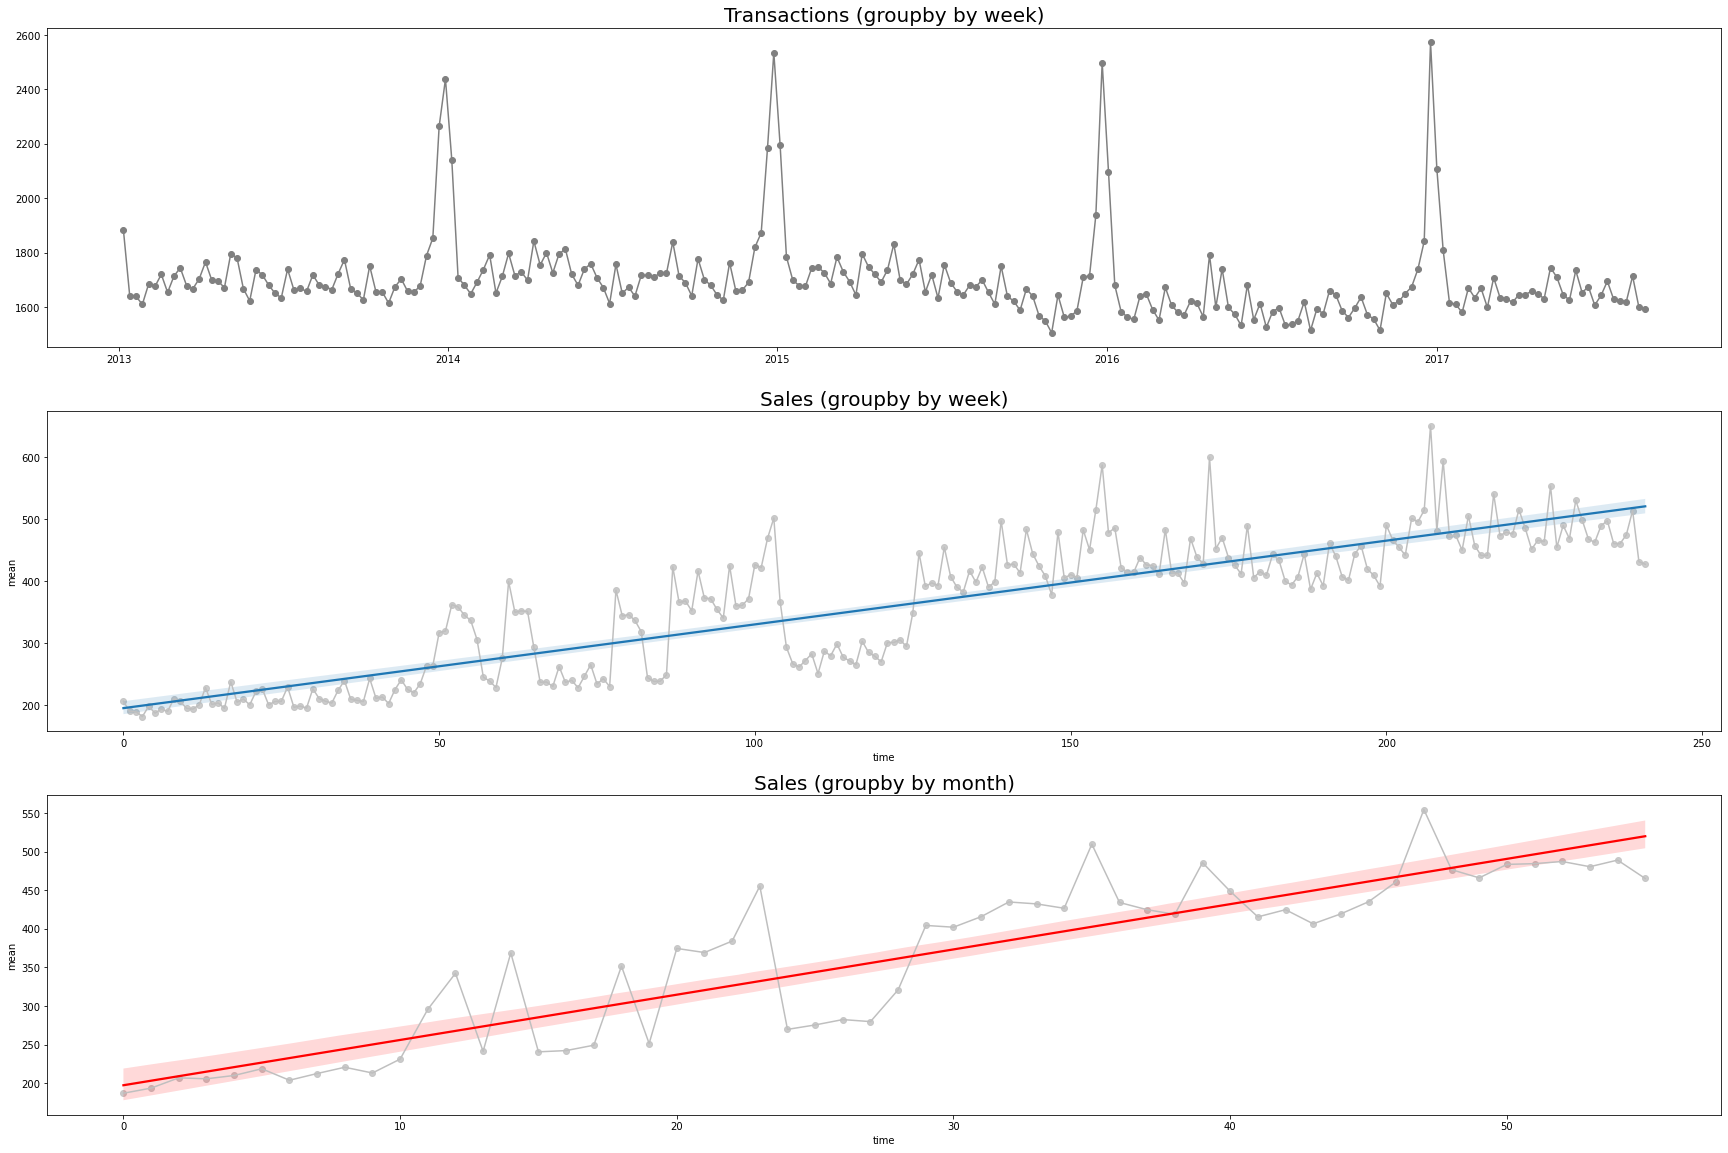
基于差分平移特征的线性回归
构造添加差分特征函数
def add_lag(df, key, freq, col, lag):
    """
    lag表示移动的标志位长度
    """
    df_groupby = grouped(df, key, freq, col)
    name = 'Lag_' + str(lag)
    df_groupby['Lag'] = df_groupby['mean'].shift(lag)
return df_groupby# 移动一个单位
df_groupby_train_w_lag1 = add_lag(train, 'date', 'W','sales',1)
df_groupby_train_m_lag1 = add_lag(train, 'date', 'W', 'sales', 1)
df_groupby_train_w_lag1.head().dataframe tbody tr th:only-of-type { vertical-align: middle; } <pre><code>.dataframe tbody tr th { vertical-align: top; } .dataframe thead th { text-align: right; } </code></pre>
date | mean | Lag | |
|---|---|---|---|
0 | 2013-01-06 | 206.843478 | NaN |
1 | 2013-01-13 | 190.285220 | 206.843478 |
2 | 2013-01-20 | 189.835452 | 190.285220 |
3 | 2013-01-27 | 182.152050 | 189.835452 |
4 | 2013-02-03 | 198.564267 | 182.152050 |
可视化绘图-train数据
fig, axes = plt.subplots(nrows=2,
                         ncols=1,
                         figsize=(30,20))

axes[0].plot('Lag',
             'mean',
             data=df_groupby_train_w_lag1,
             color='0.75',
             linestyle=(0, (1, 10)))

axes[0].set_title("Sales (groupby by week)", fontsize=20)
axes[0] = sns.regplot(x='Lag',
                      y='mean',
                      data=df_groupby_train_w_lag1,
                      scatter_kws=dict(color='0.75'),
                      ax = axes[0])


axes[1].plot('Lag',
             'mean',
             data=df_groupby_train_m_lag1,
             color='0.75',
             linestyle=(0, (1, 10)))

axes[1].set_title("Sales (groupby by month)", fontsize=20)
axes[1] = sns.regplot(x='Lag',
                      y='mean',
                      data=df_groupby_train_m_lag1,
                      scatter_kws=dict(color='0.75'),
                      line_kws={"color": "red"},
                      ax = axes[1])

plt.show()
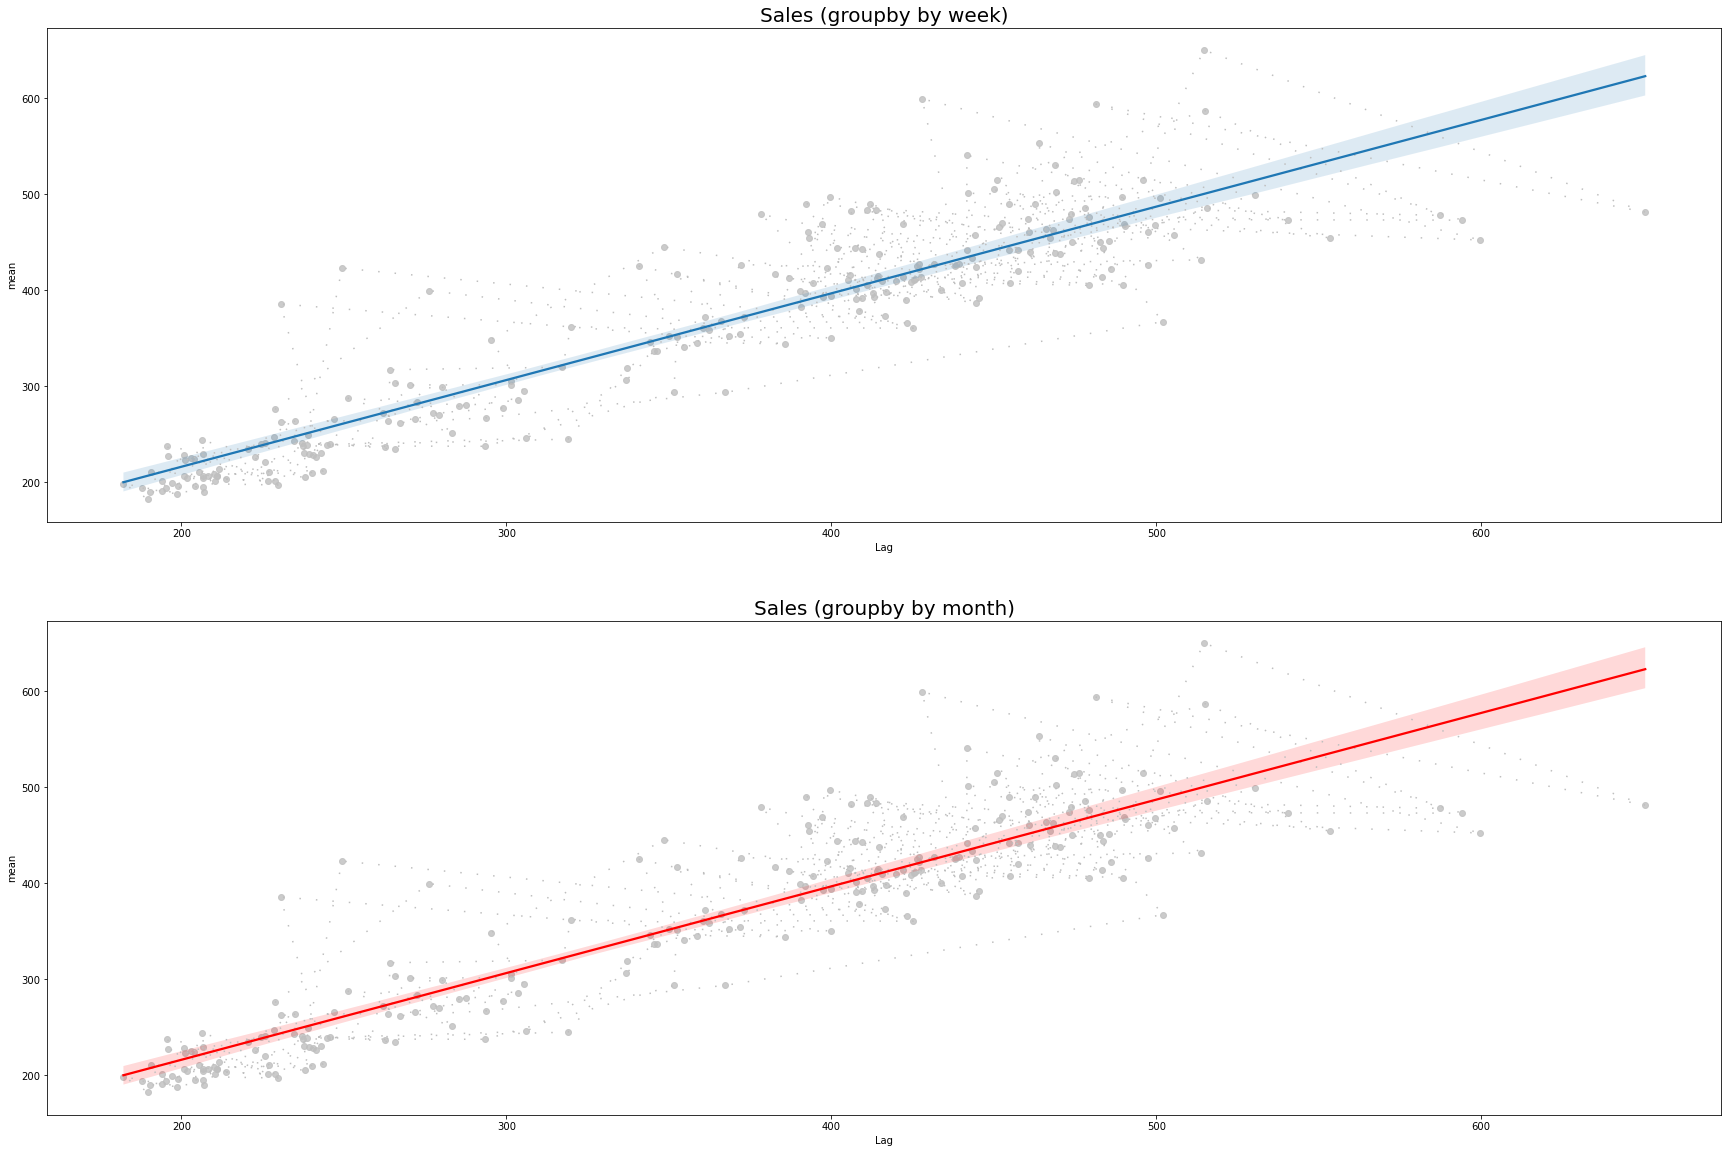
基于不同属性个数value_counts
def plot_stats(df, col, ax, color, angle):
    # 统计数量
    count_classes = df[col].value_counts()

    ax = sns.barplot(x=count_classes.index,
                     y=count_classes,
                     ax=ax,
                     palette=color)
    # 标题
    ax.set_title(col.upper(), fontsize=18)
    # 设置x轴旋转角度
    for tick in ax.get_xticklabels():
        tick.set_rotation(angle)
基于holidays
fig, axes = plt.subplots(nrows=1,
                         ncols=2,
                         figsize=(15,5))
fig.autofmt_xdate()
fig.suptitle("Stats of df_holidays".upper())
plot_stats(holidays, "type", axes[0], "pastel", 45)
plot_stats(holidays, "locale", axes[1], "rocket", 45)
plt.show()
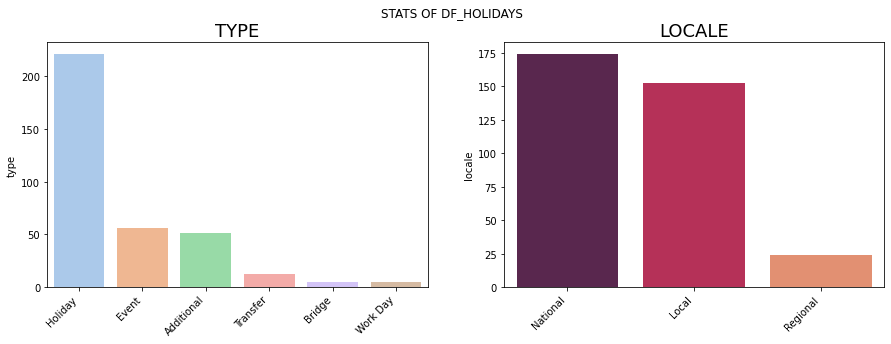
基于stores
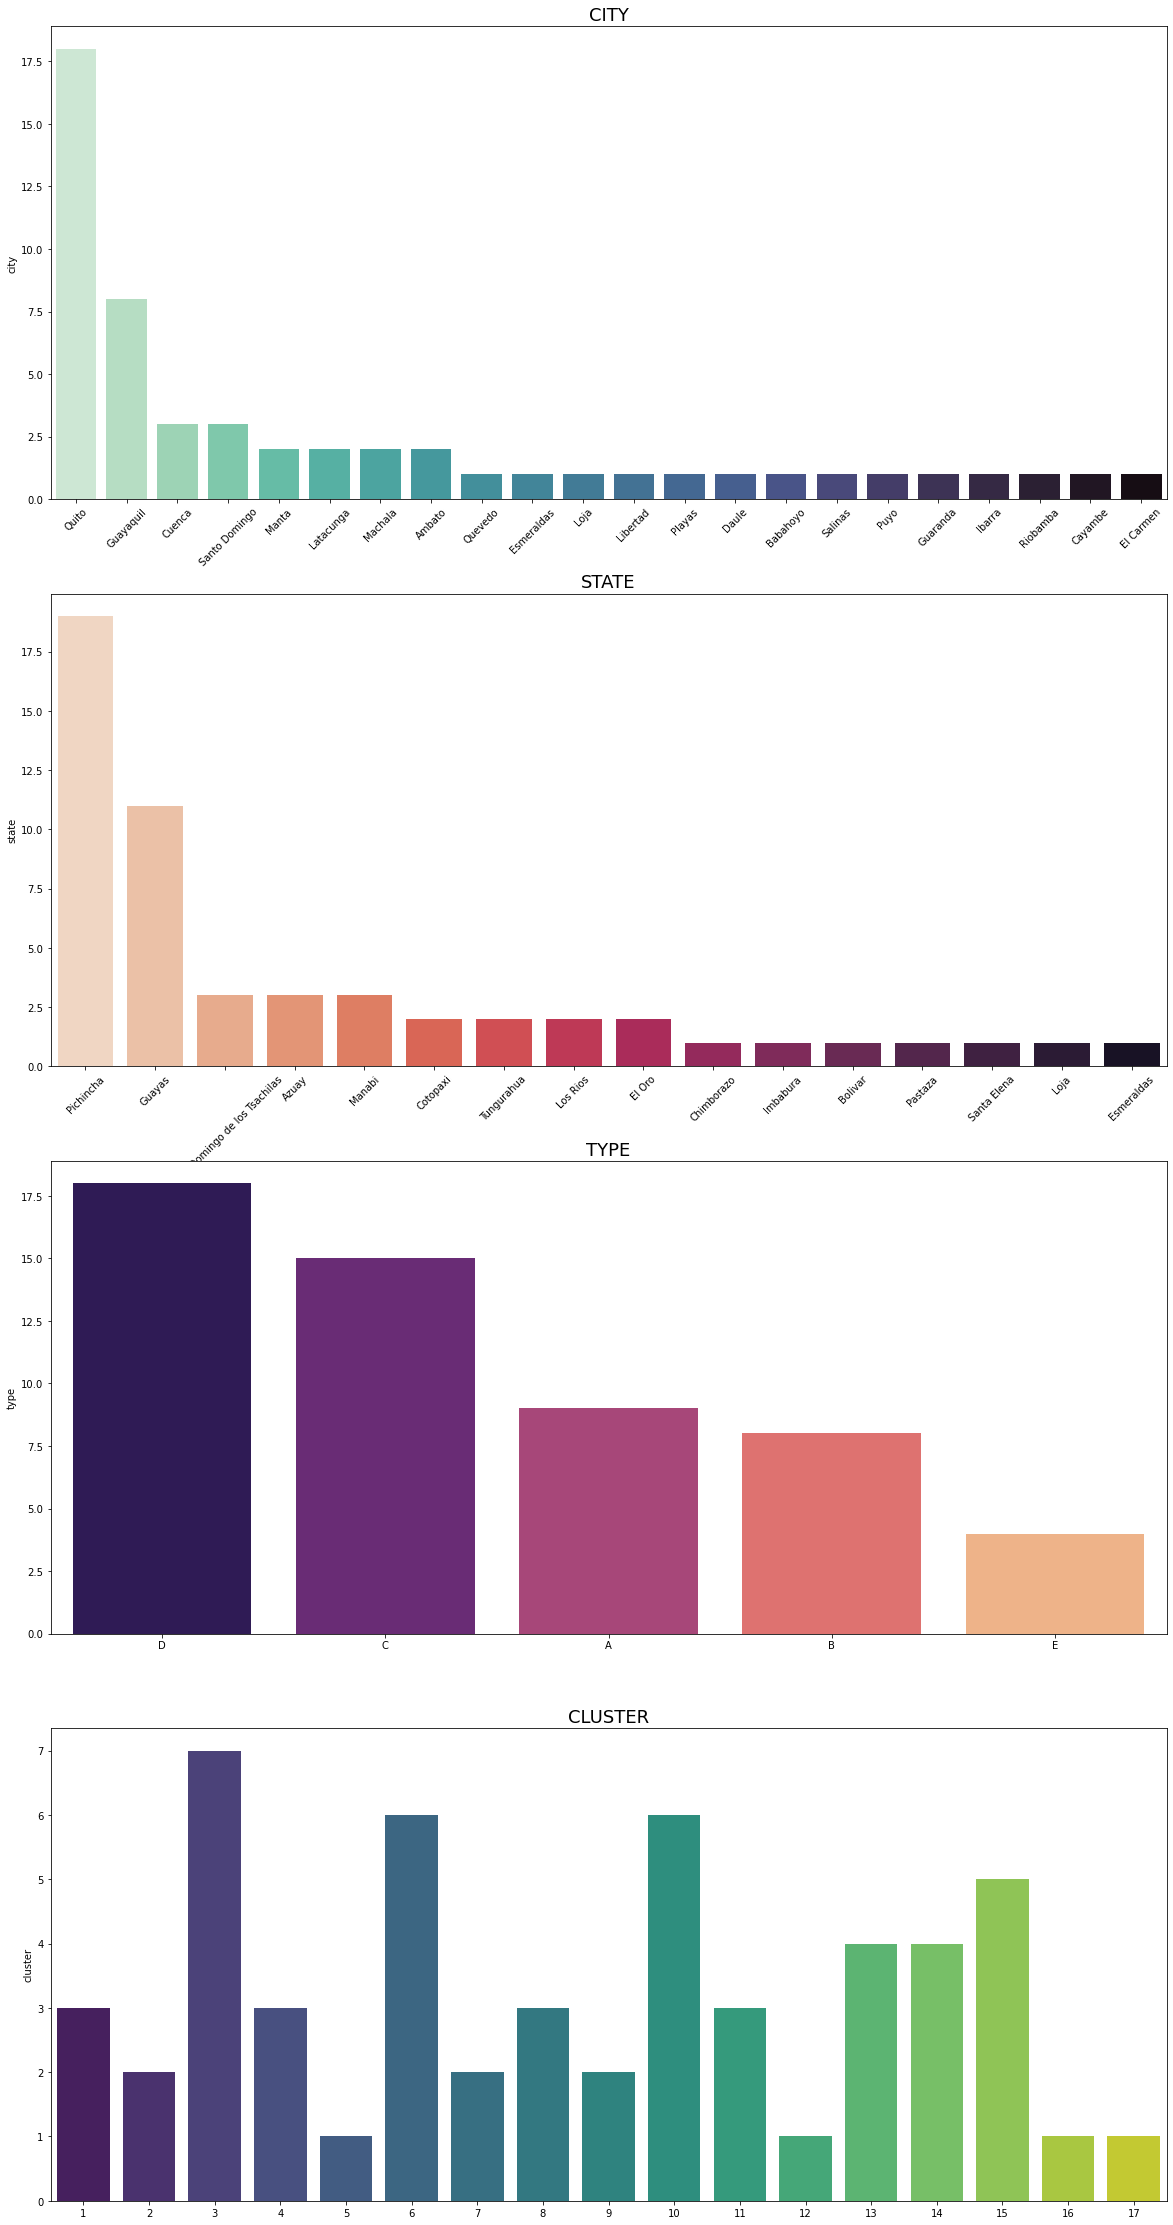
统计在不同city、state、type和cluster下的stores数量
fig, axes = plt.subplots(nrows=4, ncols=1, figsize=(20,40))

plot_stats(stores, "city", axes[0], "mako_r", 45)
plot_stats(stores, "state", axes[1], "rocket_r", 45)
plot_stats(stores, "type", axes[2], "magma", 0)
plot_stats(stores, "cluster", axes[3], "viridis", 0)
plt.show()
基于train
统计在不同family下的数量
fig, axes = plt.subplots(nrows=1, ncols=1, figsize=(20,10))
count_classes = train['family'].value_counts()
print("count_classes: \n", count_classes)

plt.title("Stats of train")
colors = ['#ff9999','#66b3ff','#99ff99',
          '#ffcc99', '#ffccf9', '#ff99f8',
          '#ff99af', '#ffe299', '#a8ff99',
          '#cc99ff', '#9e99ff', '#99c9ff',
          '#99f5ff', '#99ffe4', '#99ffaf']

plt.pie(count_classes,
        labels = count_classes.index,
        autopct='%1.1f%%',
        shadow=True,
        startangle=90,
        colors=colors)

plt.show()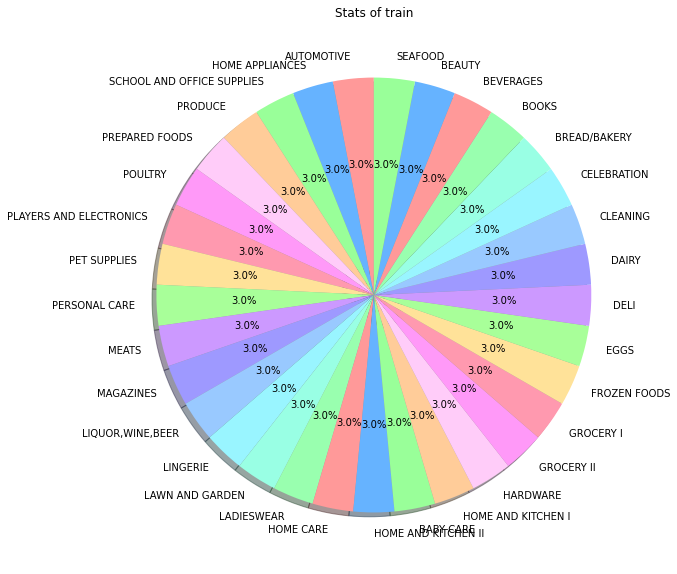
数据分布区间对比
构造绘图函数-箱型图BoxPlot
def plot_boxplot(palette,x,y,hue,ax,title):
    # 设置主题
    sns.set_theme(style="ticks",palette=palette)
    # 绘图
    ax = sns.boxplot(x=x,y=y,hue=hue,ax=ax)
    # 设置标题和字体大小
    ax.set_title(title,fontsize=18)
oil数据
fig, axes = plt.subplots(nrows=2, ncols=1, figsize=(10,20))

plot_boxplot("pastel", oil['date'].dt.year, oil['dcoilwtico'], oil['date'].dt.month, axes[0], "oil")
plot_boxplot("pastel", oil['date'].dt.year, oil['dcoilwtico'], oil['date'].dt.year, axes[1], "oil")
plt.show()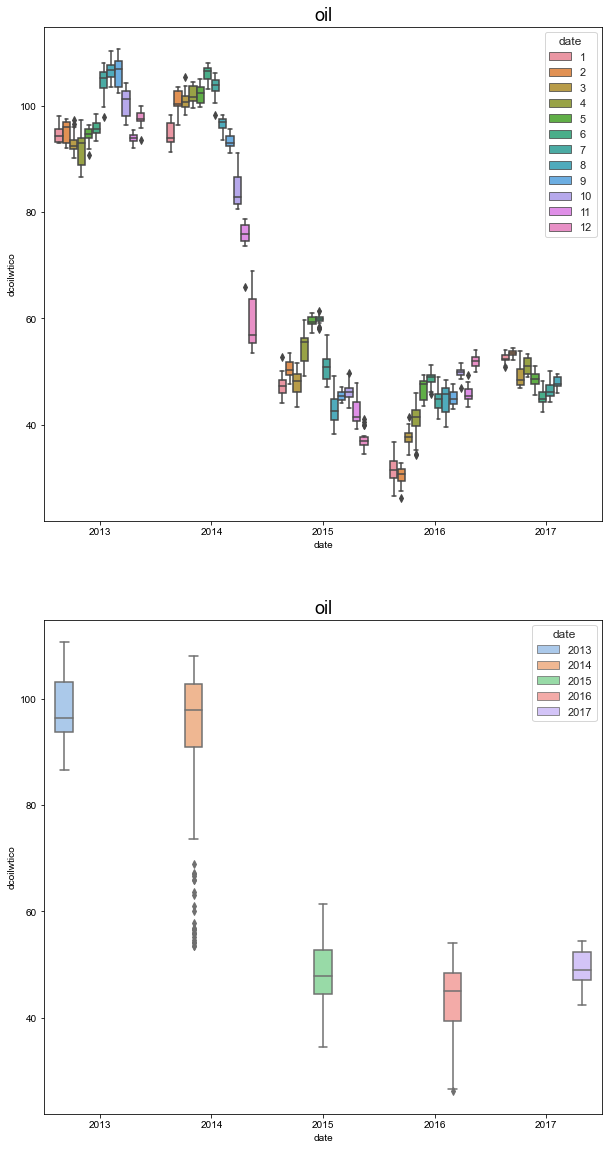
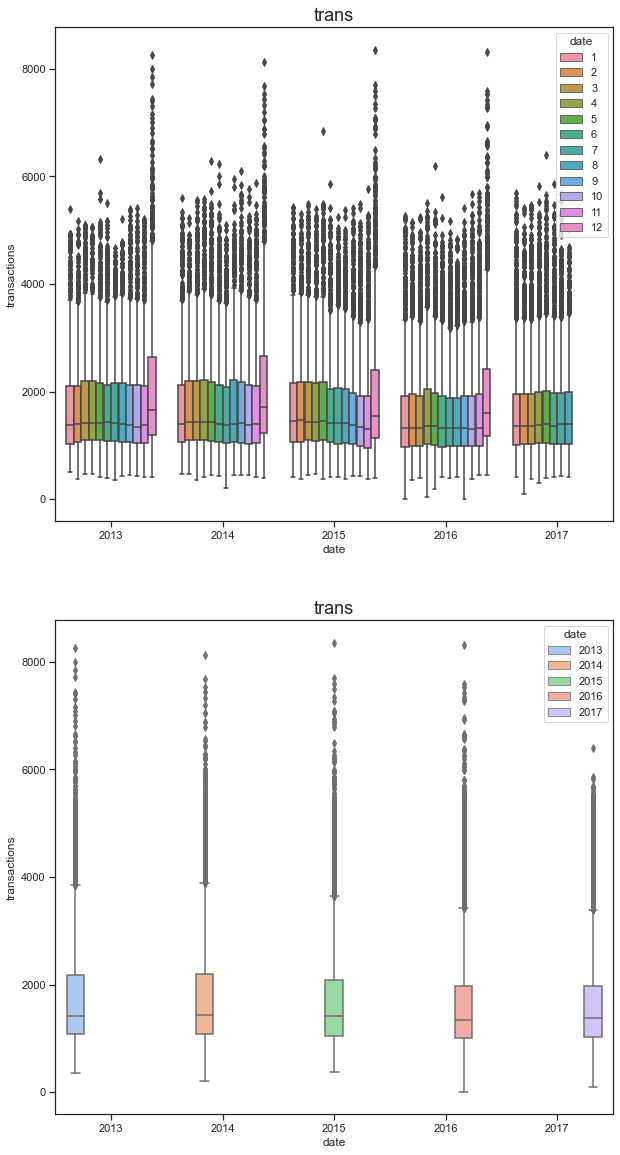
trans数据
fig, axes = plt.subplots(nrows=2, ncols=1, figsize=(10,20))

plot_boxplot("pastel", trans['date'].dt.year, trans['transactions'], trans['date'].dt.month, axes[0], "trans")
plot_boxplot("pastel", trans['date'].dt.year, trans['transactions'], trans['date'].dt.year, axes[1], "trans")
plt.show()
趋势变化 & 移动平均
如何理解移动平均?
结合之前构造grouped函数进行理解
# 0-定义分组统计函数-grouped

def grouped(df, key, freq, col):
    """
    定义分组统计均值的函数
    """
    df_groupby = df.groupby([pd.Grouper(key=key,freq=freq)]).agg(mean=(col,'mean'))
    df_groupby = df_groupby.reset_index()
return df_groupby# 1、groupby函数直接统计-以train数据为例
train.head().dataframe tbody tr th:only-of-type { vertical-align: middle; } <pre><code>.dataframe tbody tr th { vertical-align: top; } .dataframe thead th { text-align: right; } </code></pre>
id | date | store_nbr | family | sales | onpromotion | |
|---|---|---|---|---|---|---|
0 | 0 | 2013-01-01 | 1 | AUTOMOTIVE | 0.0 | 0 |
1 | 1 | 2013-01-01 | 1 | BABY CARE | 0.0 | 0 |
2 | 2 | 2013-01-01 | 1 | BEAUTY | 0.0 | 0 |
3 | 3 | 2013-01-01 | 1 | BEVERAGES | 0.0 | 0 |
4 | 4 | 2013-01-01 | 1 | BOOKS | 0.0 | 0 |
# 2、直接统计:基于date和W进行统计sales的均值

train_groupby = train.groupby([pd.Grouper(key="date",freq="W")]).agg(mean=("sales",'mean'))
train_groupby = train_groupby.reset_index()
train_groupby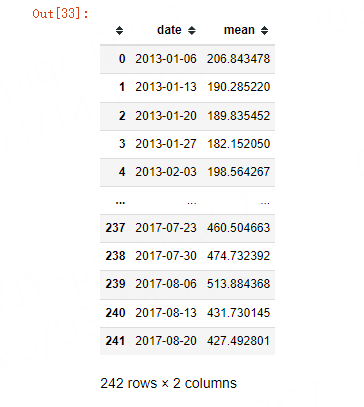
可以看到上面的日期是以周进行统计的。
train_groupby.head(10).dataframe tbody tr th:only-of-type { vertical-align: middle; } <pre><code>.dataframe tbody tr th { vertical-align: top; } .dataframe thead th { text-align: right; } </code></pre>
date | mean | |
|---|---|---|
0 | 2013-01-06 | 206.843478 |
1 | 2013-01-13 | 190.285220 |
2 | 2013-01-20 | 189.835452 |
3 | 2013-01-27 | 182.152050 |
4 | 2013-02-03 | 198.564267 |
5 | 2013-02-10 | 187.788172 |
6 | 2013-02-17 | 194.052318 |
7 | 2013-02-24 | 190.572470 |
8 | 2013-03-03 | 210.889059 |
9 | 2013-03-10 | 206.540301 |
# 3、加上移动平均功能
# center 表示以当前元素为中心进行统计
# min_periods表示窗口的最小观测值个数

# 一个窗口周期内至少要有4天的数据;前面3天不满足,均为NaN
train_groupby.rolling(window=7,min_periods=4).mean()
.dataframe tbody tr th:only-of-type { vertical-align: middle; } <pre><code>.dataframe tbody tr th { vertical-align: top; } .dataframe thead th { text-align: right; } </code></pre>
mean | |
|---|---|
0 | NaN |
1 | NaN |
2 | NaN |
3 | 192.279050 |
4 | 193.536094 |
... | ... |
237 | 476.977266 |
238 | 473.438121 |
239 | 479.967617 |
240 | 475.546673 |
241 | 466.683298 |
242 rows × 1 columns
如何理解参数center?以当前的元素为中心,上下筛选数据:
# 如何理解参数center

train_groupby.rolling(window=7,center=True,min_periods=4).mean()
.dataframe tbody tr th:only-of-type { vertical-align: middle; } <pre><code>.dataframe tbody tr th { vertical-align: top; } .dataframe thead th { text-align: right; } </code></pre>
mean | |
|---|---|
0 | 192.279050 |
1 | 193.536094 |
2 | 192.578107 |
3 | 192.788708 |
4 | 190.464279 |
... | ... |
237 | 475.546673 |
238 | 466.683298 |
239 | 461.530692 |
240 | 461.668874 |
241 | 461.959927 |
242 rows × 1 columns
如何理解上面的结果呢?
# 3+中心+3

# 第一个元素前面没有数据,只能从本身向后取数据:0(中心) + 3----->[0:4]

train_groupby.iloc[:4,1].sum() / 4192.27905005901843# 第二个元素为中心:0+1(中心)+2/3/4----->[0:5]
train_groupby.iloc[0:5,1].sum() / 5193.5360935220985# 第三个元素为中心:0/1 + 2(中心)+3/4/5----->[0:6]
train_groupby.iloc[0:6, 1].sum() / 6192.57810663810037# 第四个元素为中心:0/1/2 + 3(中心)+4/5/6----->[0:7]
train_groupby.iloc[0:7, 1].sum() / 7192.7887082607605构造移动平均绘图函数
def plot_moving_average(df,key,freq,col,window,min_periods,ax,title):
    df_groupby = grouped(df,key,freq,col)
    moving_average = df_groupby["mean"].rolling(window=window,
                                                center=True,
                                                min_periods=min_periods).mean()
#     print("moving_average: \n", moving_average)

    ax = df_groupby["mean"].plot(color="0.75",linestyle="dashdot",ax=ax)
    ax = moving_average.plot(linewidth=3,color="g",ax=ax)
    ax.set_title(title,fontsize=18)
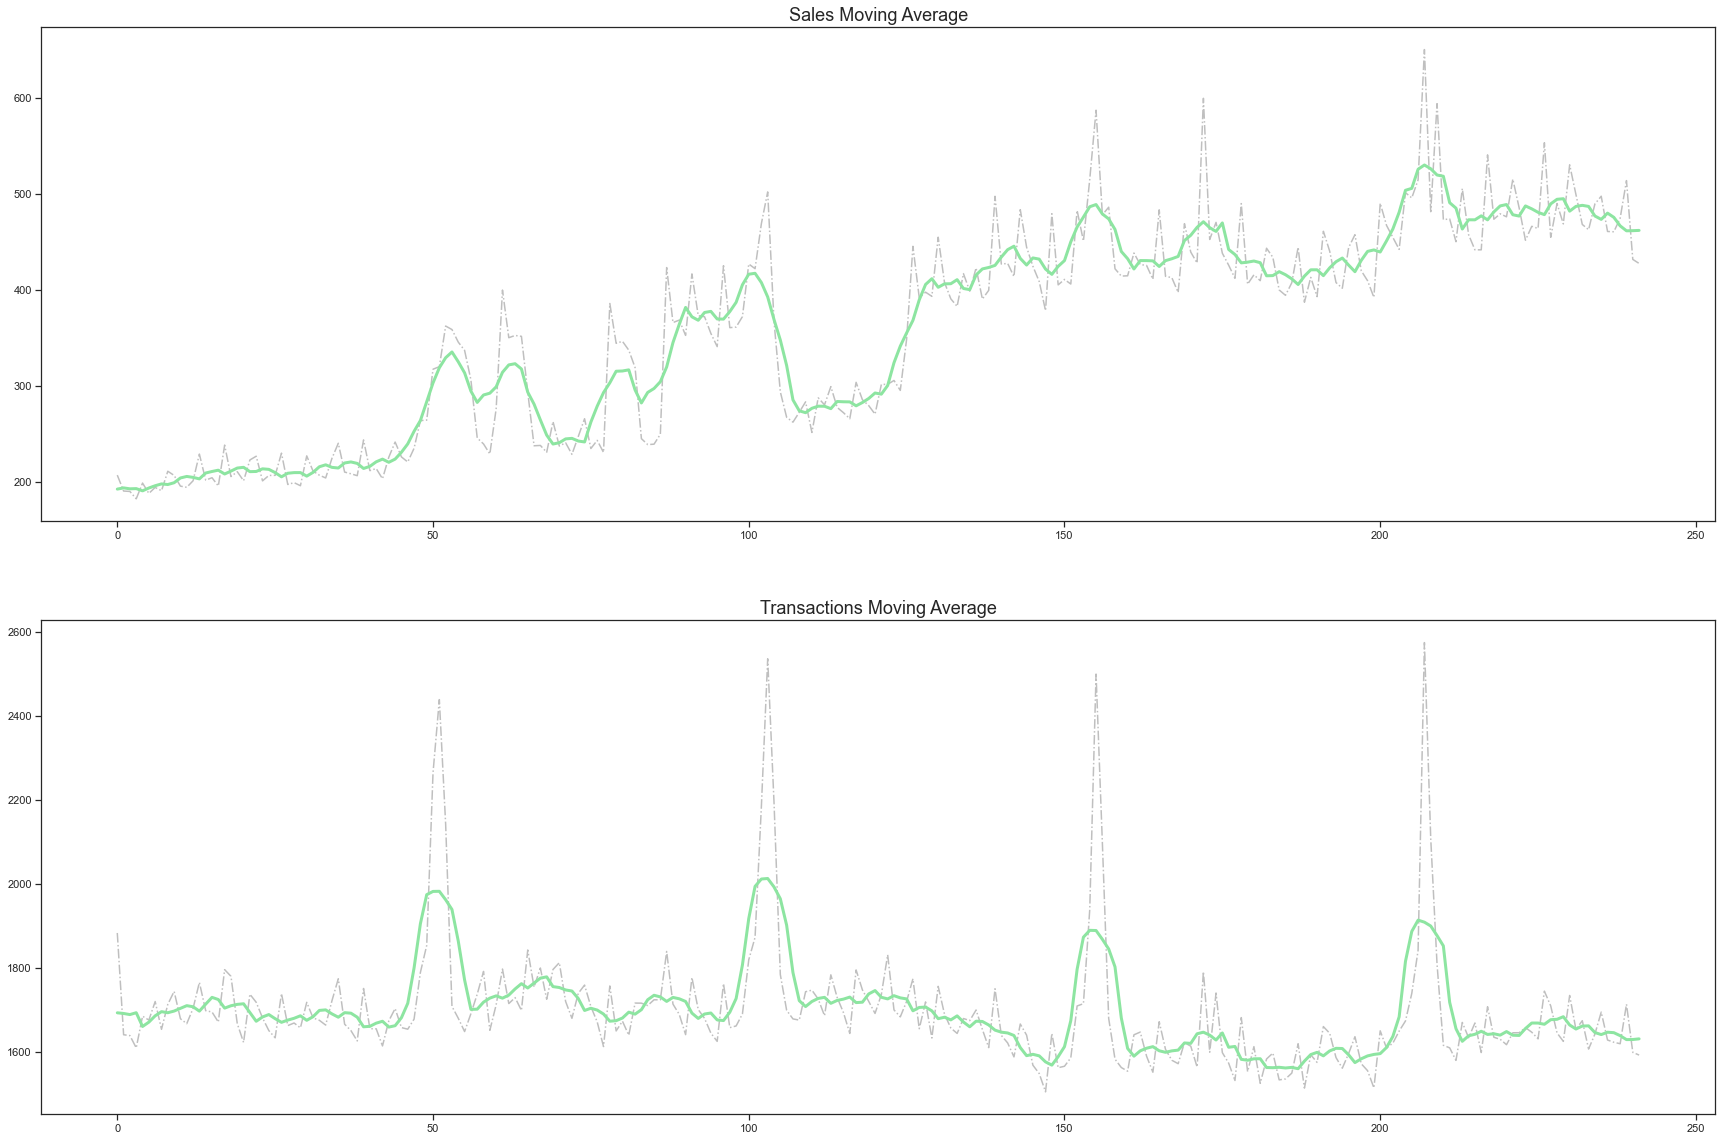
可视化绘图
fig, axes = plt.subplots(nrows=2,
                         ncols=1,
                         figsize=(30,20))

# 基于train和trans数据
plot_moving_average(train, 'date', 'W', 'sales', 7, 4, axes[0], 'Sales Moving Average')
plot_moving_average(trans, 'date', 'W', 'transactions', 7, 4, axes[1], 'Transactions Moving Average')

plt.show()
趋势预测
构造函数
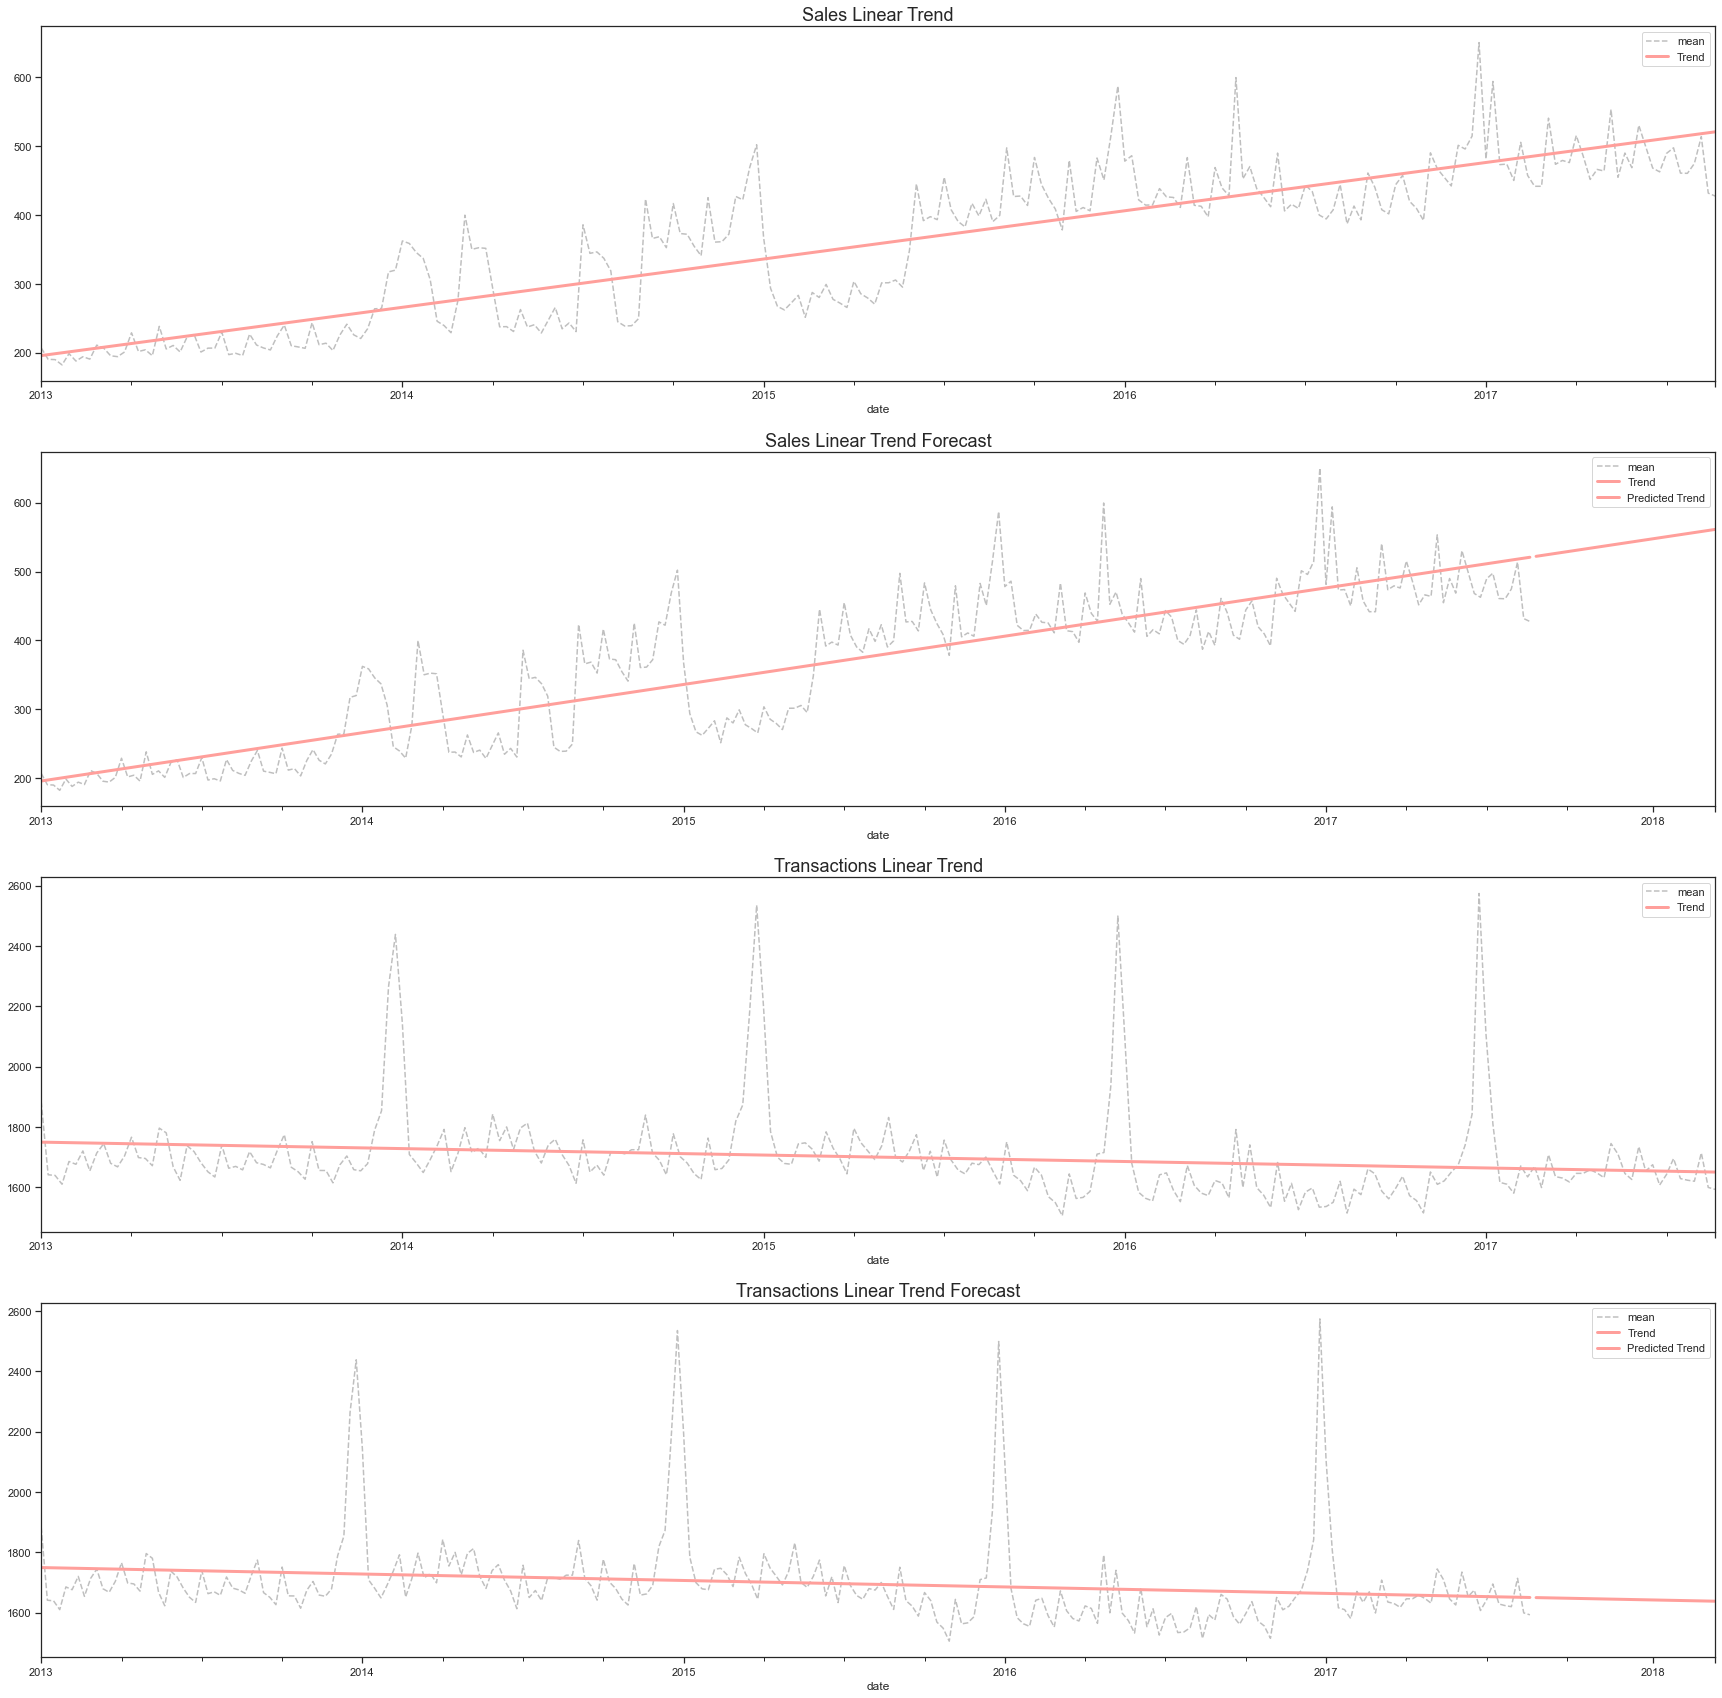
基于statsmodels库的DeterministicProcess类进行线性回归预测
def plot_deterministic_process(df, key, freq, col, ax1, title1, ax2, title2):
    # 分组统计
    df_groupby = grouped(df, key, freq, col)
    df_groupby["date"] = pd.to_datetime(df_groupby["date"],format="%Y-%m-%d")

    dp = DeterministicProcess(index=df_groupby["date"],
                              constant=True,
                              order=1,
                              drop=True)
    # 将频率设置成索引
    dp.index.freq = freq

    X1 = dp.in_sample()   # 属性特征X
    y1 = df_groupby["mean"]  # 待预测的目标值y
    y1.index = X1.index
    # 实例化类
    model = LinearRegression(fit_intercept=False)
    model.fit(X1, y1)

    # 预测结果
    y1_pred = pd.Series(model.predict(X1), index=X1.index)

    ax1 = y1.plot(linestyle='dashed', label="mean", color="0.75", ax=ax1, use_index=True)
    ax1 = y1_pred.plot(linewidth=3, label="Trend", color='r', ax=ax1, use_index=True)
    # 设置标题
    ax1.set_title(title1, fontsize=18)
    _ = ax1.legend()


    # 预测未来30个步长的数据
    steps = 30
    X2 = dp.out_of_sample(steps=steps)
    y2_fore = pd.Series(model.predict(X2), index=X2.index)

    ax2 = y1.plot(linestyle='dashed', label="mean", color="0.75", ax=ax2, use_index=True)
    ax2 = y1_pred.plot(linewidth=3, label="Trend", color='r', ax=ax2, use_index=True)
    ax2 = y2_fore.plot(linewidth=3, label="Predicted Trend", color='r', ax=ax2, use_index=True)
    ax2.set_title(title2, fontsize=18)
    _ = ax2.legend()
数据可视化
fig, axes = plt.subplots(nrows=4, ncols=1, figsize=(30,30))

plot_deterministic_process(train, 'date', 'W', 'sales',
                           axes[0], "Sales Linear Trend",
                           axes[1], "Sales Linear Trend Forecast")
plot_deterministic_process(trans, 'date', 'W', 'transactions',
                           axes[2], "Transactions Linear Trend",
                           axes[3], "Transactions Linear Trend Forecast")

plt.show()
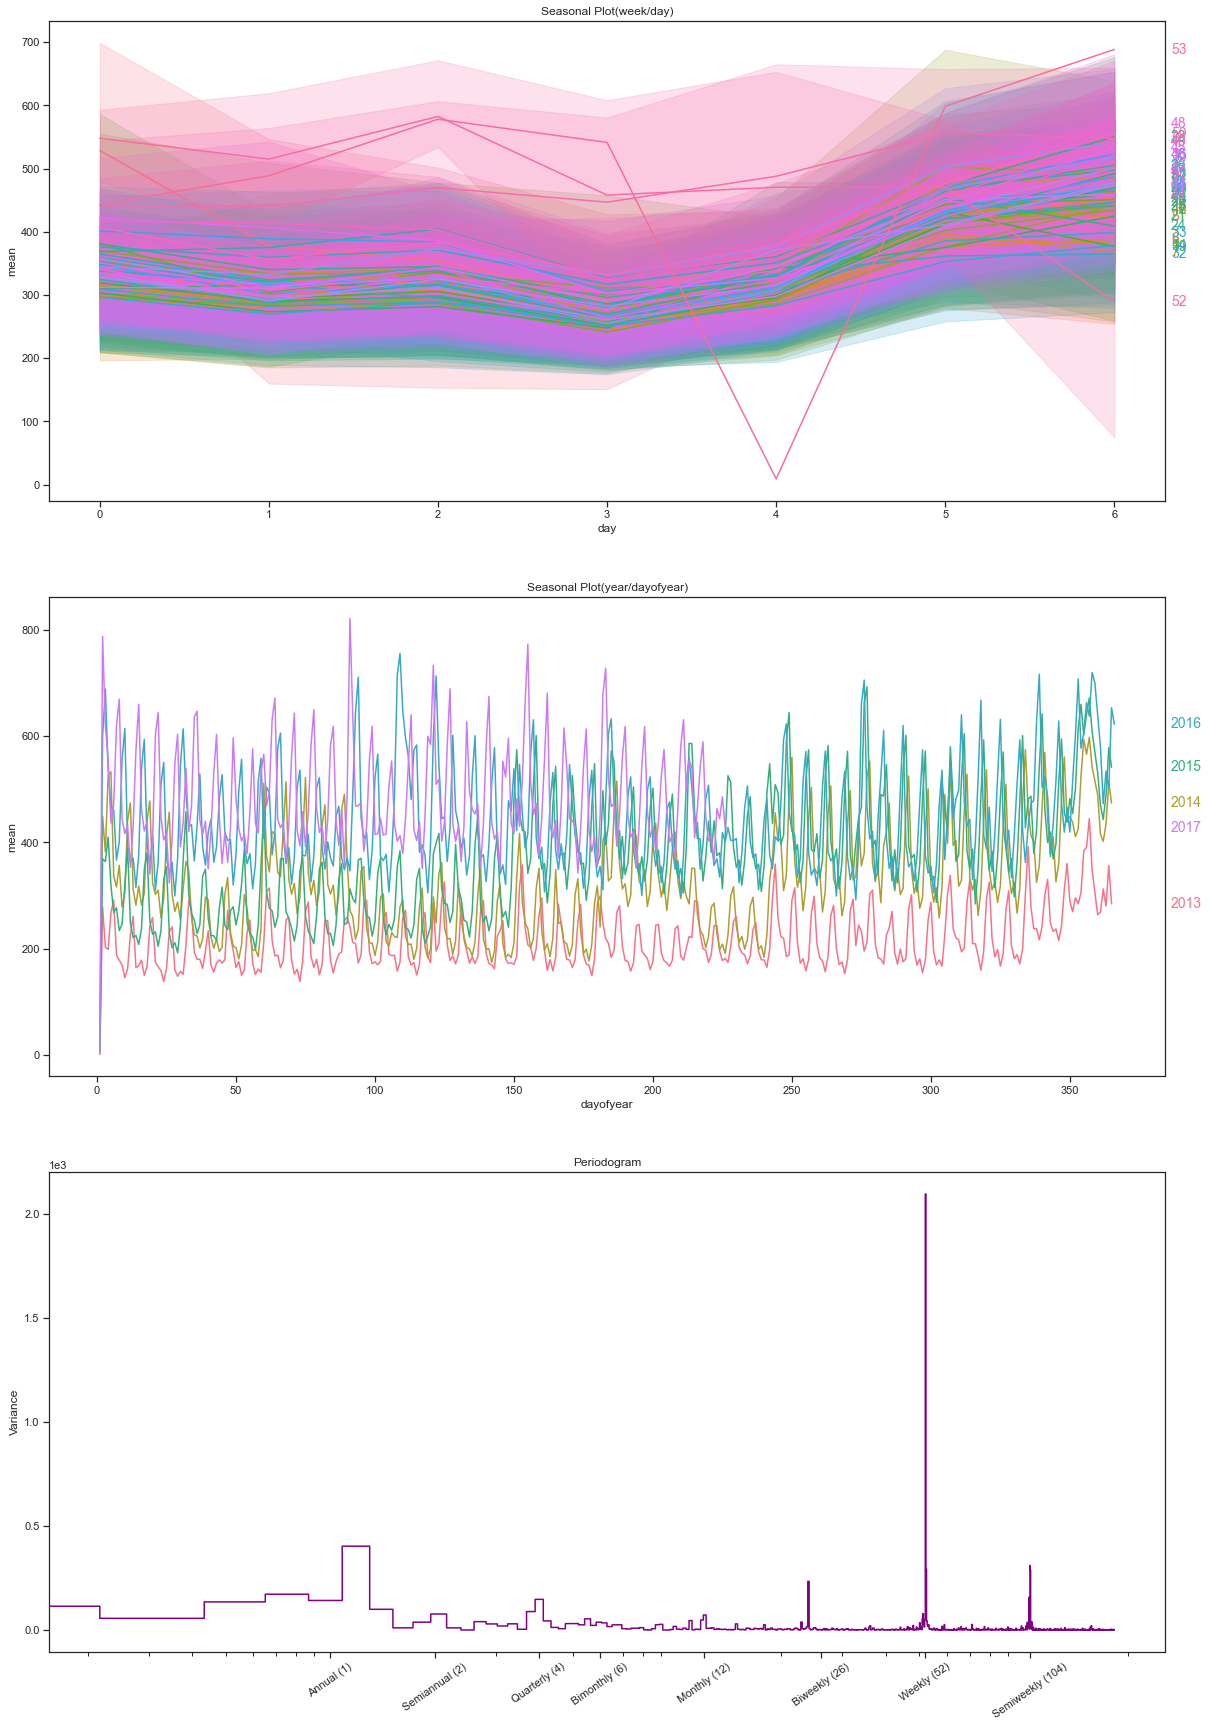
季节性趋势
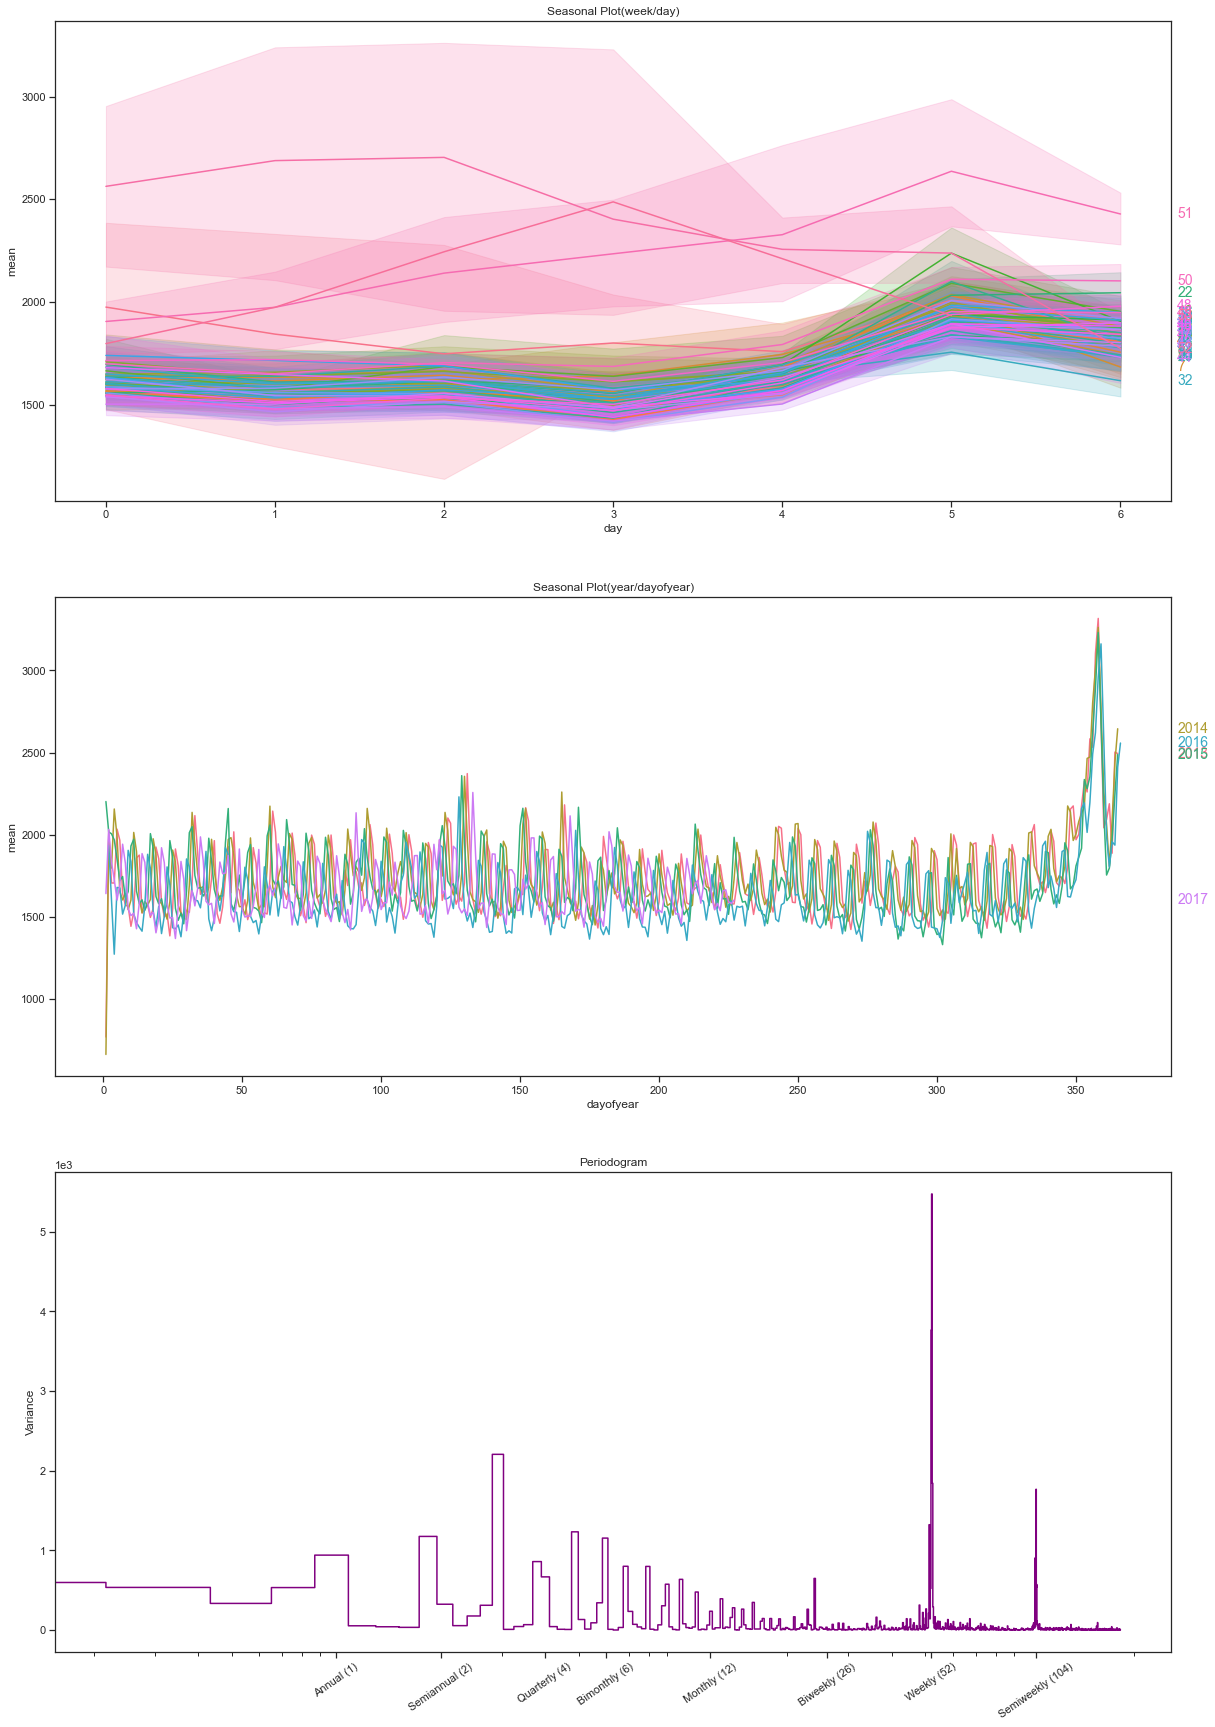
构造季节性绘图函数
def seasonal_plot(X,y,period,freq,ax=None):
    """
    seasonal_plot函数
    """
    if ax is None:
        _, ax = plot.subplots()

    # 颜色设置
    palette = sns.color_palette("husl", n_colors=X[period].nunique(),)

    ax = sns.lineplot(x=X[freq],
                     y=X[y],
                     ax=ax,
                     hue=X[period],
                     palette=palette,
                     legend=False)
    # 标题设置
    ax.set_title(f'Seasonal Plot({period}/{freq})')

    for line, name in zip(ax.lines, X[period].unique()):
        y_ = line.get_ydata()[-1]
        ax.annotate(name,
                   xy=(1,y_),
                   xytext=(6,0),
                   color=line.get_color(),
                   xycoords=ax.get_yaxis_transform(),
                   textcoords="offset points",
                   size=14,
                   va="center")

return axdef plot_periodogram(ts, detrend="linear", ax=None):
"""
plot_periodogram函数:基于周期的直方图
"""
from scipy.signal import periodogram # 导入模块
fs = pd.Timedelta("365D") / pd.Timedelta("1D")
freqencies, spectrum = periodogram(ts,
fs=fs,
detrend=detrend,
window="boxcar",
scaling="spectrum")
if ax is None:
_, ax = plt.subplots()
ax.step(freqencies, spectrum, color="purple")
ax.set_xscale("log")
ax.set_xticks([1, 2, 4, 6, 12, 26, 52, 104])
ax.set_xticklabels(["Annual (1)", "Semiannual (2)", "Quarterly (4)",
"Bimonthly (6)", "Monthly (12)", "Biweekly (26)",
"Weekly (52)", "Semiweekly (104)"], rotation=35)
ax.ticklabel_format(axis="y", style="sci", scilimits=(0, 0))
ax.set_ylabel("Variance")
ax.set_title("Periodogram")
return axdef seasonality(df, key, freq, col):
"""
seasonality函数:调用seasonal_plot 和 plot_periodogram函数
"""
df_groupby = grouped(df, key, freq, col) # 调用grouped函数
df_groupby['date'] = pd.to_datetime(df_groupby['date'], format = "%Y-%m-%d")
df_groupby.index = df_groupby['date'] # 索引设置
df_groupby = df_groupby.drop(columns=['date']) # 删除date列
df_groupby.index.freq = freq # 索引设置成频率
X = df_groupby.copy() # 副本
X.index = pd.to_datetime(X.index, format = "%Y-%m-%d")
X.index.freq = freq # 索引设置成频率
# 一周中的第几天
X["day"] = X.index.dayofweek
X["week"] = pd.Int64Index(X.index.isocalendar().week)
# 一年中的第几天
X["dayofyear"] = X.index.dayofyear
X["year"] = X.index.year
fig, (ax0, ax1, ax2) = plt.subplots(3, 1, figsize=(20, 30))
# 调用seasonal_plot函数
seasonal_plot(X, y='mean', period="week", freq="day", ax=ax0) # 周期按照week
seasonal_plot(X, y='mean', period="year", freq="dayofyear", ax=ax1) # 周期按照year
X_new = (X['mean'].copy()).dropna()
# 调用plot_periodogram函数
plot_periodogram(X_new, ax=ax2)数据可视化-trans
seasonality(trans, 'date', 'D', 'transactions')
数据可视化-train
seasonality(train, 'date', 'D', 'sales')
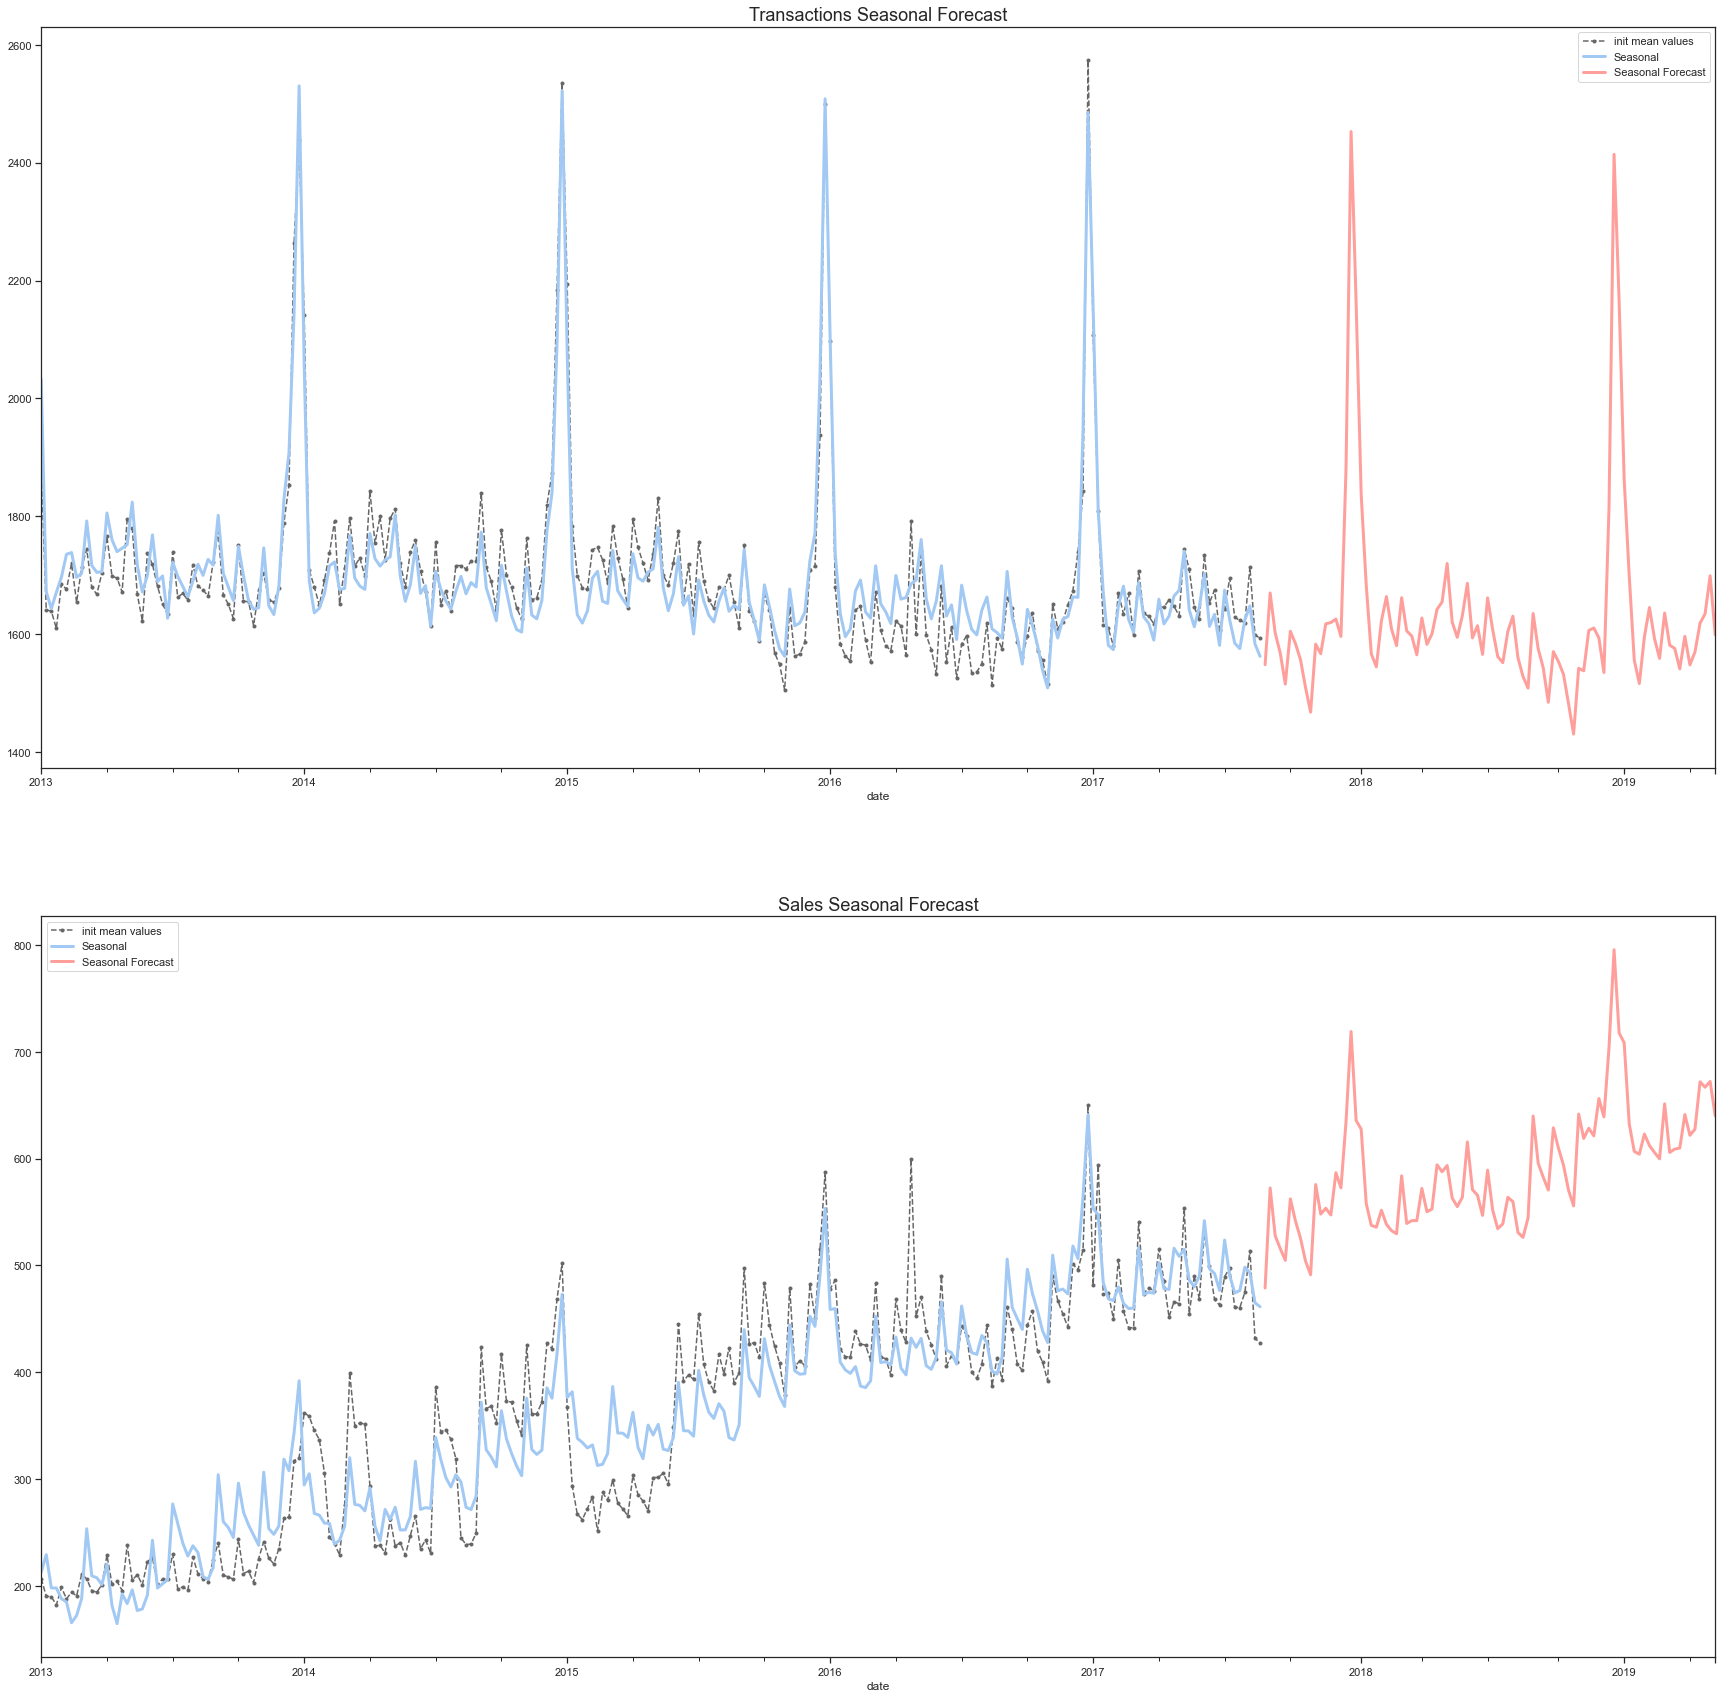
季节性预测
构造预测函数
def predict_seasonality(df, key, freq, col, ax1, title1):
    fourier = CalendarFourier(freq="A", order=10)
    df_groupby = grouped(df,key,freq,col)

    # 时间格式转化
    df_groupby['date'] = pd.to_datetime(df_groupby['date'], format = "%Y-%m-%d")
    # 频率设置
    df_groupby['date'].freq = freq

    dp = DeterministicProcess(index=df_groupby["date"],
                             constant=True,
                             order=1,
                             period=None,
                             seasonal=True,
                             additional_terms=[fourier],
                             drop=True)

    dp.index.freq = freq

    # X-y
    X1 = dp.in_sample()
    y1 = df_groupby["mean"]
    y1.index = X1.index

    # 线性回归模型实例化
    model = LinearRegression(fit_intercept=False)
    model.fit(X1, y1)
    # 模型预测
    y1_pred = pd.Series(model.predict(X1), index=X1.index)
    X1_fore = dp.out_of_sample(steps=90)
    y1_fore = pd.Series(model.predict(X1_fore), index=X1_fore.index)
    # 绘图
    ax1 = y1.plot(linestyle='dashed', style='.', label="init mean values", color="0.4", ax=ax1, use_index=True)
    ax1 = y1_pred.plot(linewidth=3, label="Seasonal", color='b', ax=ax1, use_index=True)
    ax1 = y1_fore.plot(linewidth=3, label="Seasonal Forecast", color='r', ax=ax1, use_index=True)
    # 标题
    ax1.set_title(title1, fontsize=18)
    _ = ax1.legend()
季节预测可视化
fig, axes = plt.subplots(nrows=2, ncols=1, figsize=(30,30))

predict_seasonality(trans, 'date', 'W', 'transactions', axes[0], "Transactions Seasonal Forecast")
predict_seasonality(train, 'date', 'W', 'sales', axes[1], "Sales Seasonal Forecast")
plt.show()
时序预测
构造时序数据
基于train数据构造时序特征:
store_sales = train.copy() # copy副本

store_sales["date"] = store_sales.date.dt.to_period("D")  # 提取日期D
store_sales = store_sales.set_index(["store_nbr","family","date"]).sort_index()  # 设置双层索引
store_sales.head()
.dataframe tbody tr th:only-of-type { vertical-align: middle; } <pre><code>.dataframe tbody tr th { vertical-align: top; } .dataframe thead th { text-align: right; } </code></pre>
id | sales | onpromotion | |||
|---|---|---|---|---|---|
store_nbr | family | date | |||
1 | AUTOMOTIVE | 2013-01-01 | 0 | 0.0 | 0 |
2013-01-02 | 1782 | 2.0 | 0 | ||
2013-01-03 | 3564 | 3.0 | 0 | ||
2013-01-04 | 5346 | 3.0 | 0 | ||
2013-01-05 | 7128 | 5.0 | 0 |
family_sales = (
    store_sales  # 数据df
    .groupby(['family', 'date'])  # 分组对象
    .mean()   # 统计函数
    .unstack('family')  # 反堆叠对象
    .loc['2017', ['sales', 'onpromotion']]  # 位置索引
)

family_sales.head()
.dataframe tbody tr th:only-of-type { vertical-align: middle; } <pre><code>.dataframe tbody tr th { vertical-align: top; } .dataframe thead tr th { text-align: left; } .dataframe thead tr:last-of-type th { text-align: right; } </code></pre>
sales | ... | onpromotion | |||||||||||||||||||
|---|---|---|---|---|---|---|---|---|---|---|---|---|---|---|---|---|---|---|---|---|---|
family | AUTOMOTIVE | BABY CARE | BEAUTY | BEVERAGES | BOOKS | BREAD/BAKERY | CELEBRATION | CLEANING | DAIRY | DELI | ... | MAGAZINES | MEATS | PERSONAL CARE | PET SUPPLIES | PLAYERS AND ELECTRONICS | POULTRY | PREPARED FOODS | PRODUCE | SCHOOL AND OFFICE SUPPLIES | SEAFOOD |
date | |||||||||||||||||||||
2017-01-01 | 0.092593 | 0.037037 | 0.055556 | 74.222222 | 0.000000 | 9.084685 | 0.129630 | 7.500000 | 11.518519 | 3.629167 | ... | 0.0 | 0.018519 | 0.111111 | 0.018519 | 0.0 | 0.000000 | 0.037037 | 0.129630 | 0.0 | 0.000000 |
2017-01-02 | 11.481481 | 0.259259 | 11.648148 | 6208.055556 | 0.481481 | 844.836296 | 14.203704 | 2233.648148 | 1545.000000 | 539.114833 | ... | 0.0 | 0.462963 | 10.592593 | 0.537037 | 0.0 | 0.259259 | 1.166667 | 5.629630 | 0.0 | 0.407407 |
2017-01-03 | 8.296296 | 0.296296 | 7.185185 | 4507.814815 | 0.814815 | 665.124111 | 10.629630 | 1711.907407 | 1204.203704 | 404.300074 | ... | 0.0 | 0.481481 | 9.722222 | 0.444444 | 0.0 | 0.388889 | 1.351852 | 56.296296 | 0.0 | 0.407407 |
2017-01-04 | 6.833333 | 0.333333 | 6.888889 | 3911.833333 | 0.759259 | 594.160611 | 11.185185 | 1508.037037 | 1107.796296 | 309.397685 | ... | 0.0 | 0.370370 | 12.037037 | 0.444444 | 0.0 | 0.296296 | 5.444444 | 101.277778 | 0.0 | 0.333333 |
2017-01-05 | 6.333333 | 0.351852 | 5.925926 | 3258.796296 | 0.407407 | 495.511611 | 12.444444 | 1241.833333 | 829.277778 | 260.776500 | ... | 0.0 | 8.981481 | 5.666667 | 0.000000 | 0.0 | 0.296296 | 0.907407 | 5.018519 | 0.0 | 0.444444 |
5 rows × 66 columns
mag_sales = family_sales.loc(axis=1)[:, 'MAGAZINES']
mag_sales.head(10)
.dataframe tbody tr th:only-of-type { vertical-align: middle; } <pre><code>.dataframe tbody tr th { vertical-align: top; } .dataframe thead tr th { text-align: left; } .dataframe thead tr:last-of-type th { text-align: right; } </code></pre>
sales | onpromotion | |
|---|---|---|
family | MAGAZINES | MAGAZINES |
date | ||
2017-01-01 | 0.074074 | 0.0 |
2017-01-02 | 7.777778 | 0.0 |
2017-01-03 | 3.500000 | 0.0 |
2017-01-04 | 3.500000 | 0.0 |
2017-01-05 | 3.203704 | 0.0 |
2017-01-06 | 2.759259 | 0.0 |
2017-01-07 | 5.962963 | 0.0 |
2017-01-08 | 5.074074 | 0.0 |
2017-01-09 | 3.537037 | 0.0 |
2017-01-10 | 3.222222 | 0.0 |
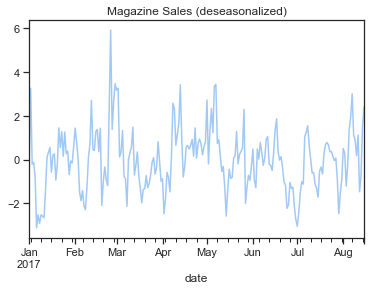
时序特征可视化
y = mag_sales.loc[:,"sales"].squeeze()
ydate
2017-01-01 0.074074
2017-01-02 7.777778
2017-01-03 3.500000
2017-01-04 3.500000
2017-01-05 3.203704
...
2017-08-11 9.259259
2017-08-12 8.944444
2017-08-13 8.685185
2017-08-14 8.462963
2017-08-15 8.537037
Freq: D, Name: MAGAZINES, Length: 227, dtype: float64fourier = CalendarFourier(freq="M", order=4)
dp = DeterministicProcess(constant=True,
index=y.index,
order=1,
seasonal=True,
drop=True,
additional_terms=[fourier]
)
X_time = dp.in_sample()
# 元旦
X_time["NewYearsDay"] = (X_time.index.dayofyear == 1)
model = LinearRegression(fit_intercept=False)
model.fit(X_time,y)
y_deseason = y - model.predict(X_time)
y_deseason.name = "sales_deseasoned"
ax = y_deseason.plot()
ax.set_title("Magazine Sales (deseasonalized)")Text(0.5, 1.0, 'Magazine Sales (deseasonalized)')
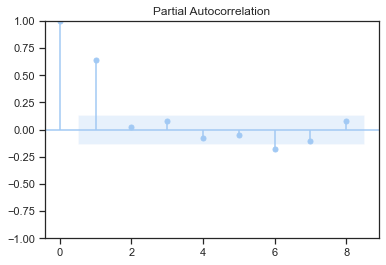
自相关和偏自相关
- 自相关ACF:也叫序列相关,是一个序列于其自身在不同时间点的互相关
- 偏自相关PACF:偏自相关是剔除干扰后时间序列观察与先前时间步长时间序列观察之间关系的总结。
在滞后k处的偏自相关是在消除由于较短滞后条件导致的任何相关性的影响之后产生的相关性。
def lagplot(x, y=None, lag=1, standardize=False, ax=None, **kwargs):
    """
    lagplot函数
    """
    from matplotlib.offsetbox import AnchoredText

    x_ = x.shift(lag)  # 移位函数
    if standardize:  # 数据标准化
        x_ = (x_ - x_.mean()) / x_.std()
    if y is not None:
        y_ = (y - y.mean()) / y.std() if standardize else y
    else:
        y_ = x

    # 相关系数
    corr = y_.corr(x_)
    if ax is None:
        fig, ax = plt.subplots()
    scatter_kws = dict(alpha=0.75,s=3)
    line_kws = dict(color='C3', )
    ax = sns.regplot(x=x_,
                     y=y_,
                     scatter_kws=scatter_kws,
                     line_kws=line_kws,
                     lowess=True,
                     ax=ax,
                     **kwargs)

    at = AnchoredText(f"{corr:.2f}",
                      prop=dict(size="large"),
                      frameon=True,
                      loc="upper left"
                     )

    at.patch.set_boxstyle("square, pad=0.0")
    ax.add_artist(at)
    ax.set(title=f"Lag {lag}", xlabel=x_.name, ylabel=y_.name)
return axdef plot_lags(x, y=None, lags=6, nrows=1, lagplot_kwargs={}, **kwargs):
import math
kwargs.setdefault('nrows', nrows)
kwargs.setdefault('ncols', math.ceil(lags / nrows))
kwargs.setdefault('figsize', (kwargs['ncols'] * 2 + 10, nrows * 2 + 5))
fig, axs = plt.subplots(sharex=True,
sharey=True,
squeeze=False,
**kwargs)
for ax, k in zip(fig.get_axes(), range(kwargs['nrows'] * kwargs['ncols'])):
if k + 1 <= lags:
ax = lagplot(x,
y,
lag=k + 1,
ax=ax,
**lagplot_kwargs)
ax.set_title(f"Lag {k + 1}",
fontdict=dict(fontsize=14))
ax.set(xlabel="", ylabel="")
else:
ax.axis('off')
plt.setp(axs[-1, :], xlabel=x.name)
plt.setp(axs[:, 0], ylabel=y.name if y is not None else x.name)
fig.tight_layout(w_pad=0.1, h_pad=0.1)
return fig自相关可视化
fig = plot_lags(y_deseason, lags=8, nrows=2) # 多行多列数据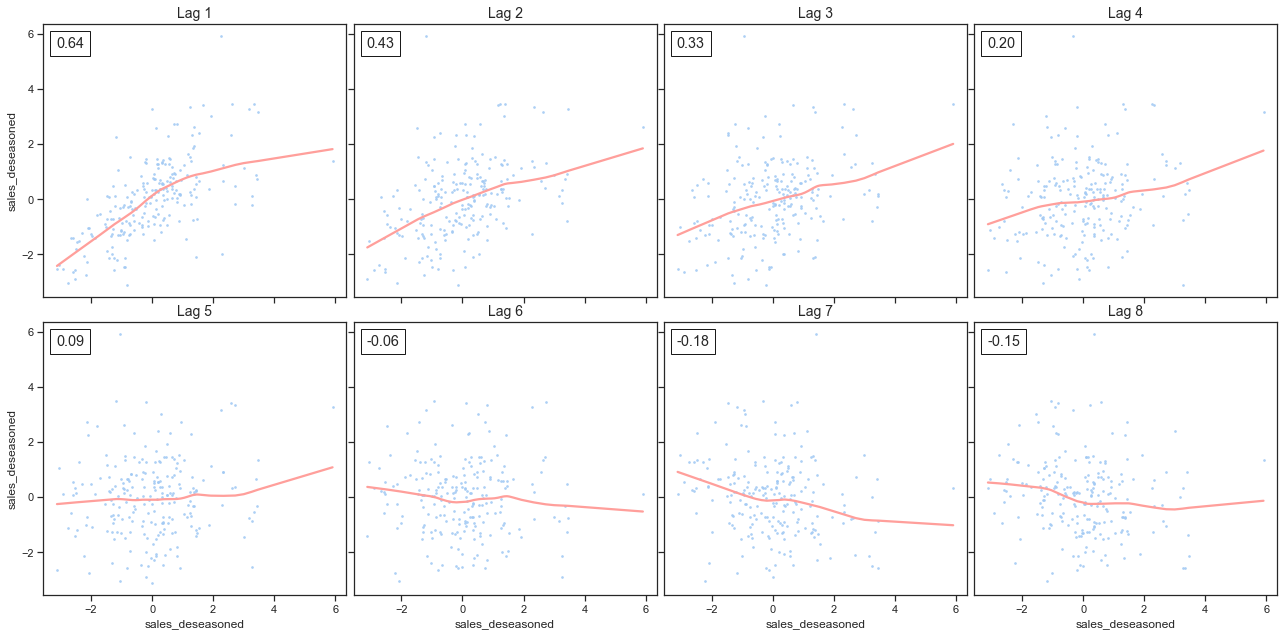
偏自相关可视化
fig = plot_pacf(y_deseason, lags=8) # 一个图形
基于magazine的可视化
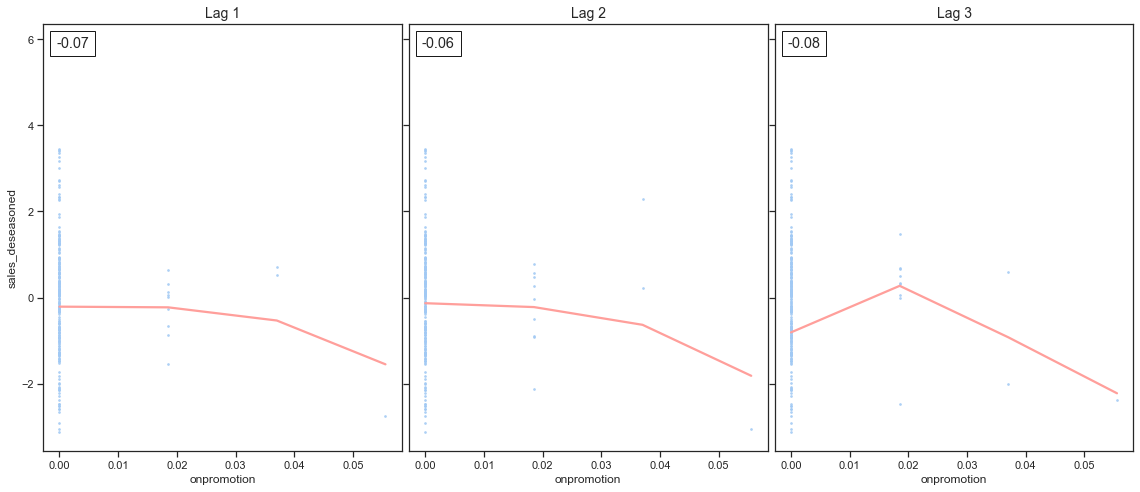
onpromotion = mag_sales.loc[:,'onpromotion'].squeeze().rename('onpromotion')

# 去除离群点:每年的第一天
plot_lags(x=onpromotion.iloc[1:], y=y_deseason.iloc[1:], lags=3, nrows=1)
时序预测可视化
def make_lags(ts, lags):
    return pd.concat(
        {
            f'y_lag_{i}': ts.shift(i)
            for i in range(1, lags + 1)
        },
axis=1)X = make_lags(y_deseason, lags=4)
X = X.fillna(0.0)
X.dataframe tbody tr th:only-of-type { vertical-align: middle; } <pre><code>.dataframe tbody tr th { vertical-align: top; } .dataframe thead th { text-align: right; } </code></pre>
y_lag_1 | y_lag_2 | y_lag_3 | y_lag_4 | |
|---|---|---|---|---|
date | ||||
2017-01-01 | 0.000000e+00 | 0.000000e+00 | 0.000000e+00 | 0.000000e+00 |
2017-01-02 | -3.586020e-14 | 0.000000e+00 | 0.000000e+00 | 0.000000e+00 |
2017-01-03 | 3.257003e+00 | -3.586020e-14 | 0.000000e+00 | 0.000000e+00 |
2017-01-04 | -2.105813e-01 | 3.257003e+00 | -3.586020e-14 | 0.000000e+00 |
2017-01-05 | -1.304980e-01 | -2.105813e-01 | 3.257003e+00 | -3.586020e-14 |
... | ... | ... | ... | ... |
2017-08-11 | 1.795609e-01 | 8.802533e-01 | 1.126343e+00 | 3.000790e+00 |
2017-08-12 | 1.112449e+00 | 1.795609e-01 | 8.802533e-01 | 1.126343e+00 |
2017-08-13 | -1.466291e+00 | 1.112449e+00 | 1.795609e-01 | 8.802533e-01 |
2017-08-14 | -7.308822e-01 | -1.466291e+00 | 1.112449e+00 | 1.795609e-01 |
2017-08-15 | 1.522645e+00 | -7.308822e-01 | -1.466291e+00 | 1.112449e+00 |
227 rows × 4 columns
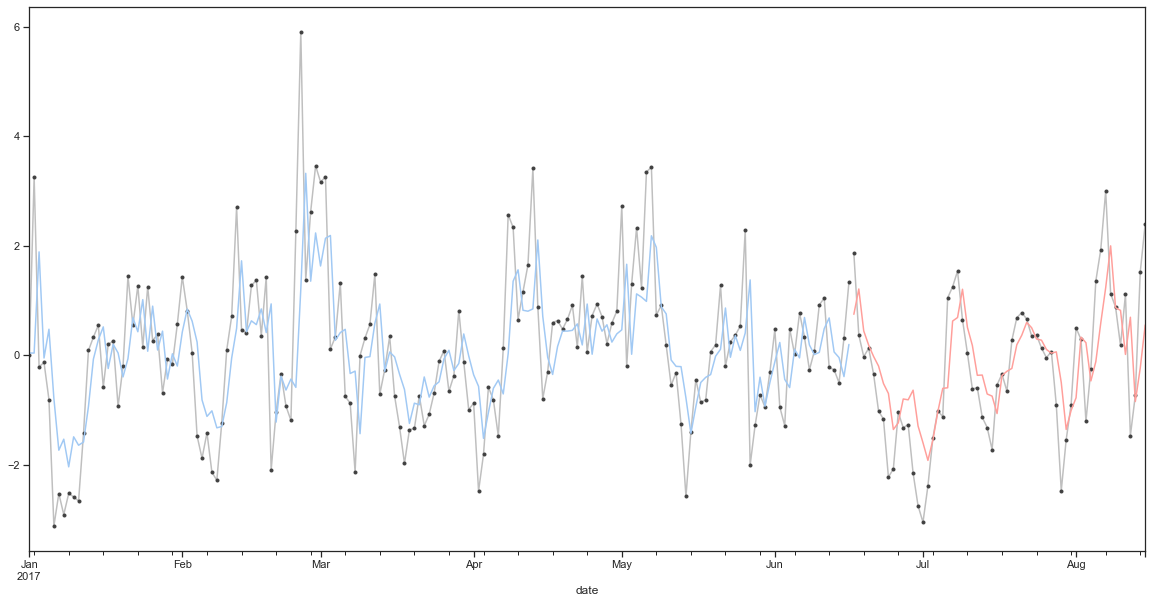
y = y_deseason.copy()
X_train, X_test, y_train, y_test = train_test_split(X, y, test_size=60, shuffle=False)

# 线性回归
model = LinearRegression()
# 模型训练
model.fit(X_train, y_train)
# 预测
y_pred = pd.Series(model.predict(X_train), index=y_train.index)
y_fore = pd.Series(model.predict(X_test), index=y_test.index)

# 绘图
fig, ax = plt.subplots(nrows=1, ncols=1, figsize=(20,10))
ax = y_train.plot(color="0.75",
                  style=".-",
                  markeredgecolor="0.25",
                  markerfacecolor="0.25",
                  ax=ax)

ax = y_test.plot(color="0.75",
                 style=".-",
                 markeredgecolor="0.25",
                 markerfacecolor="0.25",
                 ax=ax)

ax = y_pred.plot(ax=ax)
_ = y_fore.plot(ax=ax, color='C3')

plt.show()
基于混合模型预测
构建混合模型
将XGboost模型和线性回归模型结合起来:
store_sales = train.copy()

store_sales['date'] = store_sales.date.dt.to_period('D')

store_sales = store_sales.set_index(['store_nbr', 'family', 'date']).sort_index()

family_sales = (
    store_sales
    .groupby(['family', 'date'])
    .mean()
    .unstack('family')
    .loc['2017']
)
family_sales.head()
.dataframe tbody tr th:only-of-type { vertical-align: middle; } <pre><code>.dataframe tbody tr th { vertical-align: top; } .dataframe thead tr th { text-align: left; } .dataframe thead tr:last-of-type th { text-align: right; } </code></pre>
id | ... | onpromotion | |||||||||||||||||||
|---|---|---|---|---|---|---|---|---|---|---|---|---|---|---|---|---|---|---|---|---|---|
family | AUTOMOTIVE | BABY CARE | BEAUTY | BEVERAGES | BOOKS | BREAD/BAKERY | CELEBRATION | CLEANING | DAIRY | DELI | ... | MAGAZINES | MEATS | PERSONAL CARE | PET SUPPLIES | PLAYERS AND ELECTRONICS | POULTRY | PREPARED FOODS | PRODUCE | SCHOOL AND OFFICE SUPPLIES | SEAFOOD |
date | |||||||||||||||||||||
2017-01-01 | 2597248.5 | 2597249.5 | 2597250.5 | 2597251.5 | 2597252.5 | 2597253.5 | 2597254.5 | 2597255.5 | 2597256.5 | 2597257.5 | ... | 0.0 | 0.018519 | 0.111111 | 0.018519 | 0.0 | 0.000000 | 0.037037 | 0.129630 | 0.0 | 0.000000 |
2017-01-02 | 2599030.5 | 2599031.5 | 2599032.5 | 2599033.5 | 2599034.5 | 2599035.5 | 2599036.5 | 2599037.5 | 2599038.5 | 2599039.5 | ... | 0.0 | 0.462963 | 10.592593 | 0.537037 | 0.0 | 0.259259 | 1.166667 | 5.629630 | 0.0 | 0.407407 |
2017-01-03 | 2600812.5 | 2600813.5 | 2600814.5 | 2600815.5 | 2600816.5 | 2600817.5 | 2600818.5 | 2600819.5 | 2600820.5 | 2600821.5 | ... | 0.0 | 0.481481 | 9.722222 | 0.444444 | 0.0 | 0.388889 | 1.351852 | 56.296296 | 0.0 | 0.407407 |
2017-01-04 | 2602594.5 | 2602595.5 | 2602596.5 | 2602597.5 | 2602598.5 | 2602599.5 | 2602600.5 | 2602601.5 | 2602602.5 | 2602603.5 | ... | 0.0 | 0.370370 | 12.037037 | 0.444444 | 0.0 | 0.296296 | 5.444444 | 101.277778 | 0.0 | 0.333333 |
2017-01-05 | 2604376.5 | 2604377.5 | 2604378.5 | 2604379.5 | 2604380.5 | 2604381.5 | 2604382.5 | 2604383.5 | 2604384.5 | 2604385.5 | ... | 0.0 | 8.981481 | 5.666667 | 0.000000 | 0.0 | 0.296296 | 0.907407 | 5.018519 | 0.0 | 0.444444 |
5 rows × 99 columns
class BoostedHybrid:
    def __init__(self, model_1, model_2):
        self.model_1 = model_1
        self.model_2 = model_2
        self.y_columns = None


def fit(self, X_1, X_2, y):
    """
    模型训练fit
    """
    # 训练模型1
    self.model_1.fit(X_1, y)

    # 预测
    y_fit = pd.DataFrame(
        self.model_1.predict(X_1),
        index=X_1.index,
        columns=y.columns
    )

    # 计算残差
    y_resid = y - y_fit
    # 宽表转成长表
    y_resid = y_resid.stack().squeeze()

    # 基于残差训练模型2
    self.model_2.fit(X_2, y_resid)
    self.y_columns = y.columns
    self.y_fit = y_fit
    self.y_resid = y_resid

# 将fit方法添加类中
BoostedHybrid.fit = fitdef predict(self, X_1, X_2):
"""
模型预测
"""
y_pred = pd.DataFrame(
self.model_1.predict(X_1),
index=X_1.index,
columns=self.y_columns
)
# 宽表转成长表
y_pred = y_pred.stack().squeeze()
# 将两个模型预测的结果累加
y_pred += self.model_2.predict(X_2)
return y_pred.unstack()
# 将预测predict添加到类中
BoostedHybrid.predict = predict构建数据集
# 目标值y
y = family_sales.loc[:, 'sales']

dp = DeterministicProcess(index=y.index, order=1)
X_1 = dp.in_sample()

# X_2:XBoost
X_2 = family_sales.drop('sales', axis=1).stack()

# family类比编码
le = LabelEncoder()
X_2 = X_2.reset_index('family')
X_2['family'] = le.fit_transform(X_2['family'])

# 季节性特征
X_2["day"] = X_2.index.day
模型训练
model = BoostedHybrid(
    model_1 = LinearRegression(),
    model_2 = XGBRegressor()
)

model.fit(X_1, X_2, y)

y_pred = model.predict(X_1,X_2)
y_pred = y_pred.clip(0.0)# 模型混合
model = BoostedHybrid(
model_1=Ridge(),
model_2=KNeighborsRegressor(),
)# 构造训练集和验证集
y_train, y_valid = y[:"2017-07-01"], y["2017-07-02":]
X1_train, X1_valid = X_1[: "2017-07-01"], X_1["2017-07-02" :]
X2_train, X2_valid = X_2.loc[:"2017-07-01"], X_2.loc["2017-07-02":]# 训练
model.fit(X1_train, X2_train, y_train)
# 预测
y_fit = model.predict(X1_train, X2_train).clip(0.0)
y_pred = model.predict(X1_valid, X2_valid).clip(0.0)预测可视化
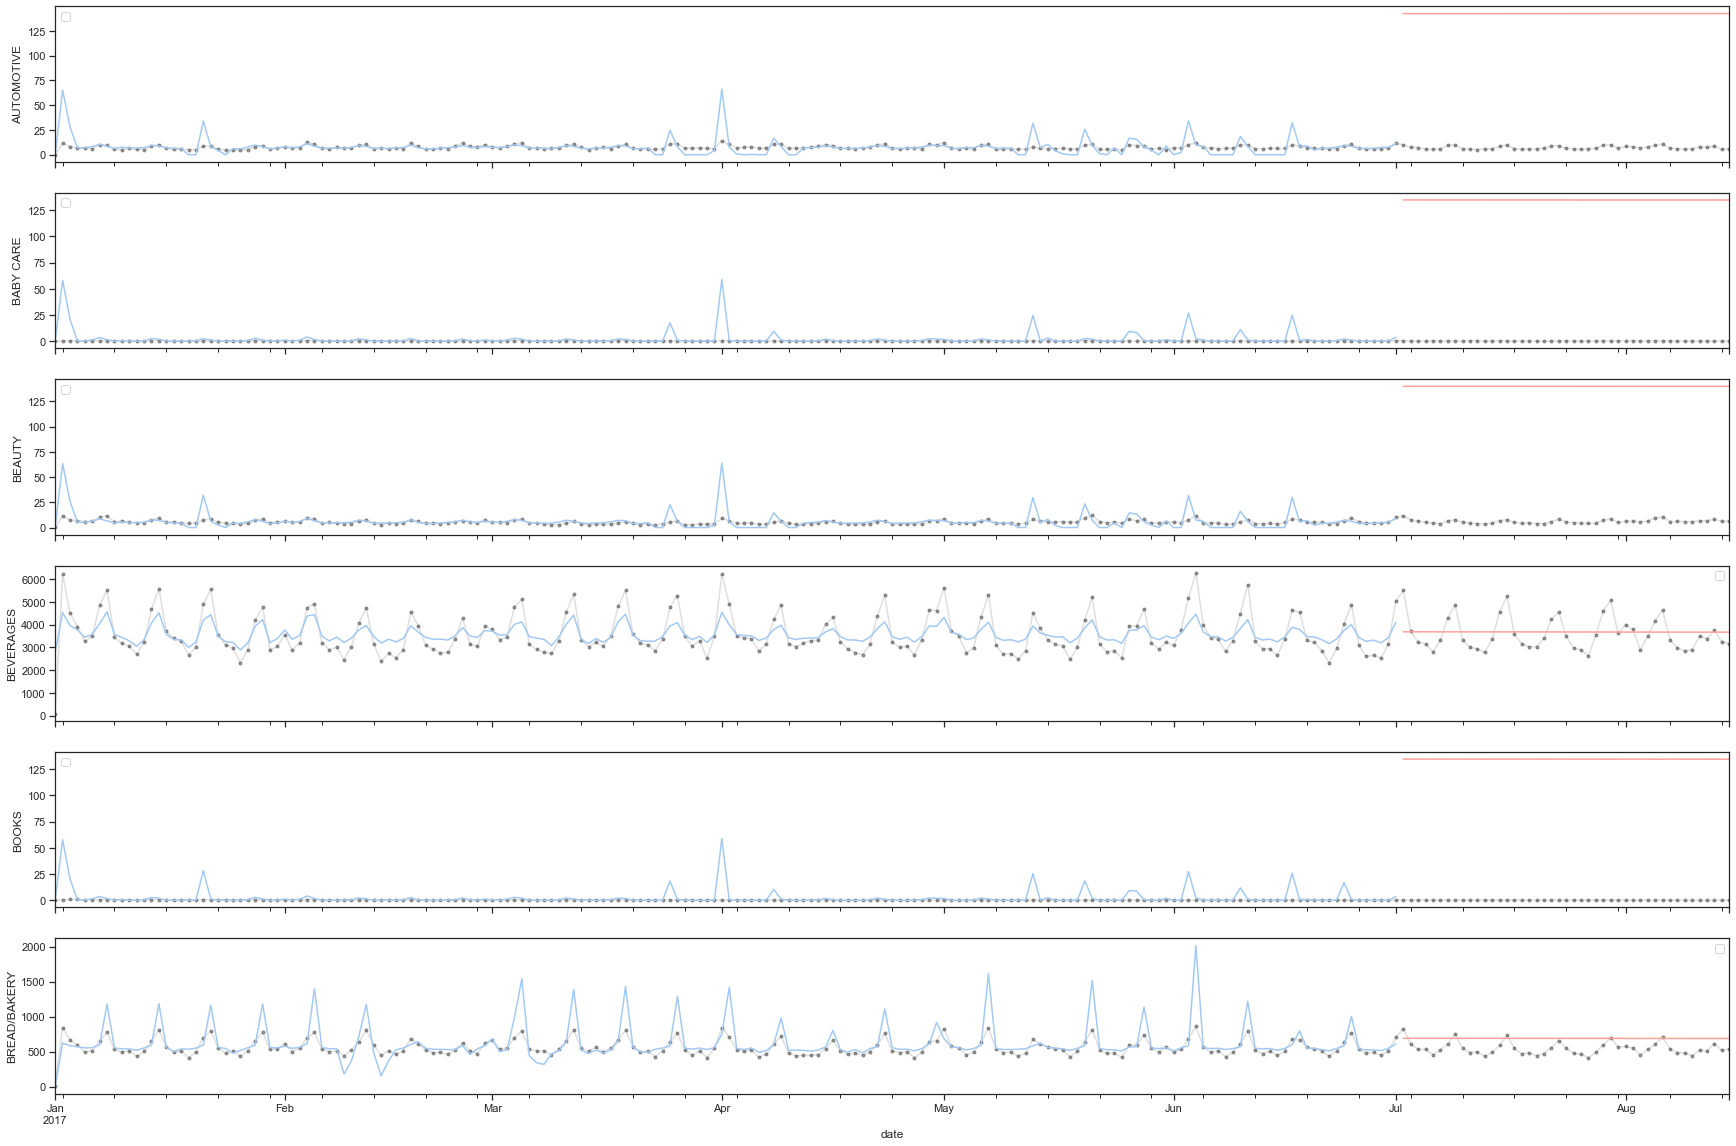
families = y.columns[0:6]
axs = y.loc(axis=1)[families].plot(subplots=True,
                                   sharex=True,
                                   figsize=(30, 20),
                                   color="0.75",
                                   style=".-",
                                   markeredgecolor="0.25",
                                   markerfacecolor="0.25",
                                   alpha=0.5)
_ = y_fit.loc(axis=1)[families].plot(subplots=True,
                                     sharex=True,
                                     color='C0',
                                     ax=axs)
_ = y_pred.loc(axis=1)[families].plot(subplots=True,
                                      sharex=True,
                                      color='C3',
                                      ax=axs)
for ax, family in zip(axs, families):
    ax.legend([])
    ax.set_ylabel(family)
基于机器学习预测
训练集数据
store_sales = train.copy()
store_sales['date'] = store_sales.date.dt.to_period('D')
store_sales = store_sales.set_index(['store_nbr', 'family', 'date']).sort_index()family_sales = (
store_sales
.groupby(['family', 'date'])
.mean()
.unstack('family')
.loc['2017']
)测试集数据
test = test.copy()
test['date'] = test.date.dt.to_period('D')
test = test.set_index(['store_nbr', 'family', 'date']).sort_index()
构建多步预测目标函数
def make_multistep_target(ts, steps):
    return pd.concat(
        {f'y_step_{i + 1}': ts.shift(-i)
         for i in range(steps)},
axis=1)y = family_sales.loc[:, 'sales']
X = make_lags(y, lags=5).dropna()
# 构建多步预测
y = make_multistep_target(y, steps=16).dropna()
y, X = y.align(X, join='inner', axis=0)# 准备好输入到XGBoost模型的数据
le = LabelEncoder()
X = (X
.stack('family')
.reset_index('family')
.assign(family=lambda x: le.fit_transform(x.family)) # 编码
)
y = y.stack('family') # 宽表转成长表
y.dataframe tbody tr th:only-of-type { vertical-align: middle; } <pre><code>.dataframe tbody tr th { vertical-align: top; } .dataframe thead th { text-align: right; } </code></pre>
y_step_1 | y_step_2 | y_step_3 | y_step_4 | y_step_5 | y_step_6 | y_step_7 | y_step_8 | y_step_9 | y_step_10 | y_step_11 | y_step_12 | y_step_13 | y_step_14 | y_step_15 | y_step_16 | ||
|---|---|---|---|---|---|---|---|---|---|---|---|---|---|---|---|---|---|
date | family | ||||||||||||||||
2017-01-06 | AUTOMOTIVE | 6.018519 | 10.259259 | 9.388889 | 5.944444 | 4.777778 | 6.314815 | 5.388889 | 5.240741 | 8.500000 | 10.259259 | 6.407407 | 5.685185 | 5.703704 | 4.777778 | 5.148148 | 8.685185 |
BABY CARE | 0.277778 | 0.259259 | 0.240741 | 0.444444 | 0.240741 | 0.277778 | 0.296296 | 0.296296 | 0.388889 | 0.425926 | 0.314815 | 0.166667 | 0.222222 | 0.129630 | 0.166667 | 0.277778 | |
BEAUTY | 6.518519 | 10.037037 | 11.611111 | 5.648148 | 6.500000 | 5.277778 | 4.370370 | 4.703704 | 7.777778 | 9.037037 | 5.648148 | 5.351852 | 4.740741 | 3.981481 | 4.592593 | 7.111111 | |
BEVERAGES | 3507.277778 | 4848.518519 | 5503.648148 | 3448.203704 | 3171.740741 | 3046.870370 | 2693.722222 | 3226.037037 | 4667.296296 | 5580.611111 | 3700.370370 | 3409.796296 | 3263.462963 | 2676.574074 | 3003.555556 | 4900.611111 | |
BOOKS | 0.537037 | 0.481481 | 0.722222 | 0.500000 | 0.518519 | 0.481481 | 0.388889 | 0.444444 | 0.574074 | 0.555556 | 0.388889 | 0.500000 | 0.407407 | 0.277778 | 0.351852 | 0.685185 | |
... | ... | ... | ... | ... | ... | ... | ... | ... | ... | ... | ... | ... | ... | ... | ... | ... | ... |
2017-07-31 | POULTRY | 364.955648 | 403.601334 | 377.313980 | 316.436093 | 533.497054 | 416.454018 | 464.596557 | 344.051740 | 313.780869 | 305.270204 | 278.819870 | 468.857370 | 354.342779 | 379.801204 | 344.398297 | 325.679815 |
PREPARED FOODS | 84.698648 | 87.836796 | 88.735963 | 77.173000 | 91.886760 | 100.384963 | 102.248148 | 86.627444 | 77.344130 | 84.796537 | 78.791444 | 96.286926 | 84.693815 | 91.509426 | 86.062500 | 85.954129 | |
PRODUCE | 2257.140589 | 2609.180150 | 3122.895724 | 1792.220910 | 2079.319469 | 2418.970157 | 2675.105815 | 2111.133423 | 2168.535465 | 2663.076241 | 1670.264889 | 2198.854500 | 2070.154646 | 2331.922267 | 2134.399926 | 2316.832796 | |
SCHOOL AND OFFICE SUPPLIES | 30.111111 | 49.333333 | 57.481481 | 51.907407 | 63.222222 | 85.203704 | 100.277778 | 64.407407 | 59.759259 | 53.740741 | 42.962963 | 65.240741 | 67.481481 | 68.851852 | 52.333333 | 46.851852 | |
SEAFOOD | 20.488333 | 20.346852 | 20.801037 | 17.116296 | 25.553963 | 24.209519 | 23.512852 | 18.419852 | 18.481130 | 18.181426 | 13.284463 | 23.566963 | 19.037593 | 20.704574 | 17.975556 | 17.966241 |
6831 rows × 16 columns
建模预测
# 模型实例化
model = RegressorChain(base_estimator=XGBRegressor())

# 模型预测
model.fit(X, y)
# 预测结果
y_pred = pd.DataFrame(model.predict(X),
                      index=y.index,
                      columns=y.columns).clip(0.0)
预测可视化
def plot_multistep(y, every=1, ax=None, palette_kwargs=None):
    palette_kwargs_ = dict(palette='husl', n_colors=16, desat=None)
    if palette_kwargs is not None:
        palette_kwargs_.update(palette_kwargs)
    palette = sns.color_palette(**palette_kwargs_)
    if ax is None:
        fig, ax = plt.subplots()
    ax.set_prop_cycle(plt.cycler('color', palette))
    for date, preds in y[::every].iterrows():
        preds.index = pd.period_range(start=date, periods=len(preds))
        preds.plot(ax=ax)
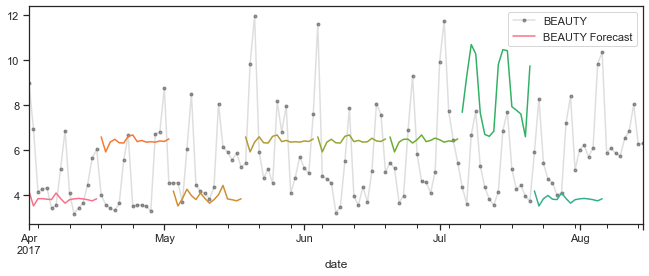
return axFAMILY = 'BEAUTY'
START = '2017-04-01'
EVERY = 16
y_pred_ = y_pred.xs(FAMILY, level='family', axis=0).loc[START:]
y_ = family_sales.loc[START:, 'sales'].loc[:, FAMILY]
fig, ax = plt.subplots(1, 1, figsize=(11, 4))
ax = y_.plot(color="0.75",style=".-",markeredgecolor="0.25", markerfacecolor="0.25",ax=ax, alpha=0.5)
ax = plot_multistep(y_pred_, ax=ax, every=EVERY)
_ = ax.legend([FAMILY, FAMILY + ' Forecast'])
本文参与 腾讯云自媒体同步曝光计划,分享自作者个人站点/博客。
原始发表:2023-3-15,如有侵权请联系 cloudcommunity@tencent.com 删除
评论
登录后参与评论
推荐阅读
目录


